Decision Making in Business and Politics
VerifiedAdded on 2019/12/28
|25
|7102
|185
Report
AI Summary
This assignment content collection provides insights into various aspects of decision-making in business and politics. The articles cover topics such as information seeking among individuals and groups, growth phases and survival in international business-to-business new ventures, and the role of top management team's international orientation in strategic decision-making. Additionally, the articles discuss heuristic decision making, multiple attribute decision making, and the use of informal learning for business decision-making and knowledge management. The collection also explores the importance of accounting for decision-making and control, as well as prediction and decision-making in healthcare using data mining.
Contribute Materials
Your contribution can guide someone’s learning journey. Share your
documents today.
BUSINESS DECISION
MAKING
MAKING
Secure Best Marks with AI Grader
Need help grading? Try our AI Grader for instant feedback on your assignments.
Table of Contents
INTRODUCTION...........................................................................................................................3
TASK 1............................................................................................................................................3
1.1 Prepare a plan........................................................................................................................3
1.2 Survey methodology and sample framing.............................................................................4
1.3 Questionnaire of data ...........................................................................................................5
TASK 2............................................................................................................................................6
2.1 & 2.2 Data summarisation and its analysis...........................................................................6
2.3 Analyse the data by using measure of dispersion.................................................................7
2.4 Use of quartile, percentile and correlation coefficient..........................................................8
TASK 3..........................................................................................................................................10
3.1 Graph ..................................................................................................................................10
3.2 Trend line............................................................................................................................11
3.3To be covered in power point presentation .........................................................................12
3.4 Formal business report........................................................................................................12
TASK 4..........................................................................................................................................13
4.1 Use of software in decision making....................................................................................13
4.2 Project plan and critical path activity..................................................................................14
4.3 Financing tools uses in taking investing decision ..............................................................15
CONLCUSION .............................................................................................................................16
REFERENCES .............................................................................................................................17
INTRODUCTION
Organisation have to take such decision which are helpful for them in their long run. For
any company success it is compulsory for them to take such type of decision which are beneficial
for them. It helps them in making their result effective so that their survival can become easy. It
leads in making their work effective in the keen competitive market. So they have to analyse all
the market opportunities and risk which they are going to suffer during their business. The
present report is based on the UKCBC which is a institute (Craft, 2013). They want to attain
target number of students by providing them proper education and other facilities. For this
concern they hire quality assurance agency for preparing a analytical report. For this thing
company conduct the primary and secondary survey and gather all the necessary data which they
want to collect. Along with this they also prepare a questionnaire through which their research
become easy to analyse. Moreover they also perform some other function which leads in making
the understandability easy.
TASK 1
1.1 Prepare a plan
For preparing any plan it is compulsory to analyse the customer preference through which
decision making become easy. Organisation can use different material which are helpful for
making their research effective and proper. These research tools are for the long run purpose to
understand the needs and demands. Plan have to get formulated on the basis of research analysis
for this concern different sources of information are taken into account which are:1. Primary
source 2. Secondary source
A appropriate plan have to be prepare for collecting and creating data. Majorly college
have 4 campus which are at Park royal, Crickk wood, Lord house, Wenfooth house. Majorly
survey is going to be conducted at these four locations on 100 respondents. The research is going
to be conducted by student representative who have to firstly create a plan in which all work get
done in a systematic manner (Brynjolfsson, Hitt and Kim, 2011). By using a perfect plan for
investigation it is become easy for him to reduce the cost which is going to be incur on project as
well as right information get collected through that.
Time: The duration of a survey is of one week which is a time limit for a student
representative to present report in front of QAA. This enables in organise research in a
systematic manner and all targets which are set at the time of preparation get done
accordingly.
Methods: For this research purpose various number of methods get identified like
personal interviews, questionnaire etc. Out of all these one of a best path have to be
choose which aid them in collecting data. For this research cost efficient technique for
research is questionnaire because it get done on more than 50 students at one time where
as on the other hand personal interview takes so much time in execution and it incur more
cost (Cronan and et. al., 2011).
Methods which are used: There are variety number of data can be collected by a
researcher for investigation like primary, secondary, qualitative and quantitative. Primary
data is one which get collected through one to one survey where as secondary is one in
which judgement can be taken on the basis of internet articles etc. Qualitative data is
based on quality preferences in which the research get done in depth and can be analyse
on the basis of feeling. Quantitative data is one which can express in terms of numbers.
This is beneficial for analyse and take decision more appropriately.
Budget: Budget is an essential thing which every individual have to take in their account.
For this purpose of research representative have to prepare a budget plan in which all
such values which lead to incur for a project have to get included. By using this concept
in account, representative can conduct a cost efficient research. The cost which get incur
on this survey is £3500 and a researcher have to complete the survey in provided budget.
If whole money lead to get utilise properly then it is consider as one of a best and
appropriate utilisation of resource and report become effective in nature.
1.2 Survey methodology and sample framing
Survey methodology is a process which helps in collecting the data through different sources. It
helps in gathering out the data with the help of different tools and techniques. The survey
methodology is a method which is conducting in the form of survey for gathering and collecting
the data. Survey is made on the number of people and their opinion are get bind for making a
effective result (Barry and Edgman-Levitan, 2012).
Secure Best Marks with AI Grader
Need help grading? Try our AI Grader for instant feedback on your assignments.
Survey can be conducted with the help of questionnaire framing. It enables an individual
to ask some number of questions on which research is based. According to the current scenario it
is identified that QAA use this approach on 210 students and ask certain number of questions to
them for getting their opinion.
This leads in college benefits because they can provide the number of courses and other
facilities through this research. The questions which are asked to the groups considered the
respondent and company make a statical form data with the help of that. This is termed as the
survey methodology(Fassin and Buelens, 2011).
The process or method which is agency is going to use for this result is random sample
framing in which randomly a group of certain number of people are identify by taking all of
them as a base of entire population. Agency have to conduct this research while taking a group of
student in their consideration. This enables them to get the effective result.
Random sampling helps in making the result effective because all of the people which are
includes while performing this sample framing are different from each other. They do no have
same interest for a common concern for which the research is conducted(Fernando and
Chowdhury, 2010).
So survey methodology helps in making the research on other group of people.
1.3 Questionnaire of data
For a investigation there are variety number of approaches are used by a researcher
through which adequate amount of information can be gather. Questionnaire is an element in
which variety number of questions are asked to some number of respondent. This process enable
them in identify the opinion of different number of respondent. There are various number of
questionnaire are used by any investigator which provide a support to take appropriate decision.
The various questionnaire which can used by student representative for presenting research are
as follow:
1. Structured
2. Unstructured
3. Open ended
4. Close ended
5. Mixed
6. Pictorial
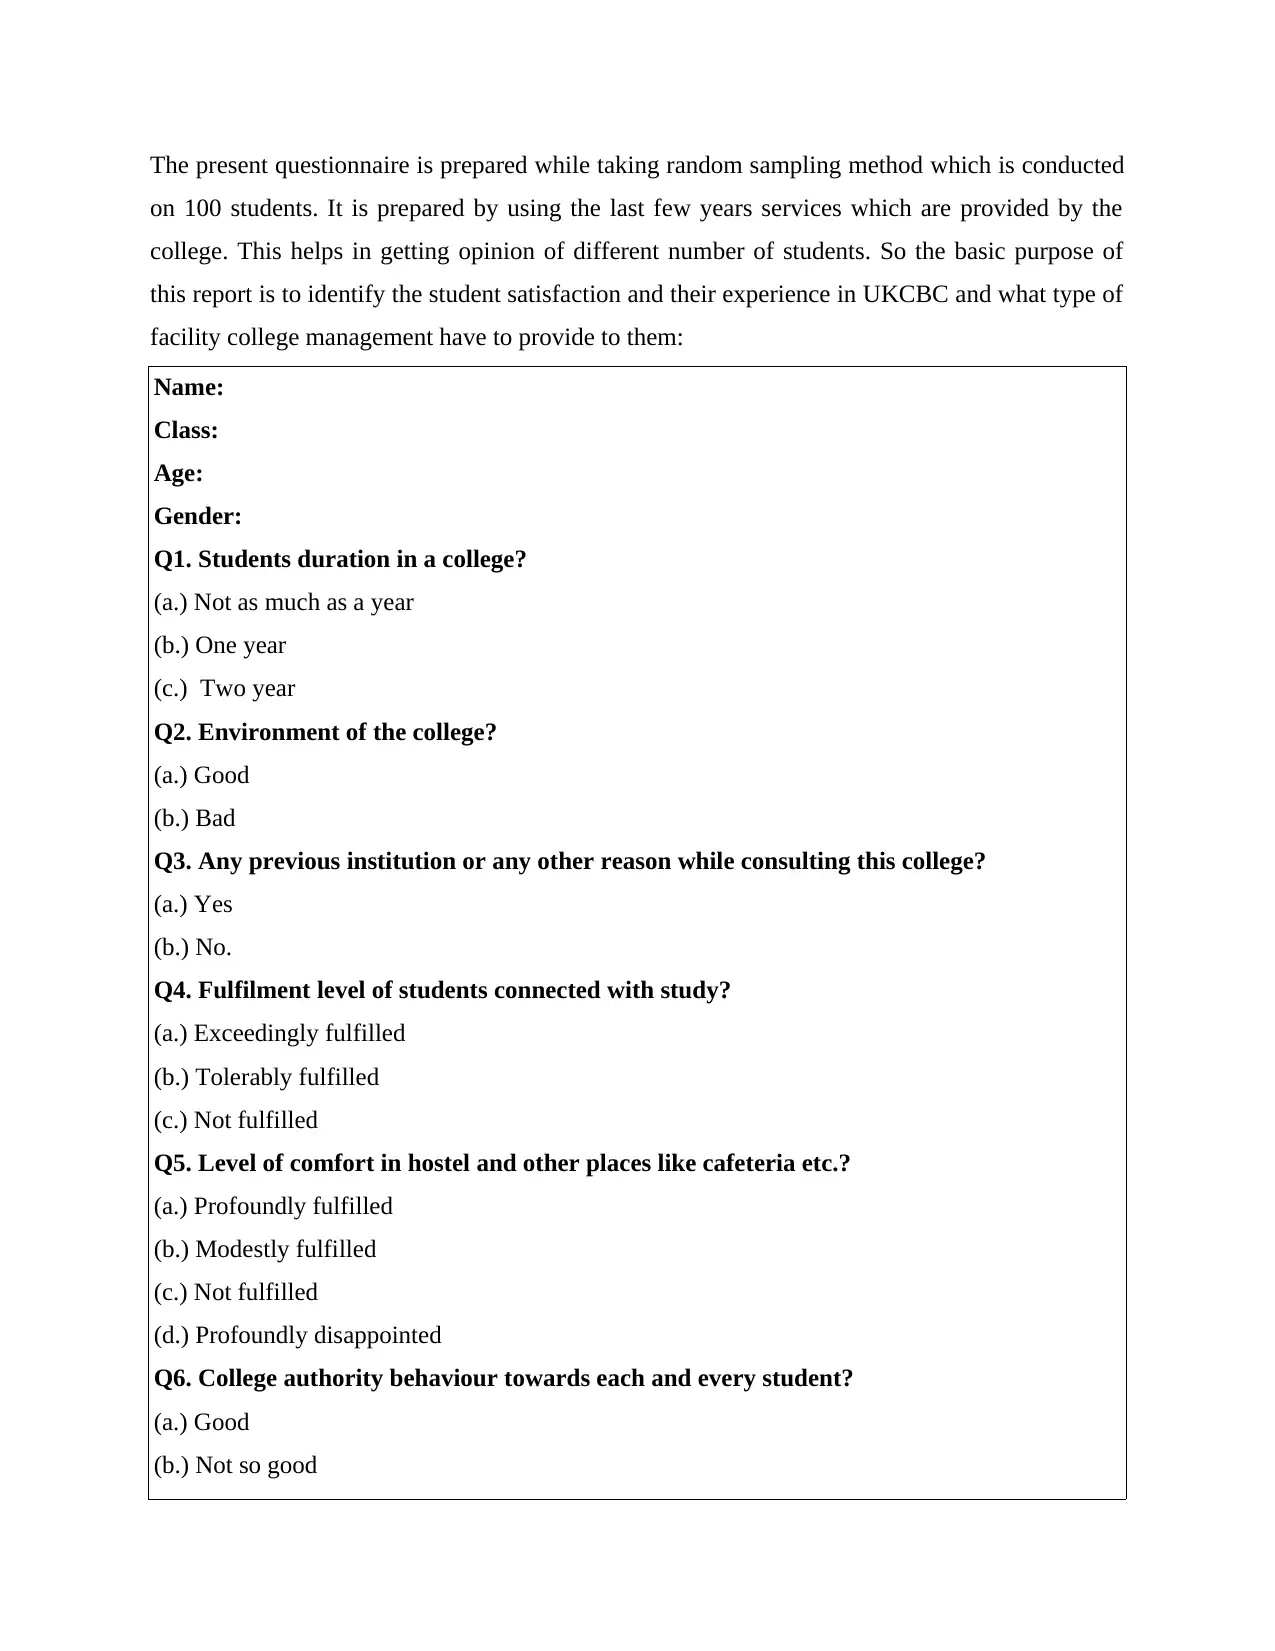
The present questionnaire is prepared while taking random sampling method which is conducted
on 100 students. It is prepared by using the last few years services which are provided by the
college. This helps in getting opinion of different number of students. So the basic purpose of
this report is to identify the student satisfaction and their experience in UKCBC and what type of
facility college management have to provide to them:
Name:
Class:
Age:
Gender:
Q1. Students duration in a college?
(a.) Not as much as a year
(b.) One year
(c.) Two year
Q2. Environment of the college?
(a.) Good
(b.) Bad
Q3. Any previous institution or any other reason while consulting this college?
(a.) Yes
(b.) No.
Q4. Fulfilment level of students connected with study?
(a.) Exceedingly fulfilled
(b.) Tolerably fulfilled
(c.) Not fulfilled
Q5. Level of comfort in hostel and other places like cafeteria etc.?
(a.) Profoundly fulfilled
(b.) Modestly fulfilled
(c.) Not fulfilled
(d.) Profoundly disappointed
Q6. College authority behaviour towards each and every student?
(a.) Good
(b.) Not so good
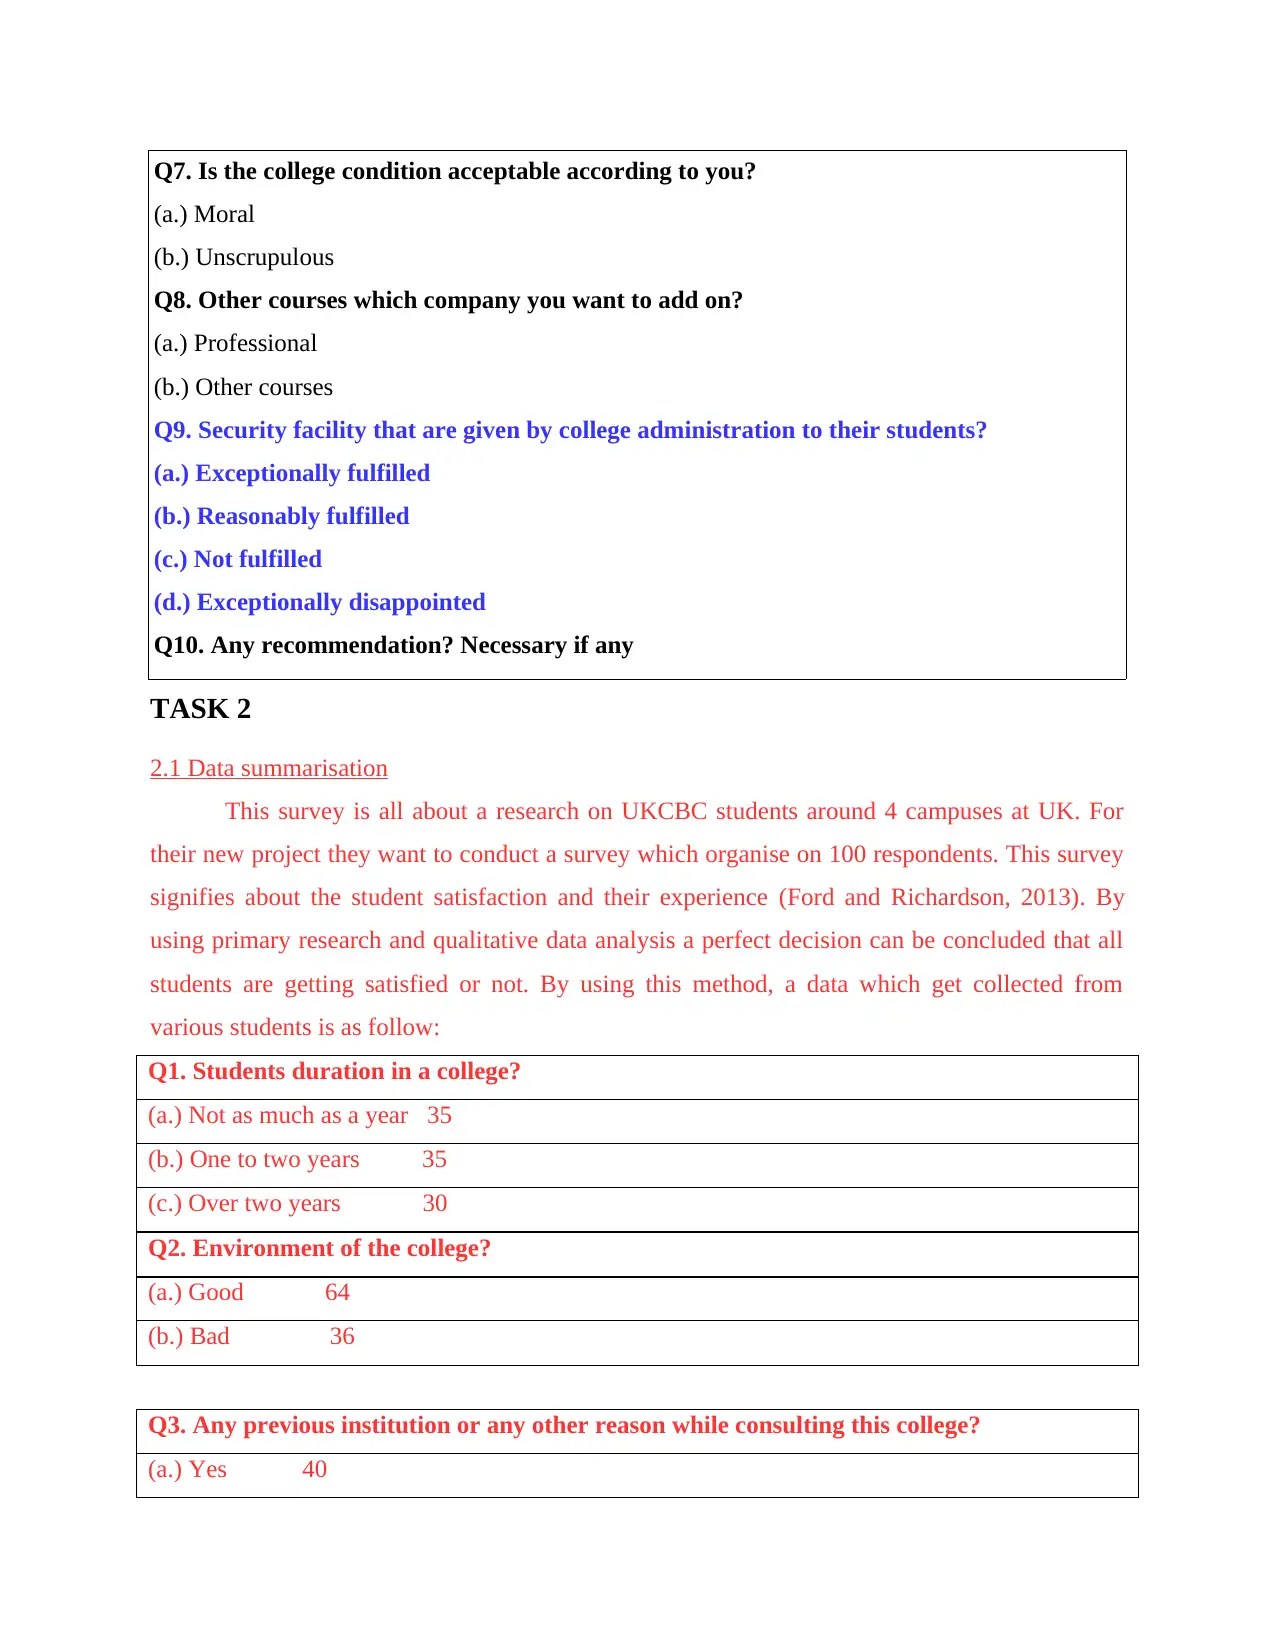
Q7. Is the college condition acceptable according to you?
(a.) Moral
(b.) Unscrupulous
Q8. Other courses which company you want to add on?
(a.) Professional
(b.) Other courses
Q9. Security facility that are given by college administration to their students?
(a.) Exceptionally fulfilled
(b.) Reasonably fulfilled
(c.) Not fulfilled
(d.) Exceptionally disappointed
Q10. Any recommendation? Necessary if any
TASK 2
2.1 Data summarisation
This survey is all about a research on UKCBC students around 4 campuses at UK. For
their new project they want to conduct a survey which organise on 100 respondents. This survey
signifies about the student satisfaction and their experience (Ford and Richardson, 2013). By
using primary research and qualitative data analysis a perfect decision can be concluded that all
students are getting satisfied or not. By using this method, a data which get collected from
various students is as follow:
Q1. Students duration in a college?
(a.) Not as much as a year 35
(b.) One to two years 35
(c.) Over two years 30
Q2. Environment of the college?
(a.) Good 64
(b.) Bad 36
Q3. Any previous institution or any other reason while consulting this college?
(a.) Yes 40
Paraphrase This Document
Need a fresh take? Get an instant paraphrase of this document with our AI Paraphraser
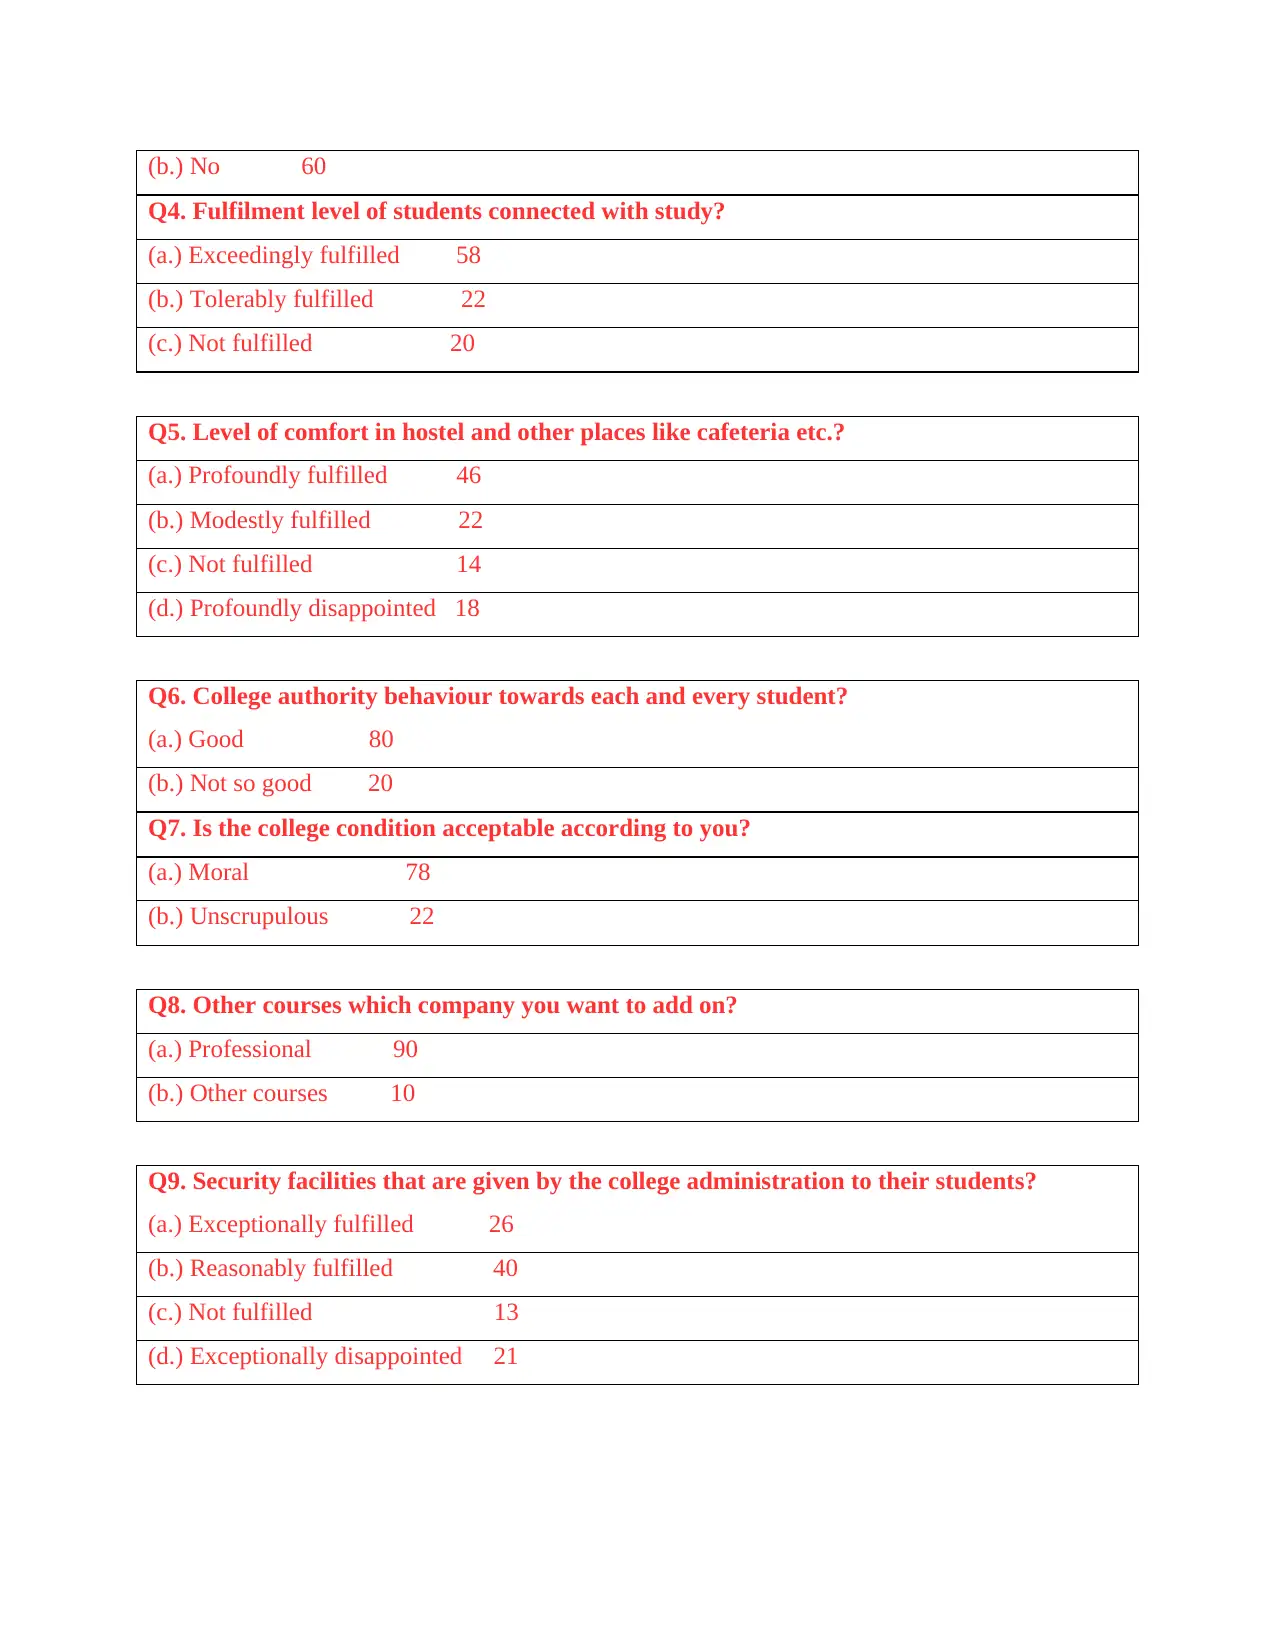
(b.) No 60
Q4. Fulfilment level of students connected with study?
(a.) Exceedingly fulfilled 58
(b.) Tolerably fulfilled 22
(c.) Not fulfilled 20
Q5. Level of comfort in hostel and other places like cafeteria etc.?
(a.) Profoundly fulfilled 46
(b.) Modestly fulfilled 22
(c.) Not fulfilled 14
(d.) Profoundly disappointed 18
Q6. College authority behaviour towards each and every student?
(a.) Good 80
(b.) Not so good 20
Q7. Is the college condition acceptable according to you?
(a.) Moral 78
(b.) Unscrupulous 22
Q8. Other courses which company you want to add on?
(a.) Professional 90
(b.) Other courses 10
Q9. Security facilities that are given by the college administration to their students?
(a.) Exceptionally fulfilled 26
(b.) Reasonably fulfilled 40
(c.) Not fulfilled 13
(d.) Exceptionally disappointed 21
2.2 Data analysis
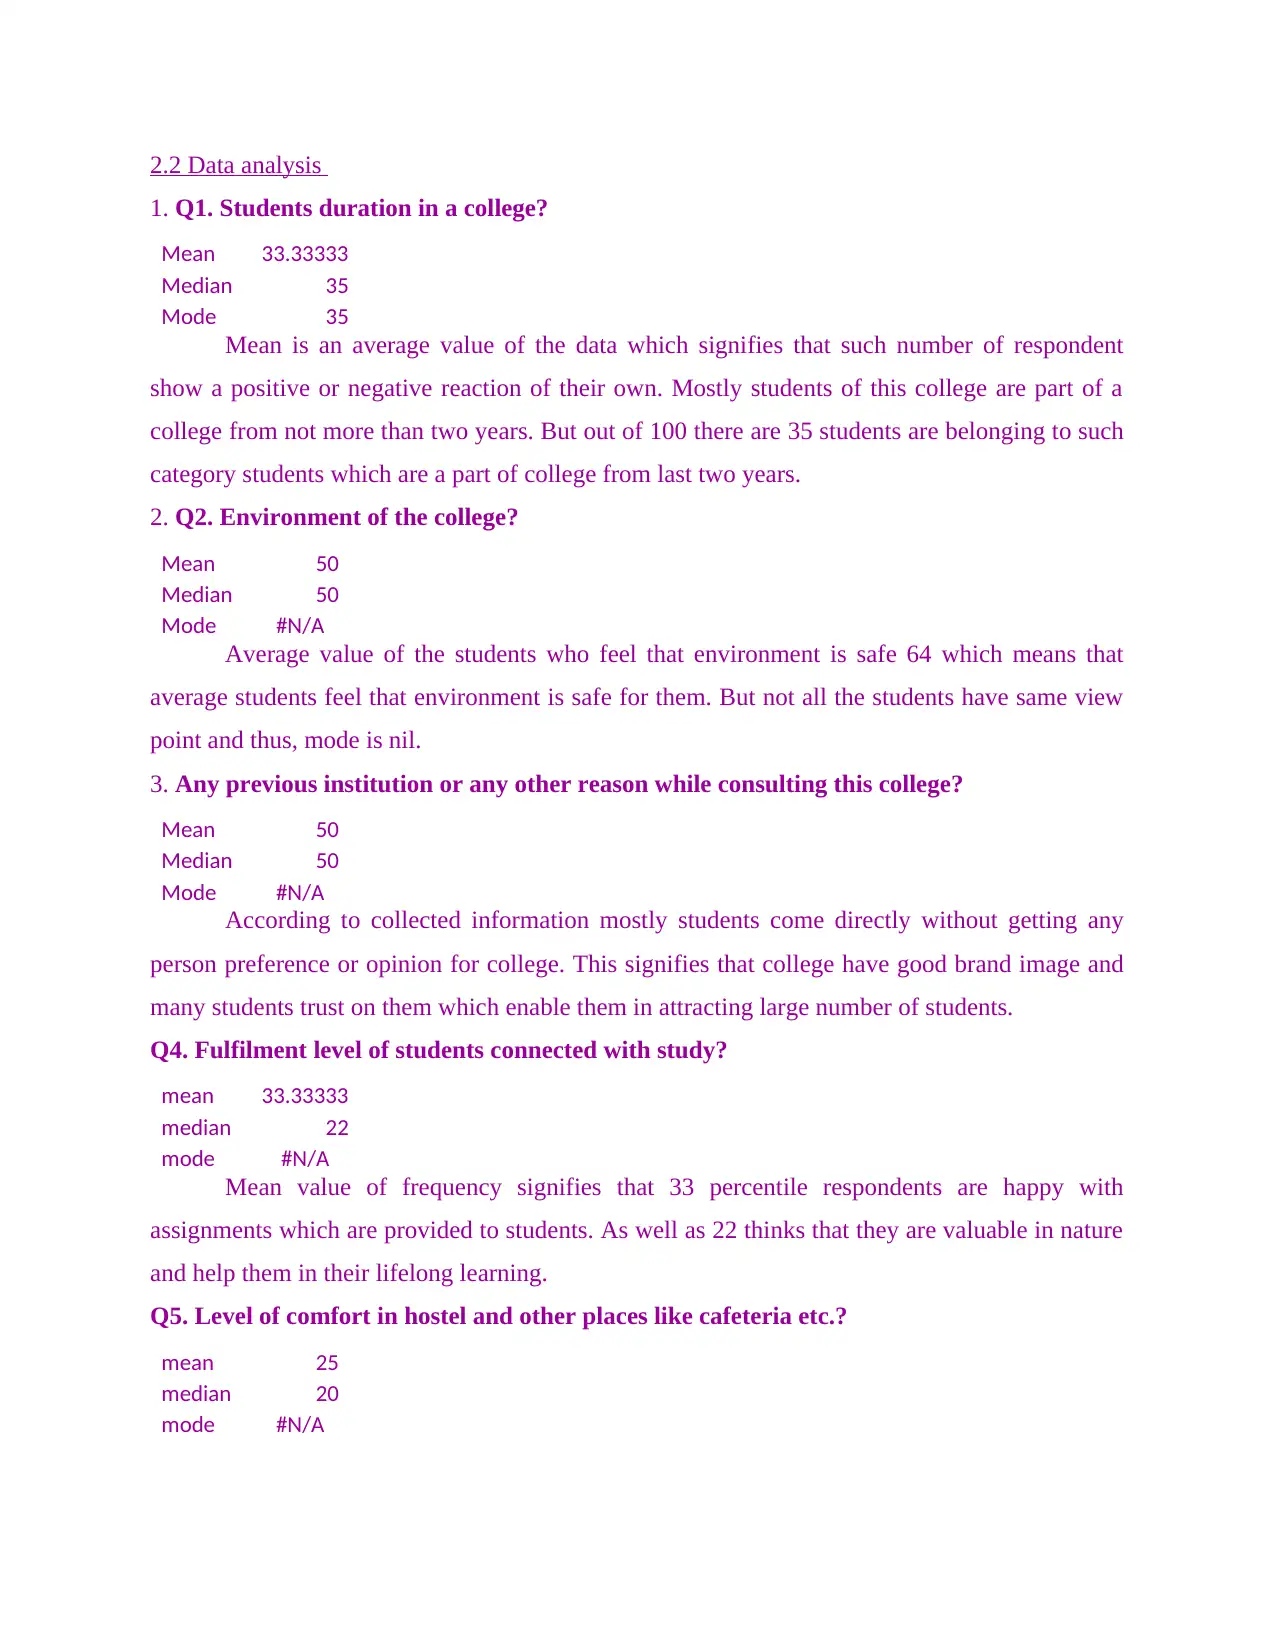
1. Q1. Students duration in a college?
Mean 33.33333
Median 35
Mode 35
Mean is an average value of the data which signifies that such number of respondent
show a positive or negative reaction of their own. Mostly students of this college are part of a
college from not more than two years. But out of 100 there are 35 students are belonging to such
category students which are a part of college from last two years.
2. Q2. Environment of the college?
Mean 50
Median 50
Mode #N/A
Average value of the students who feel that environment is safe 64 which means that
average students feel that environment is safe for them. But not all the students have same view
point and thus, mode is nil.
3. Any previous institution or any other reason while consulting this college?
Mean 50
Median 50
Mode #N/A
According to collected information mostly students come directly without getting any
person preference or opinion for college. This signifies that college have good brand image and
many students trust on them which enable them in attracting large number of students.
Q4. Fulfilment level of students connected with study?
mean 33.33333
median 22
mode #N/A
Mean value of frequency signifies that 33 percentile respondents are happy with
assignments which are provided to students. As well as 22 thinks that they are valuable in nature
and help them in their lifelong learning.
Q5. Level of comfort in hostel and other places like cafeteria etc.?
mean 25
median 20
mode #N/A
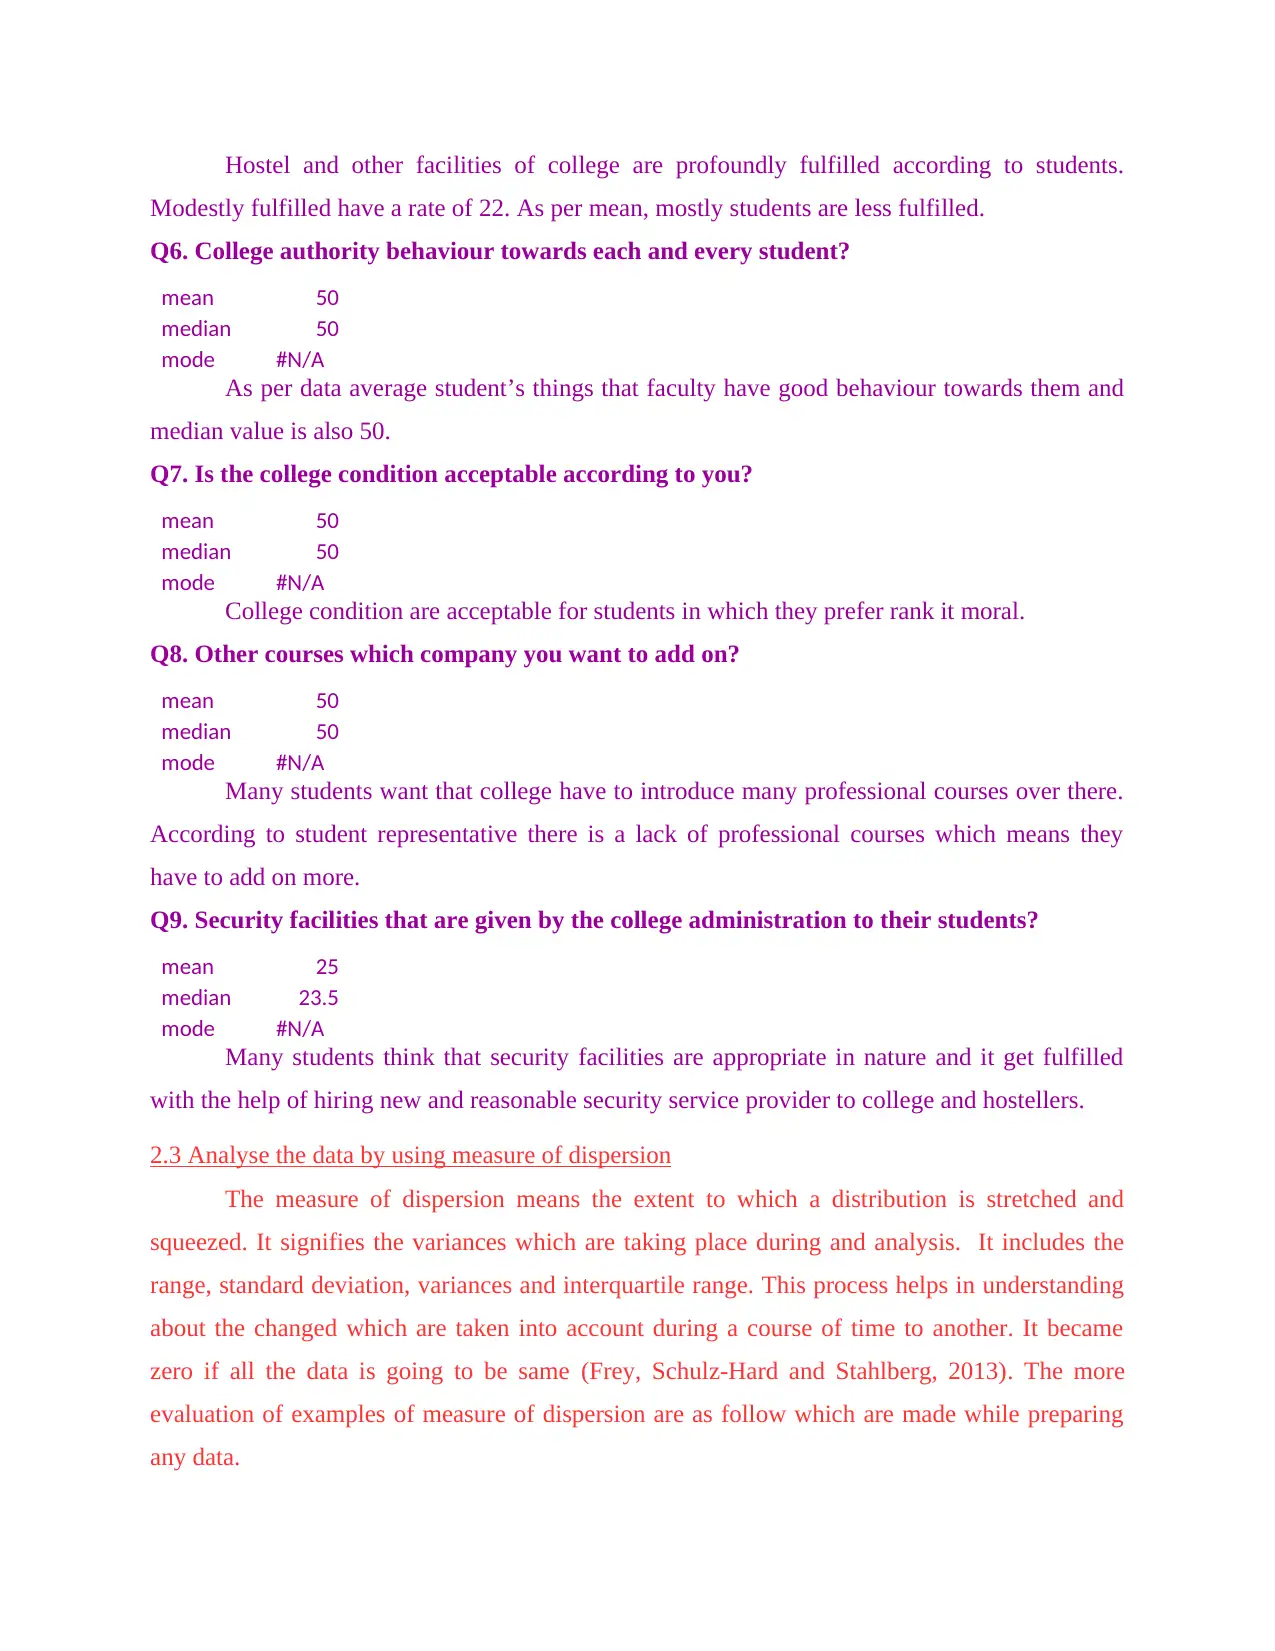
Hostel and other facilities of college are profoundly fulfilled according to students.
Modestly fulfilled have a rate of 22. As per mean, mostly students are less fulfilled.
Q6. College authority behaviour towards each and every student?
mean 50
median 50
mode #N/A
As per data average student’s things that faculty have good behaviour towards them and
median value is also 50.
Q7. Is the college condition acceptable according to you?
mean 50
median 50
mode #N/A
College condition are acceptable for students in which they prefer rank it moral.
Q8. Other courses which company you want to add on?
mean 50
median 50
mode #N/A
Many students want that college have to introduce many professional courses over there.
According to student representative there is a lack of professional courses which means they
have to add on more.
Q9. Security facilities that are given by the college administration to their students?
mean 25
median 23.5
mode #N/A
Many students think that security facilities are appropriate in nature and it get fulfilled
with the help of hiring new and reasonable security service provider to college and hostellers.
2.3 Analyse the data by using measure of dispersion
The measure of dispersion means the extent to which a distribution is stretched and
squeezed. It signifies the variances which are taking place during and analysis. It includes the
range, standard deviation, variances and interquartile range. This process helps in understanding
about the changed which are taken into account during a course of time to another. It became
zero if all the data is going to be same (Frey, Schulz-Hard and Stahlberg, 2013). The more
evaluation of examples of measure of dispersion are as follow which are made while preparing
any data.
Secure Best Marks with AI Grader
Need help grading? Try our AI Grader for instant feedback on your assignments.
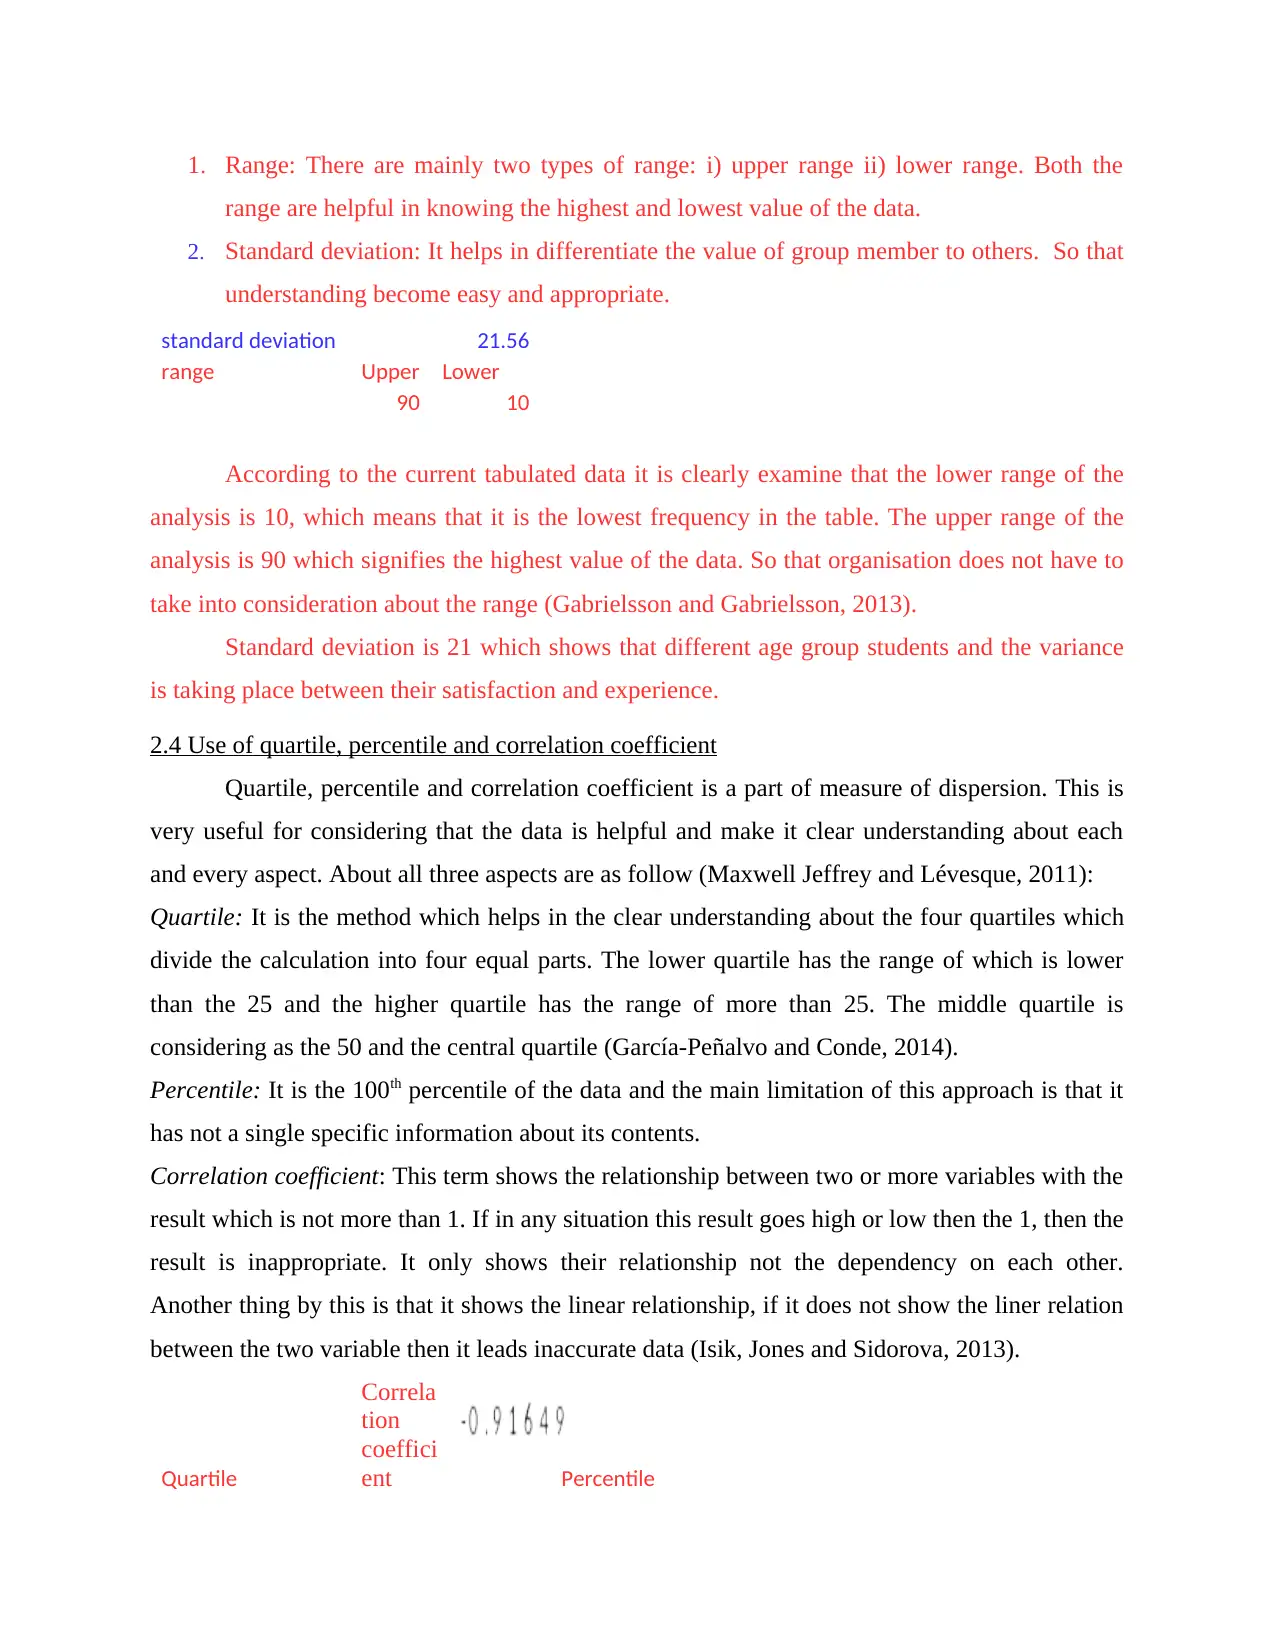
1. Range: There are mainly two types of range: i) upper range ii) lower range. Both the
range are helpful in knowing the highest and lowest value of the data.
2. Standard deviation: It helps in differentiate the value of group member to others. So that
understanding become easy and appropriate.
standard deviation 21.56
range Upper Lower
90 10
According to the current tabulated data it is clearly examine that the lower range of the
analysis is 10, which means that it is the lowest frequency in the table. The upper range of the
analysis is 90 which signifies the highest value of the data. So that organisation does not have to
take into consideration about the range (Gabrielsson and Gabrielsson, 2013).
Standard deviation is 21 which shows that different age group students and the variance
is taking place between their satisfaction and experience.
2.4 Use of quartile, percentile and correlation coefficient
Quartile, percentile and correlation coefficient is a part of measure of dispersion. This is
very useful for considering that the data is helpful and make it clear understanding about each
and every aspect. About all three aspects are as follow (Maxwell Jeffrey and Lévesque, 2011):
Quartile: It is the method which helps in the clear understanding about the four quartiles which
divide the calculation into four equal parts. The lower quartile has the range of which is lower
than the 25 and the higher quartile has the range of more than 25. The middle quartile is
considering as the 50 and the central quartile (García-Peñalvo and Conde, 2014).
Percentile: It is the 100th percentile of the data and the main limitation of this approach is that it
has not a single specific information about its contents.
Correlation coefficient: This term shows the relationship between two or more variables with the
result which is not more than 1. If in any situation this result goes high or low then the 1, then the
result is inappropriate. It only shows their relationship not the dependency on each other.
Another thing by this is that it shows the linear relationship, if it does not show the liner relation
between the two variable then it leads inaccurate data (Isik, Jones and Sidorova, 2013).
Quartile
Correla
tion
coeffici
ent Percentile
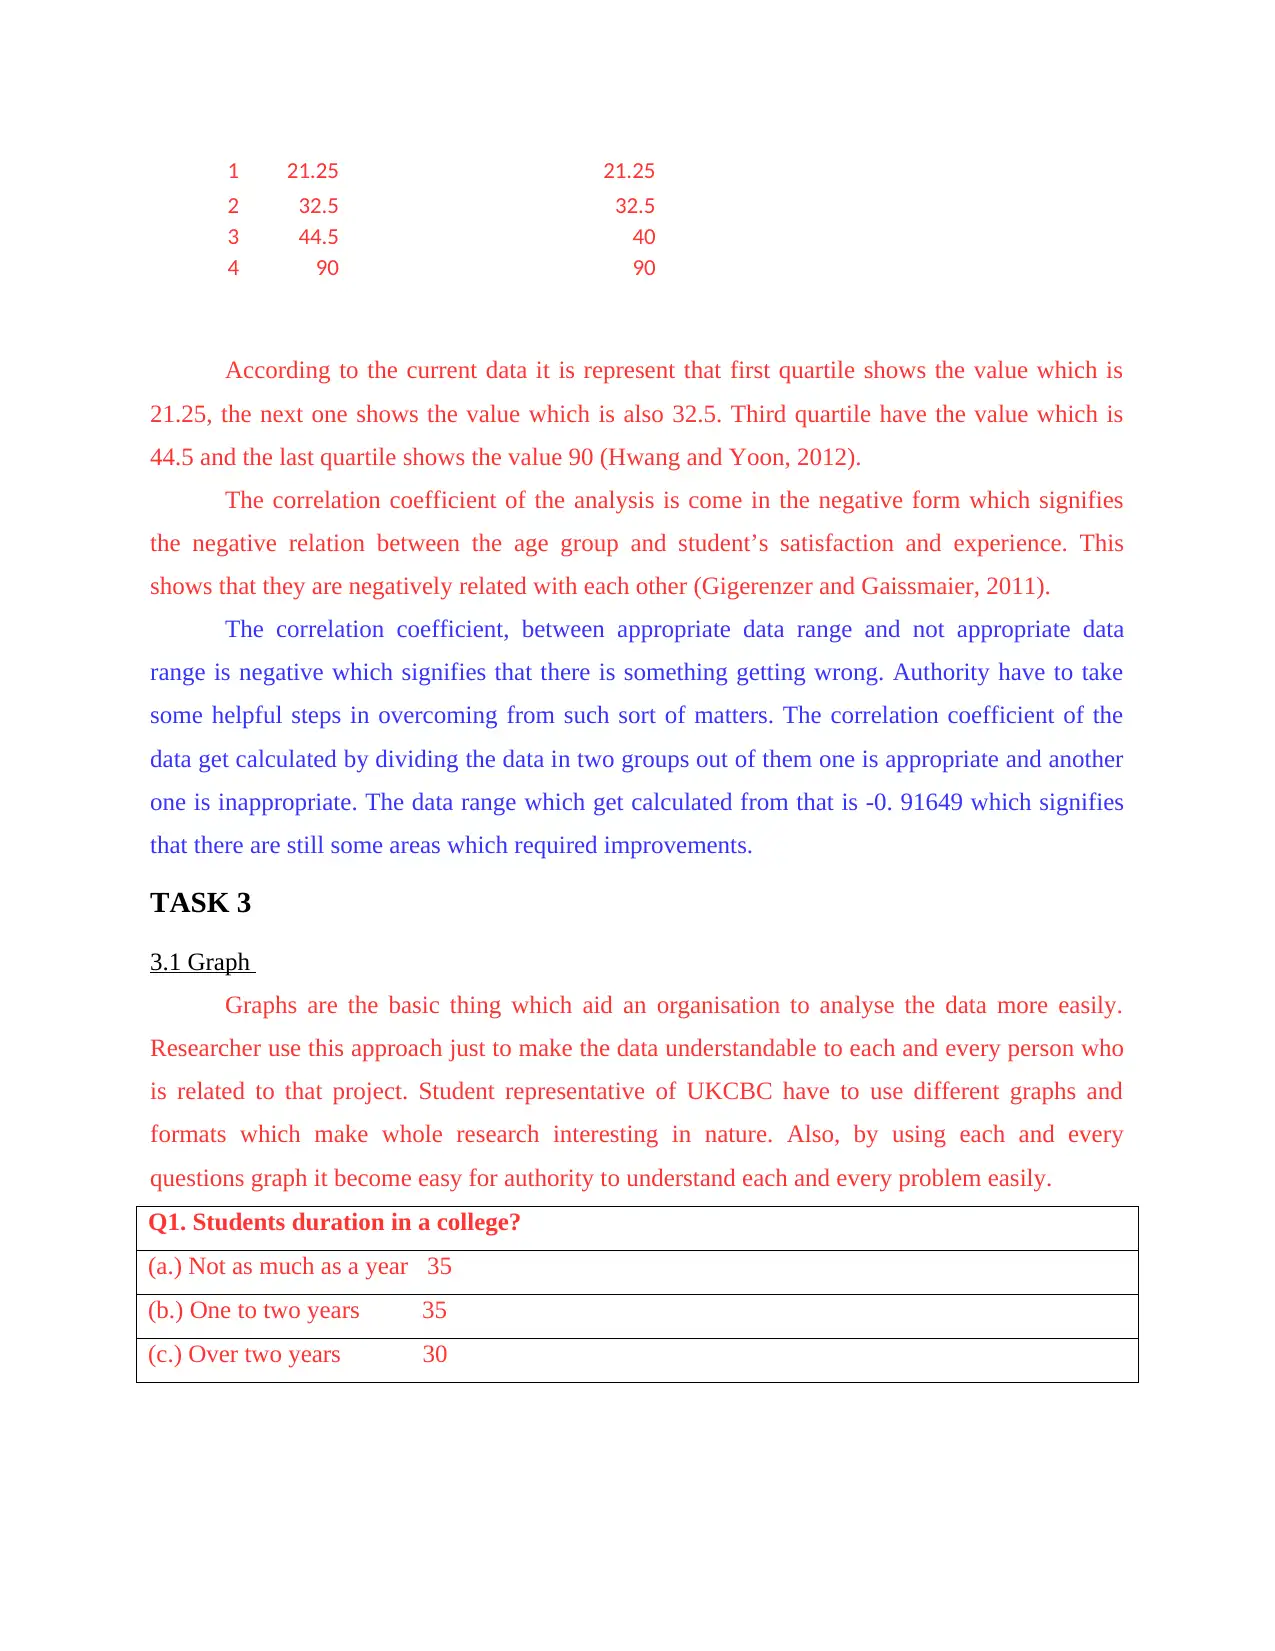
1 21.25 21.25
2 32.5 32.5
3 44.5 40
4 90 90
According to the current data it is represent that first quartile shows the value which is
21.25, the next one shows the value which is also 32.5. Third quartile have the value which is
44.5 and the last quartile shows the value 90 (Hwang and Yoon, 2012).
The correlation coefficient of the analysis is come in the negative form which signifies
the negative relation between the age group and student’s satisfaction and experience. This
shows that they are negatively related with each other (Gigerenzer and Gaissmaier, 2011).
The correlation coefficient, between appropriate data range and not appropriate data
range is negative which signifies that there is something getting wrong. Authority have to take
some helpful steps in overcoming from such sort of matters. The correlation coefficient of the
data get calculated by dividing the data in two groups out of them one is appropriate and another
one is inappropriate. The data range which get calculated from that is -0. 91649 which signifies
that there are still some areas which required improvements.
TASK 3
3.1 Graph
Graphs are the basic thing which aid an organisation to analyse the data more easily.
Researcher use this approach just to make the data understandable to each and every person who
is related to that project. Student representative of UKCBC have to use different graphs and
formats which make whole research interesting in nature. Also, by using each and every
questions graph it become easy for authority to understand each and every problem easily.
Q1. Students duration in a college?
(a.) Not as much as a year 35
(b.) One to two years 35
(c.) Over two years 30
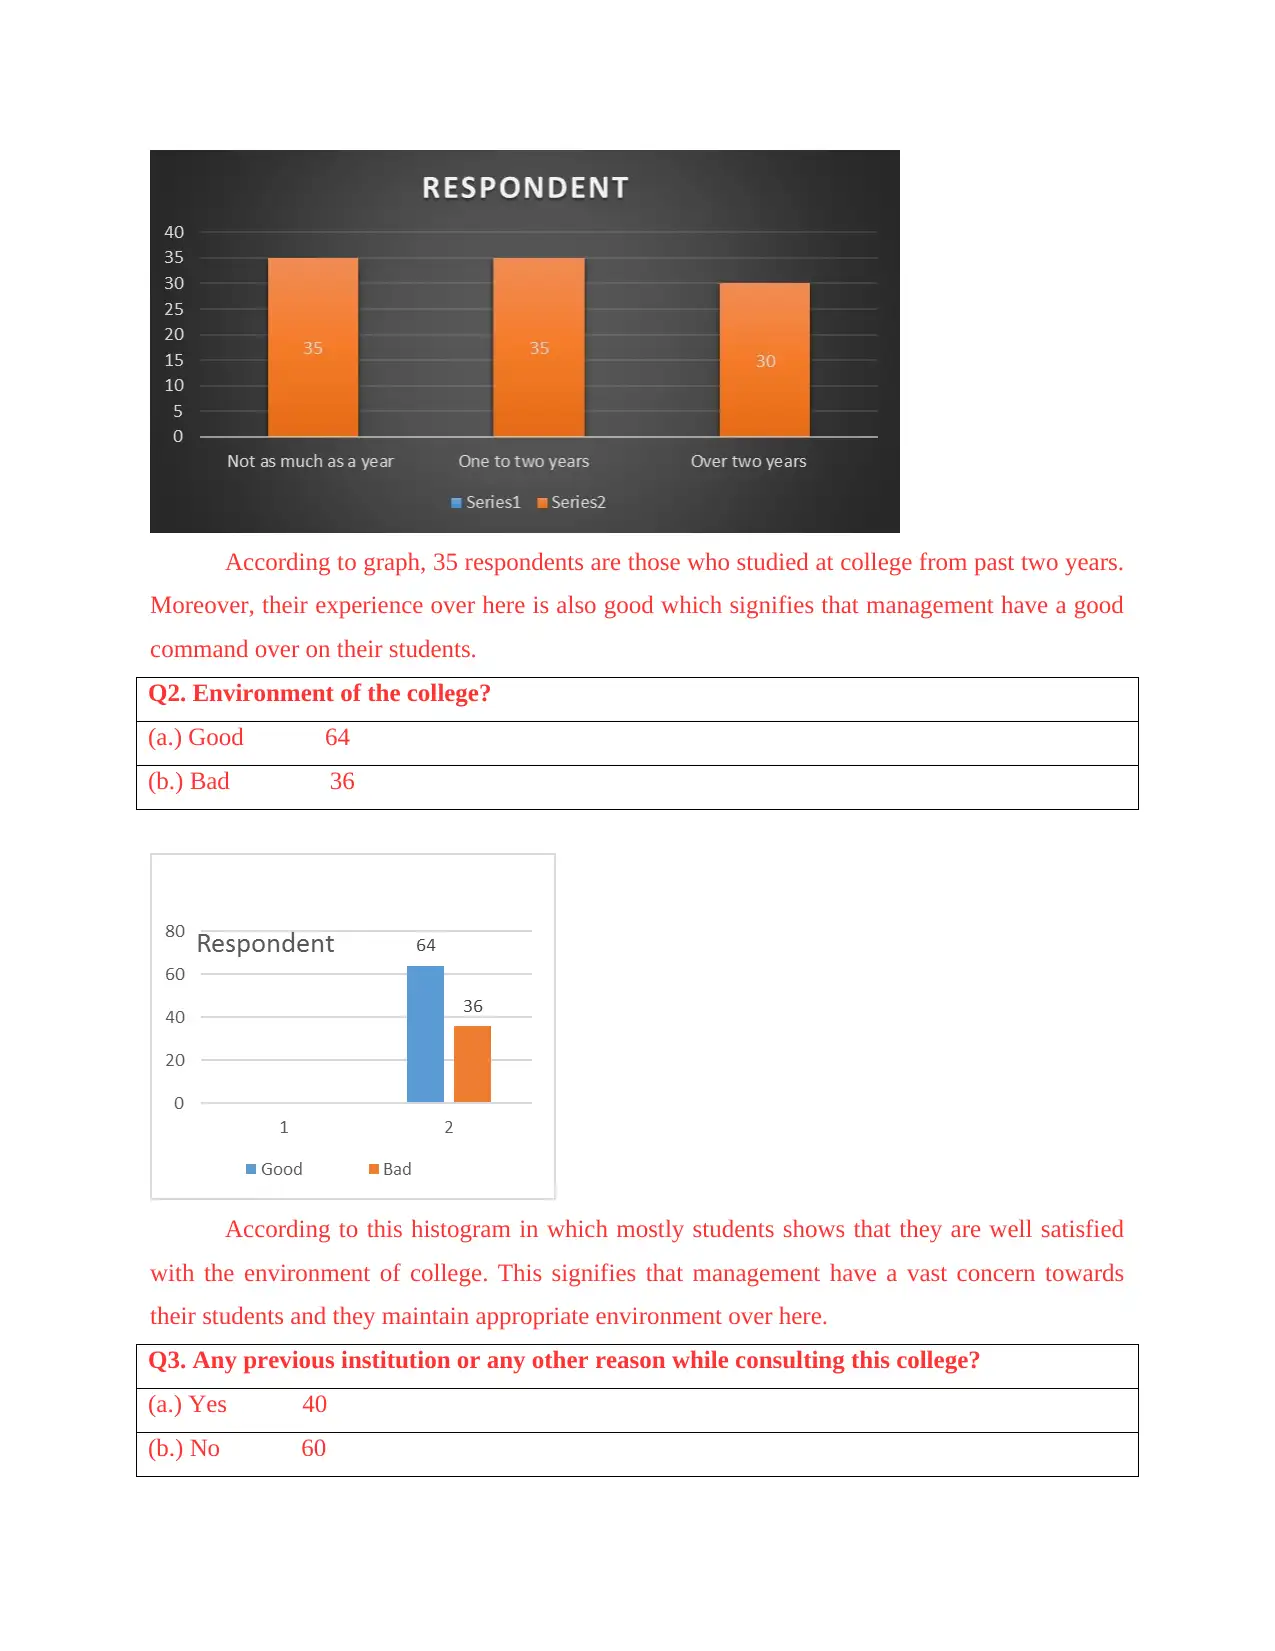
According to graph, 35 respondents are those who studied at college from past two years.
Moreover, their experience over here is also good which signifies that management have a good
command over on their students.
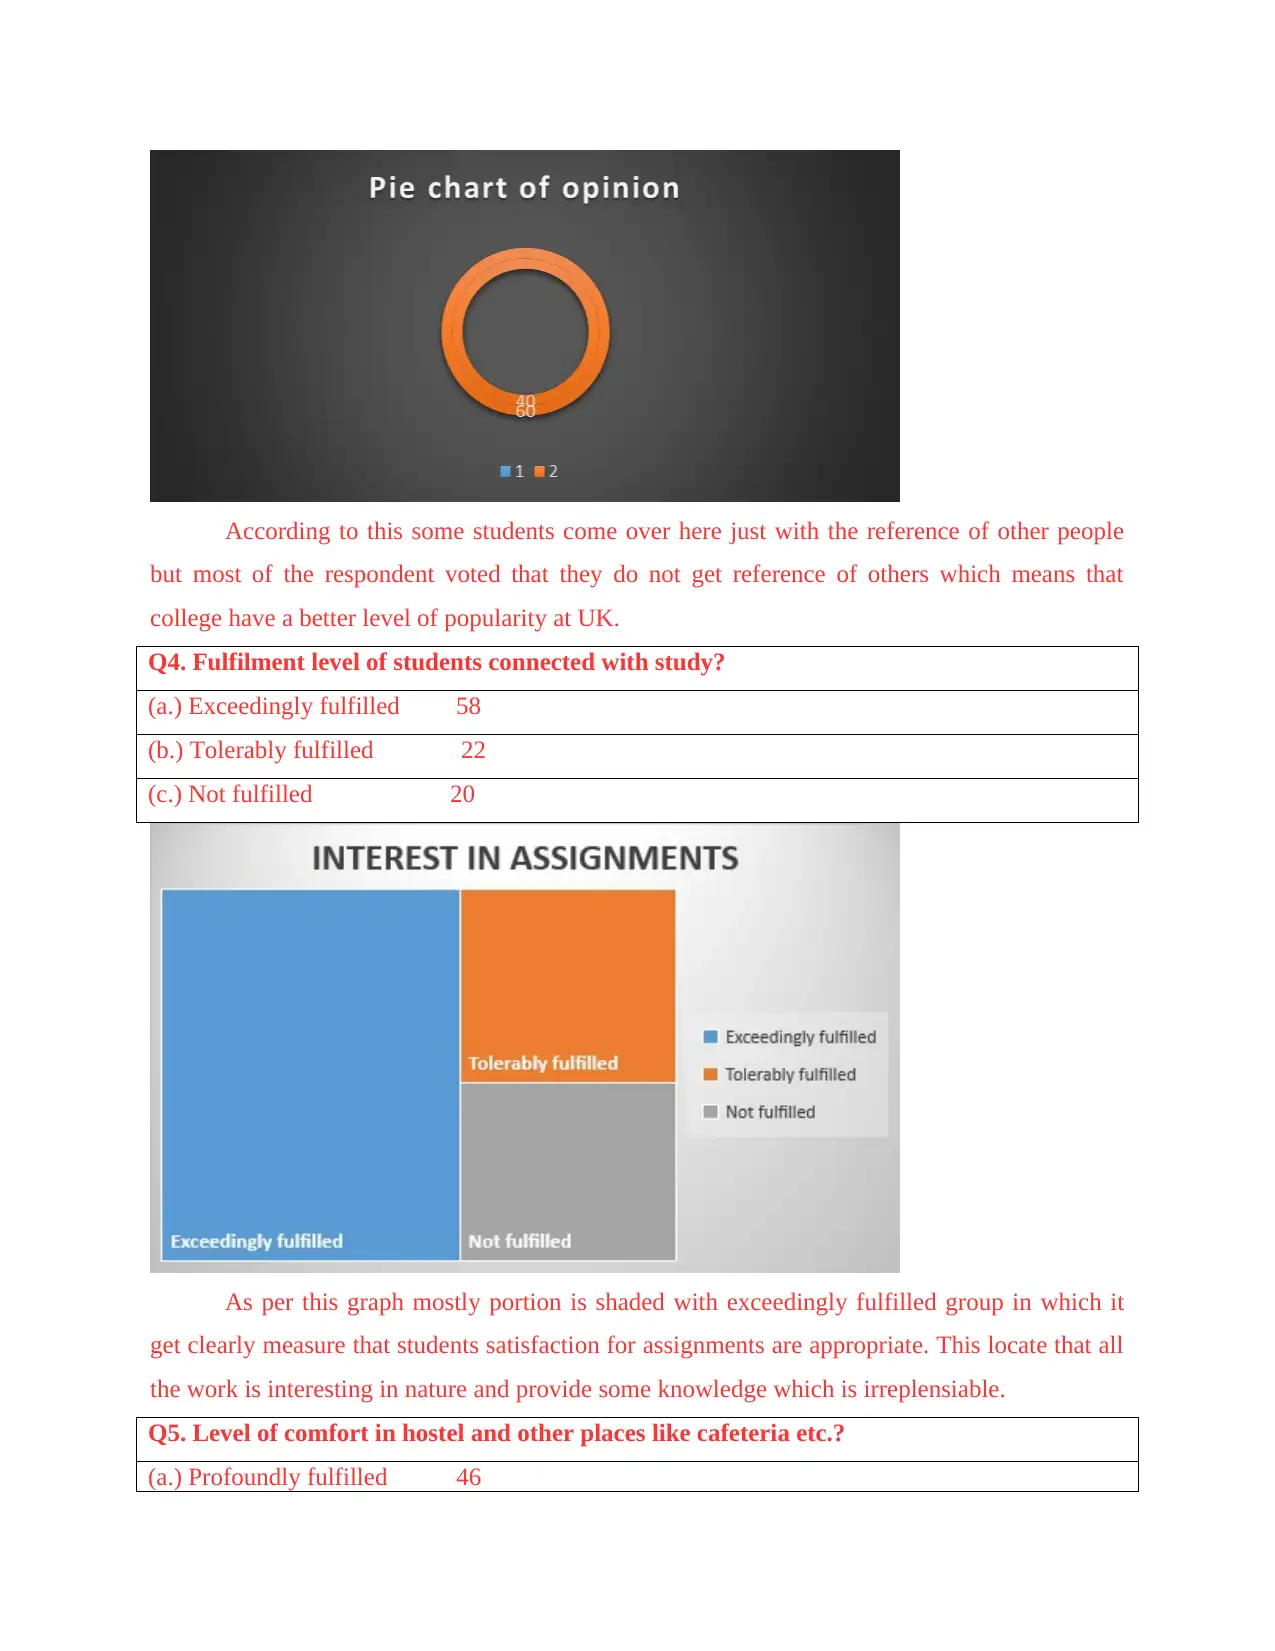
Q2. Environment of the college?
(a.) Good 64
(b.) Bad 36
According to this histogram in which mostly students shows that they are well satisfied
with the environment of college. This signifies that management have a vast concern towards
their students and they maintain appropriate environment over here.
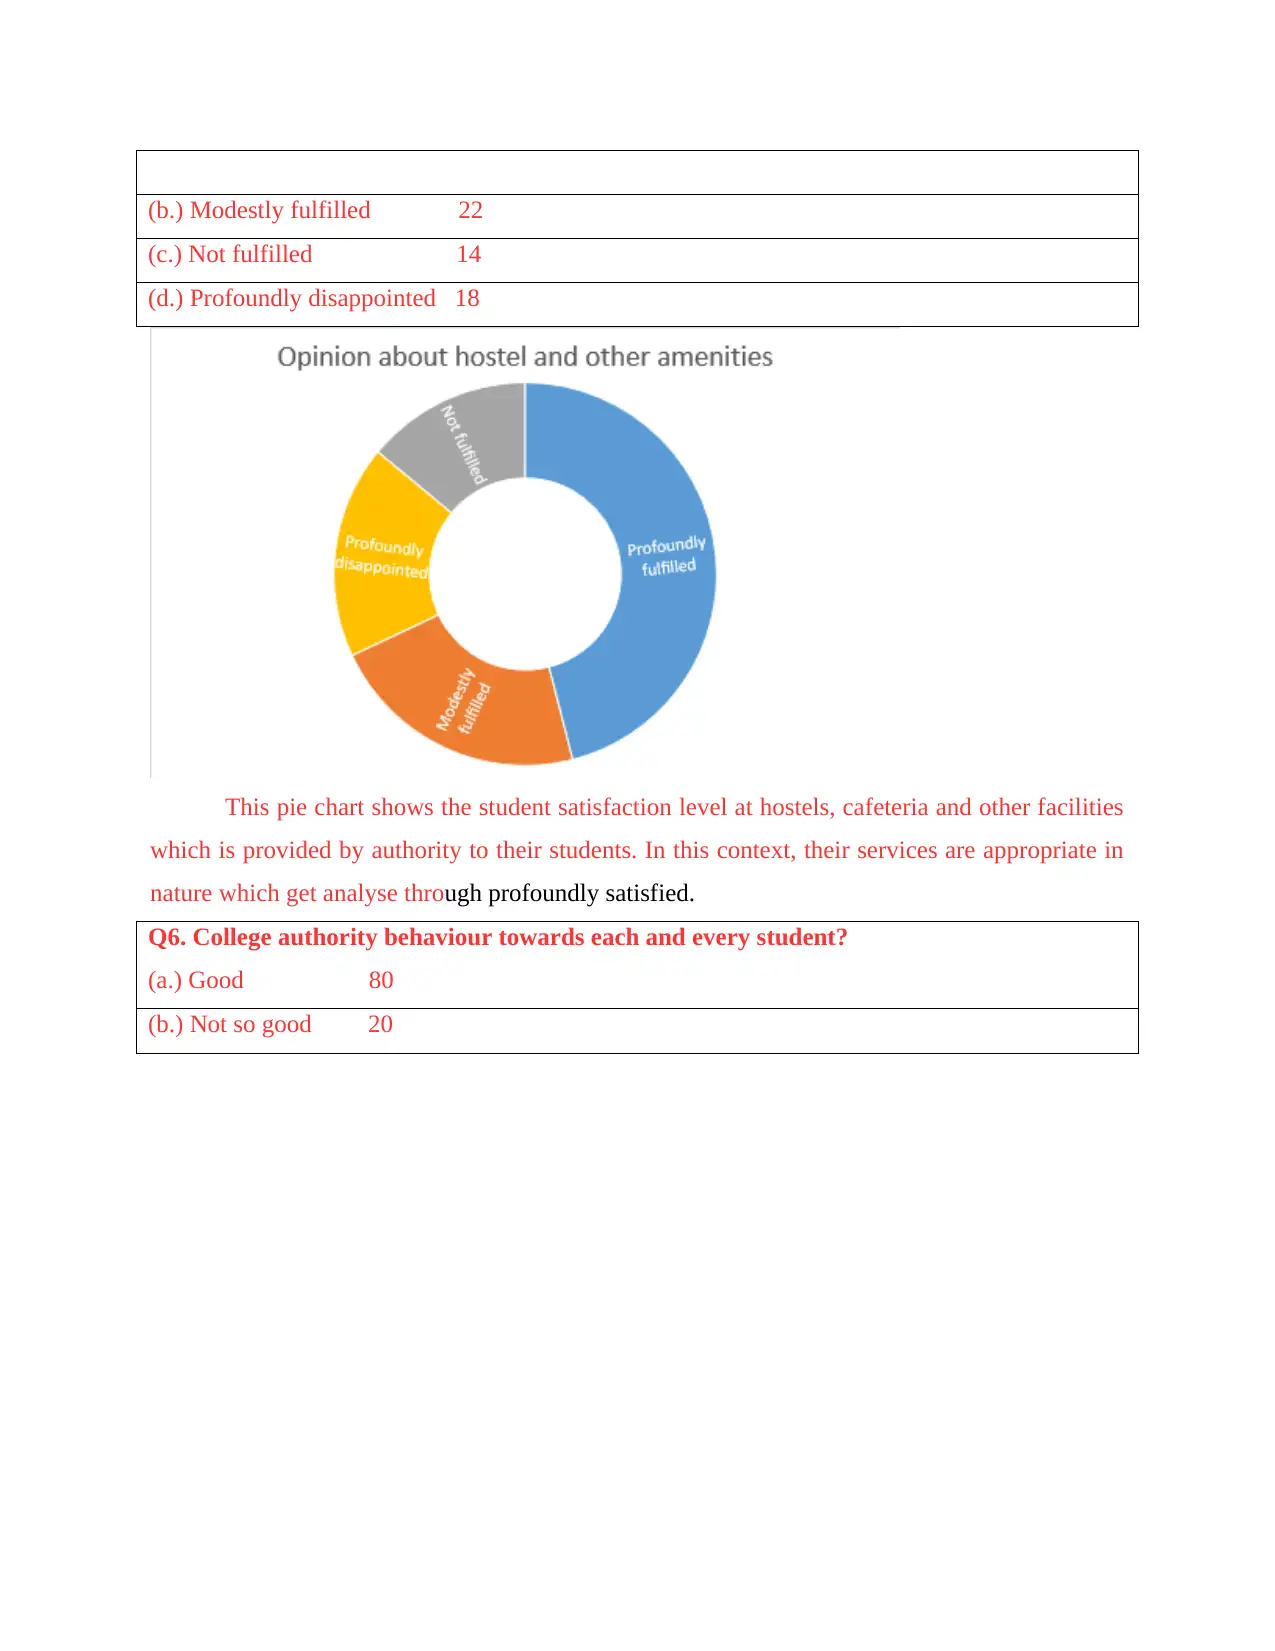
Q3. Any previous institution or any other reason while consulting this college?
(a.) Yes 40
(b.) No 60
Moreover, their experience over here is also good which signifies that management have a good
command over on their students.
Q2. Environment of the college?
(a.) Good 64
(b.) Bad 36
According to this histogram in which mostly students shows that they are well satisfied
with the environment of college. This signifies that management have a vast concern towards
their students and they maintain appropriate environment over here.
Q3. Any previous institution or any other reason while consulting this college?
(a.) Yes 40
(b.) No 60
Paraphrase This Document
Need a fresh take? Get an instant paraphrase of this document with our AI Paraphraser
According to this some students come over here just with the reference of other people
but most of the respondent voted that they do not get reference of others which means that
college have a better level of popularity at UK.
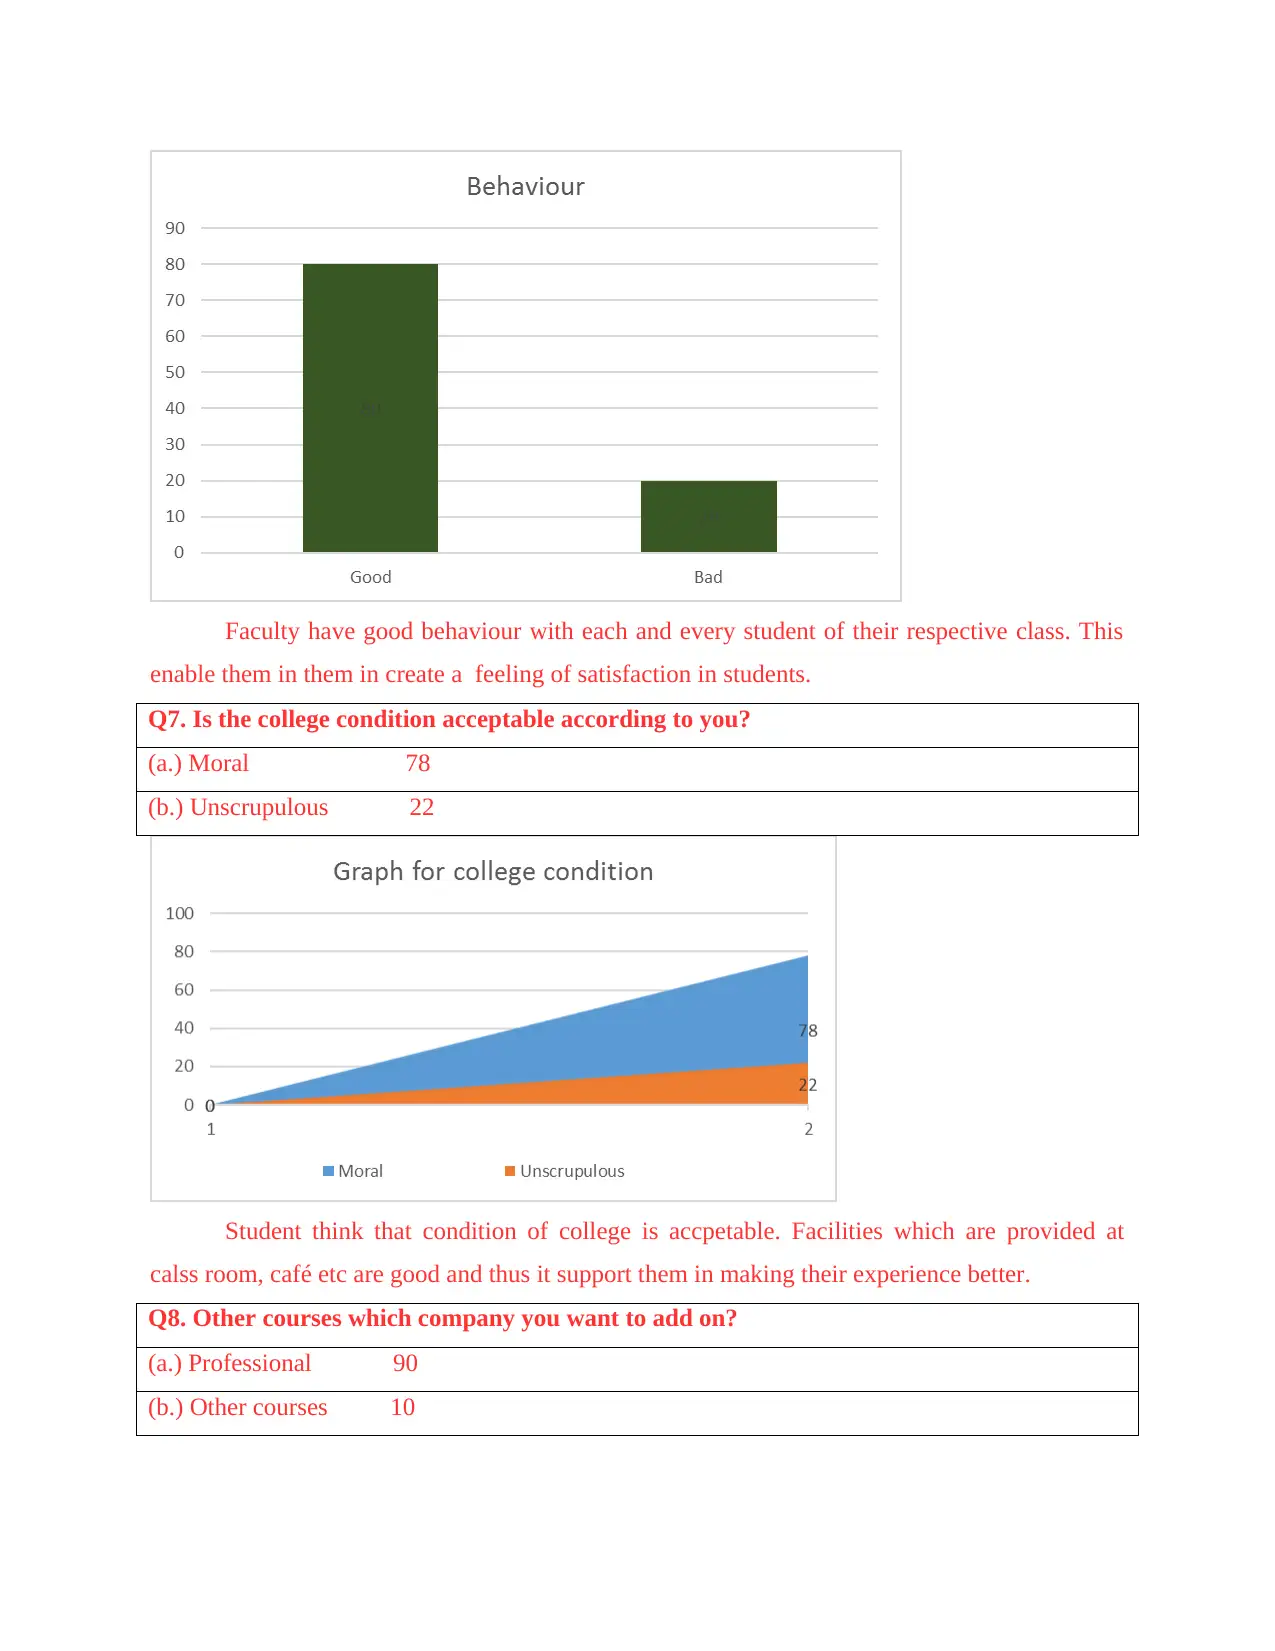
Q4. Fulfilment level of students connected with study?
(a.) Exceedingly fulfilled 58
(b.) Tolerably fulfilled 22
(c.) Not fulfilled 20
As per this graph mostly portion is shaded with exceedingly fulfilled group in which it
get clearly measure that students satisfaction for assignments are appropriate. This locate that all
the work is interesting in nature and provide some knowledge which is irreplensiable.
Q5. Level of comfort in hostel and other places like cafeteria etc.?
(a.) Profoundly fulfilled 46
but most of the respondent voted that they do not get reference of others which means that
college have a better level of popularity at UK.
Q4. Fulfilment level of students connected with study?
(a.) Exceedingly fulfilled 58
(b.) Tolerably fulfilled 22
(c.) Not fulfilled 20
As per this graph mostly portion is shaded with exceedingly fulfilled group in which it
get clearly measure that students satisfaction for assignments are appropriate. This locate that all
the work is interesting in nature and provide some knowledge which is irreplensiable.
Q5. Level of comfort in hostel and other places like cafeteria etc.?
(a.) Profoundly fulfilled 46
(b.) Modestly fulfilled 22
(c.) Not fulfilled 14
(d.) Profoundly disappointed 18
This pie chart shows the student satisfaction level at hostels, cafeteria and other facilities
which is provided by authority to their students. In this context, their services are appropriate in
nature which get analyse through profoundly satisfied.
Q6. College authority behaviour towards each and every student?
(a.) Good 80
(b.) Not so good 20
Faculty have good behaviour with each and every student of their respective class. This
enable them in them in create a feeling of satisfaction in students.
Q7. Is the college condition acceptable according to you?
(a.) Moral 78
(b.) Unscrupulous 22
Student think that condition of college is accpetable. Facilities which are provided at
calss room, café etc are good and thus it support them in making their experience better.
Q8. Other courses which company you want to add on?
(a.) Professional 90
(b.) Other courses 10
Secure Best Marks with AI Grader
Need help grading? Try our AI Grader for instant feedback on your assignments.
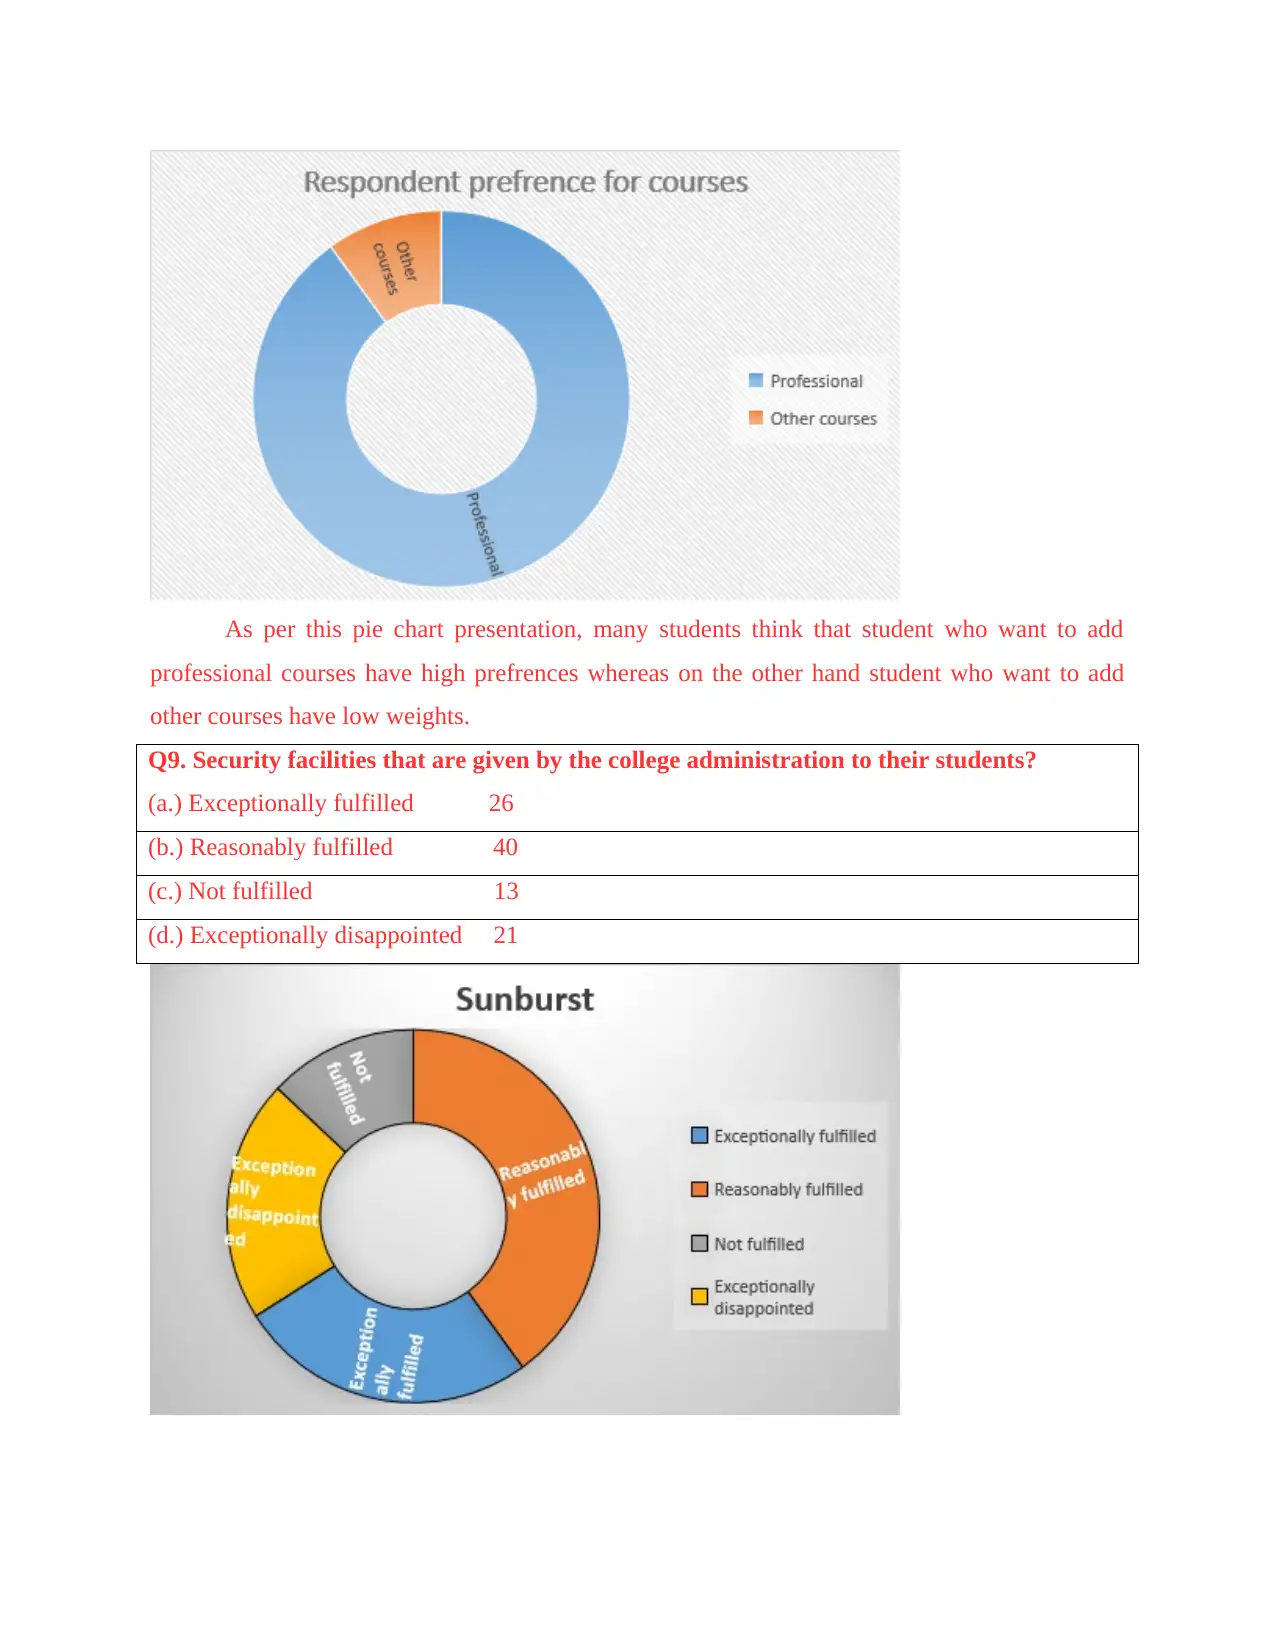
As per this pie chart presentation, many students think that student who want to add
professional courses have high prefrences whereas on the other hand student who want to add
other courses have low weights.
Q9. Security facilities that are given by the college administration to their students?
(a.) Exceptionally fulfilled 26
(b.) Reasonably fulfilled 40
(c.) Not fulfilled 13
(d.) Exceptionally disappointed 21
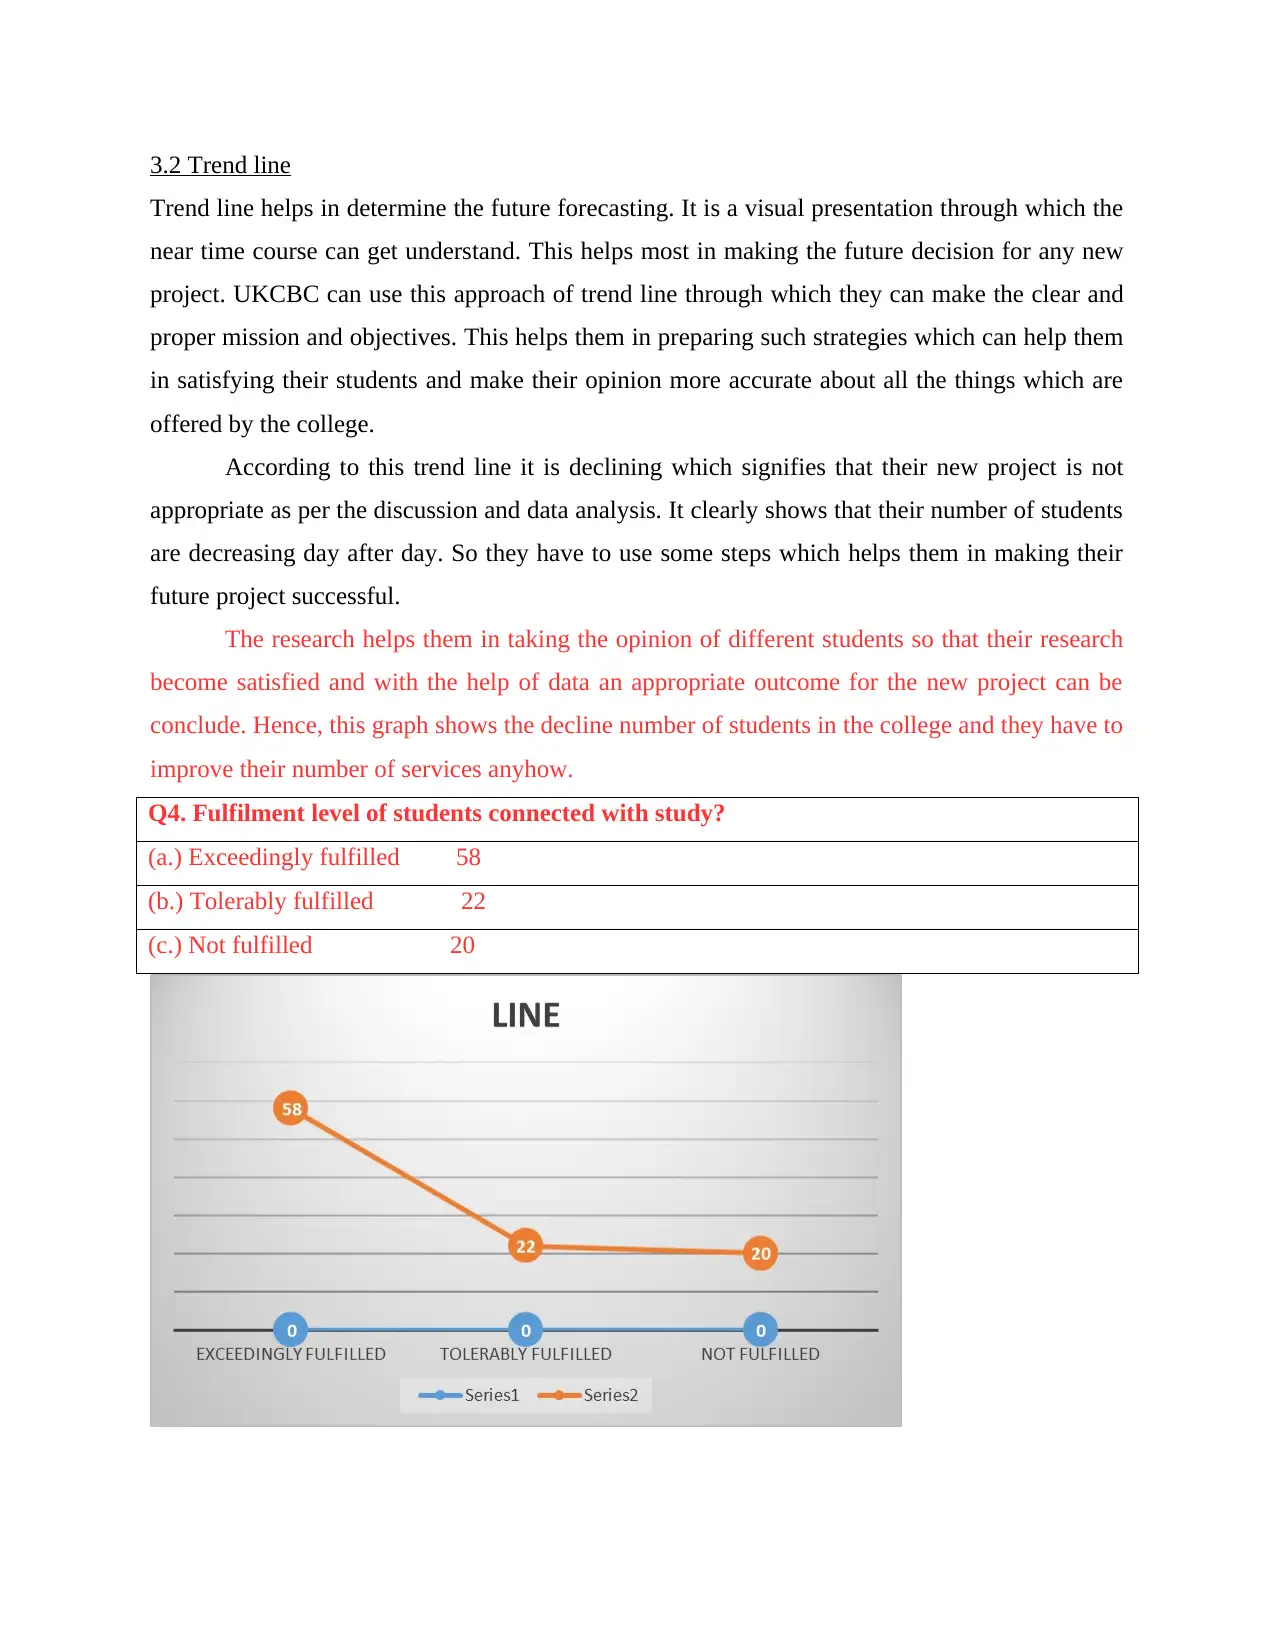
3.2 Trend line
Trend line helps in determine the future forecasting. It is a visual presentation through which the
near time course can get understand. This helps most in making the future decision for any new
project. UKCBC can use this approach of trend line through which they can make the clear and
proper mission and objectives. This helps them in preparing such strategies which can help them
in satisfying their students and make their opinion more accurate about all the things which are
offered by the college.
According to this trend line it is declining which signifies that their new project is not
appropriate as per the discussion and data analysis. It clearly shows that their number of students
are decreasing day after day. So they have to use some steps which helps them in making their
future project successful.
The research helps them in taking the opinion of different students so that their research
become satisfied and with the help of data an appropriate outcome for the new project can be
conclude. Hence, this graph shows the decline number of students in the college and they have to
improve their number of services anyhow.
Q4. Fulfilment level of students connected with study?
(a.) Exceedingly fulfilled 58
(b.) Tolerably fulfilled 22
(c.) Not fulfilled 20
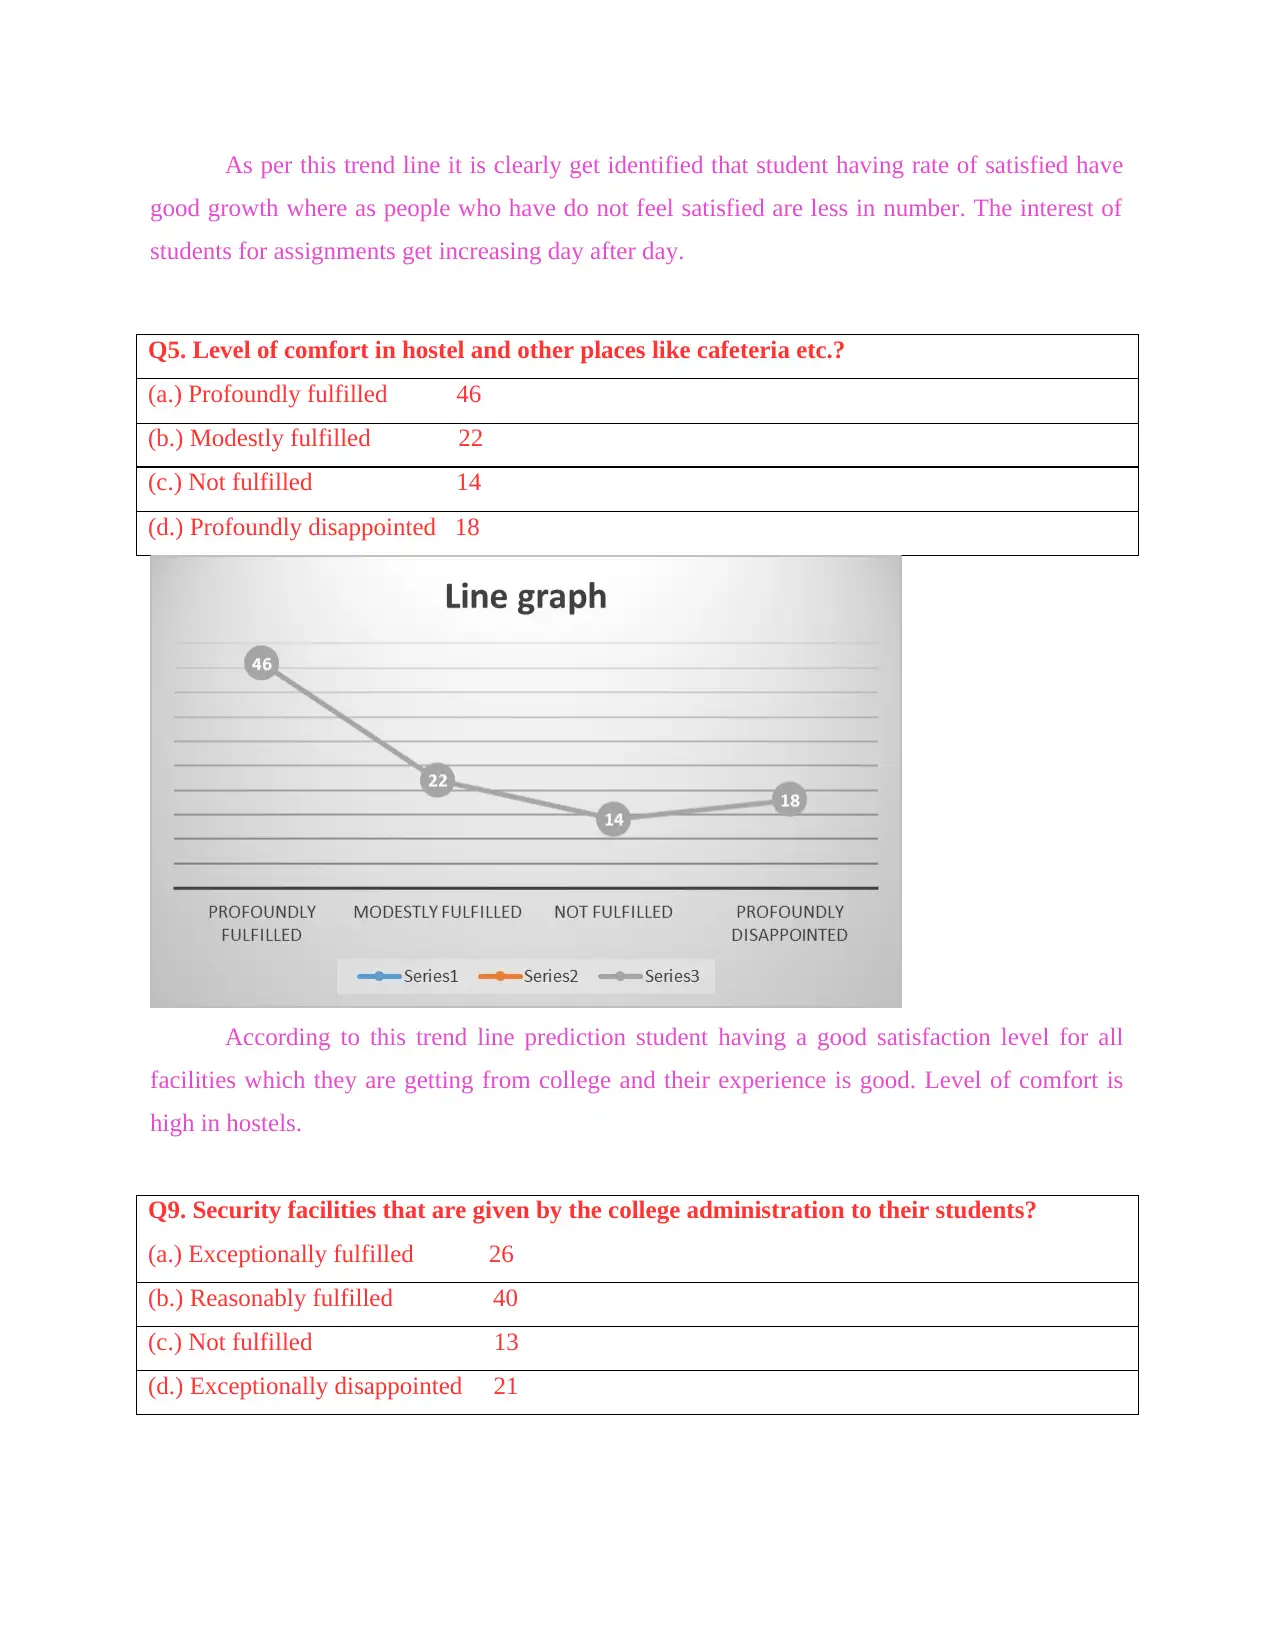
As per this trend line it is clearly get identified that student having rate of satisfied have
good growth where as people who have do not feel satisfied are less in number. The interest of
students for assignments get increasing day after day.
Q5. Level of comfort in hostel and other places like cafeteria etc.?
(a.) Profoundly fulfilled 46
(b.) Modestly fulfilled 22
(c.) Not fulfilled 14
(d.) Profoundly disappointed 18
According to this trend line prediction student having a good satisfaction level for all
facilities which they are getting from college and their experience is good. Level of comfort is
high in hostels.
Q9. Security facilities that are given by the college administration to their students?
(a.) Exceptionally fulfilled 26
(b.) Reasonably fulfilled 40
(c.) Not fulfilled 13
(d.) Exceptionally disappointed 21
Paraphrase This Document
Need a fresh take? Get an instant paraphrase of this document with our AI Paraphraser
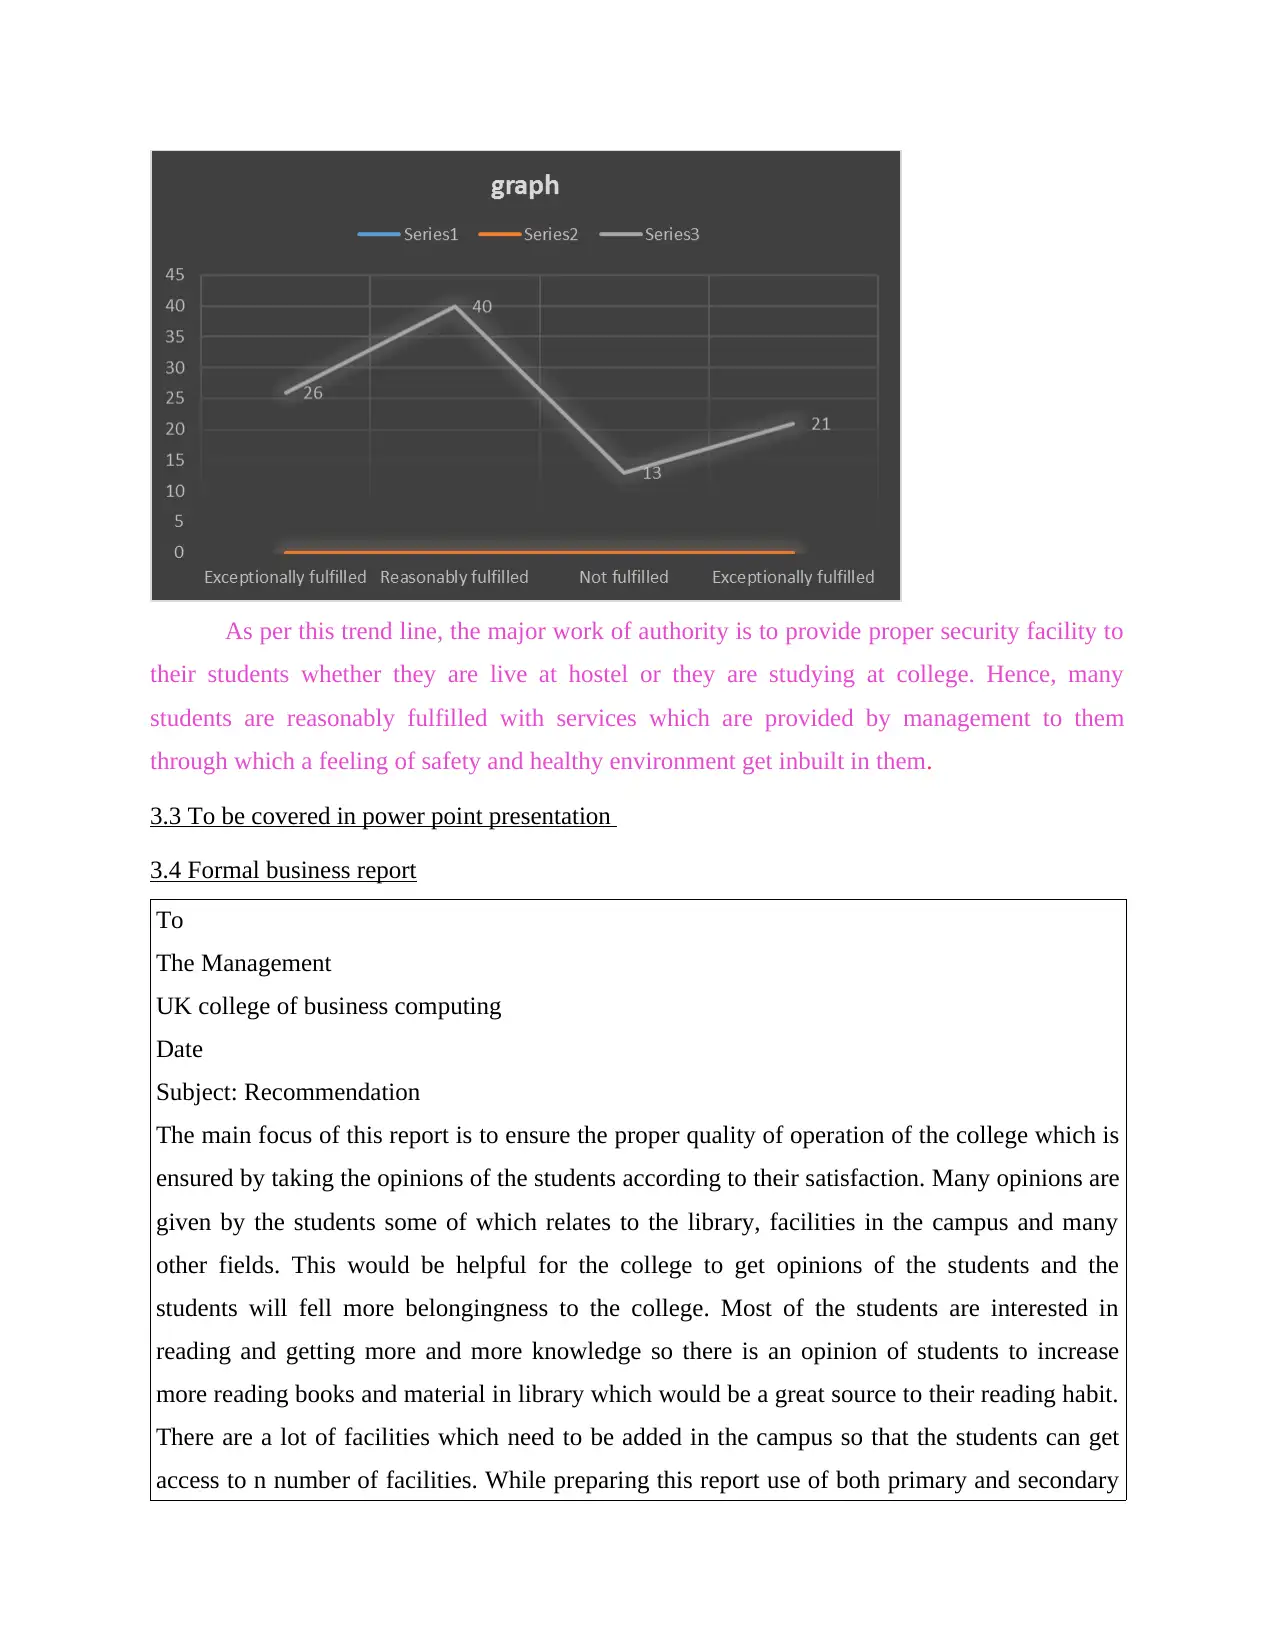
As per this trend line, the major work of authority is to provide proper security facility to
their students whether they are live at hostel or they are studying at college. Hence, many
students are reasonably fulfilled with services which are provided by management to them
through which a feeling of safety and healthy environment get inbuilt in them.
3.3 To be covered in power point presentation
3.4 Formal business report
To
The Management
UK college of business computing
Date
Subject: Recommendation
The main focus of this report is to ensure the proper quality of operation of the college which is
ensured by taking the opinions of the students according to their satisfaction. Many opinions are
given by the students some of which relates to the library, facilities in the campus and many
other fields. This would be helpful for the college to get opinions of the students and the
students will fell more belongingness to the college. Most of the students are interested in
reading and getting more and more knowledge so there is an opinion of students to increase
more reading books and material in library which would be a great source to their reading habit.
There are a lot of facilities which need to be added in the campus so that the students can get
access to n number of facilities. While preparing this report use of both primary and secondary
data is taken so as to ensure the proper findings of the results as various information is included
in the data. Student were least interested which was the major drawback of the research report.
Because most of the time the questionnaire was not taken seriously by the students and
sometimes they were nor present in the campus which voided the investigation. Talking about
the students who showed interest and did the work have done it properly. So, all the above
characteristics should be taken into consideration by the college so as to provide quality
assurance to the students in a really effective way so that it leads to more satisfaction among the
students. And this would help them to attract more and students. Some key areas which have to
get improvise are increase number of books in library, improve security services till all students
do not get satisfied from that. For this hire a suitable security staff for the same. Minor steps
have to take in consideration related to hostel facility in which management have to hire chefs
for preparing food.
TASK 4
4.1 Use of software in decision making
Updating is necessary no matter which field we work in. Today the technology plays a
key role in every business. Software are those essential and helpful application for the more
effective working of the business. So it can be used at every level of working(Milovic and
Milovic, 2012).
At Operational level the software can be used to maintain the day to day record of the work done
by the employees. The sales department can use software to maintain the record of the sales.
And any operational department can use it to maintain the proper record. This process get
done in UKCBC by prepare a attendance register for students. For example, Apple sales
department make their reports on the basis of such things through which they can record
their sales.
The tactical level can play a role of relation between the operational and strategical level so as to
tackle the records of both and interpreting the information by the records. This helps in
immediate action for anything which is not appropriately working so the software usage can
be very reliable and useful in this level (Muindi, 2011). This is a middle level management
of company which facilitate to pass all information accordingly. The only reason behind the
apple success is passing all information properly by their managers in which they take care
about operation level workers also. At UKCBC, this role get performed through their
teachers who enable them in passing their students view points to management.
Strategical level can use the software to make strategies by proper analysation through data. For
this context, Apple management have to prepare their strategies according to requirement of
time as well as stakeholders. If they failed in formulate such schemes which are beneficial to
all internal and external stakeholders then they can sustain at market for long term. Different
software can be used to do so. And it leads to the proper making of the strategies for the
company to work upon.
The software technology now is used to lessen the burden of recording manually and this is
helpful in accurate decision making and quick analysing if the data. And it is a way important for
any organisation working in today's environment to have a software based working environment
so as to compete in current environment where the world is growing and developing to the era of
technology (Nielsen and Nielsen, 2011).
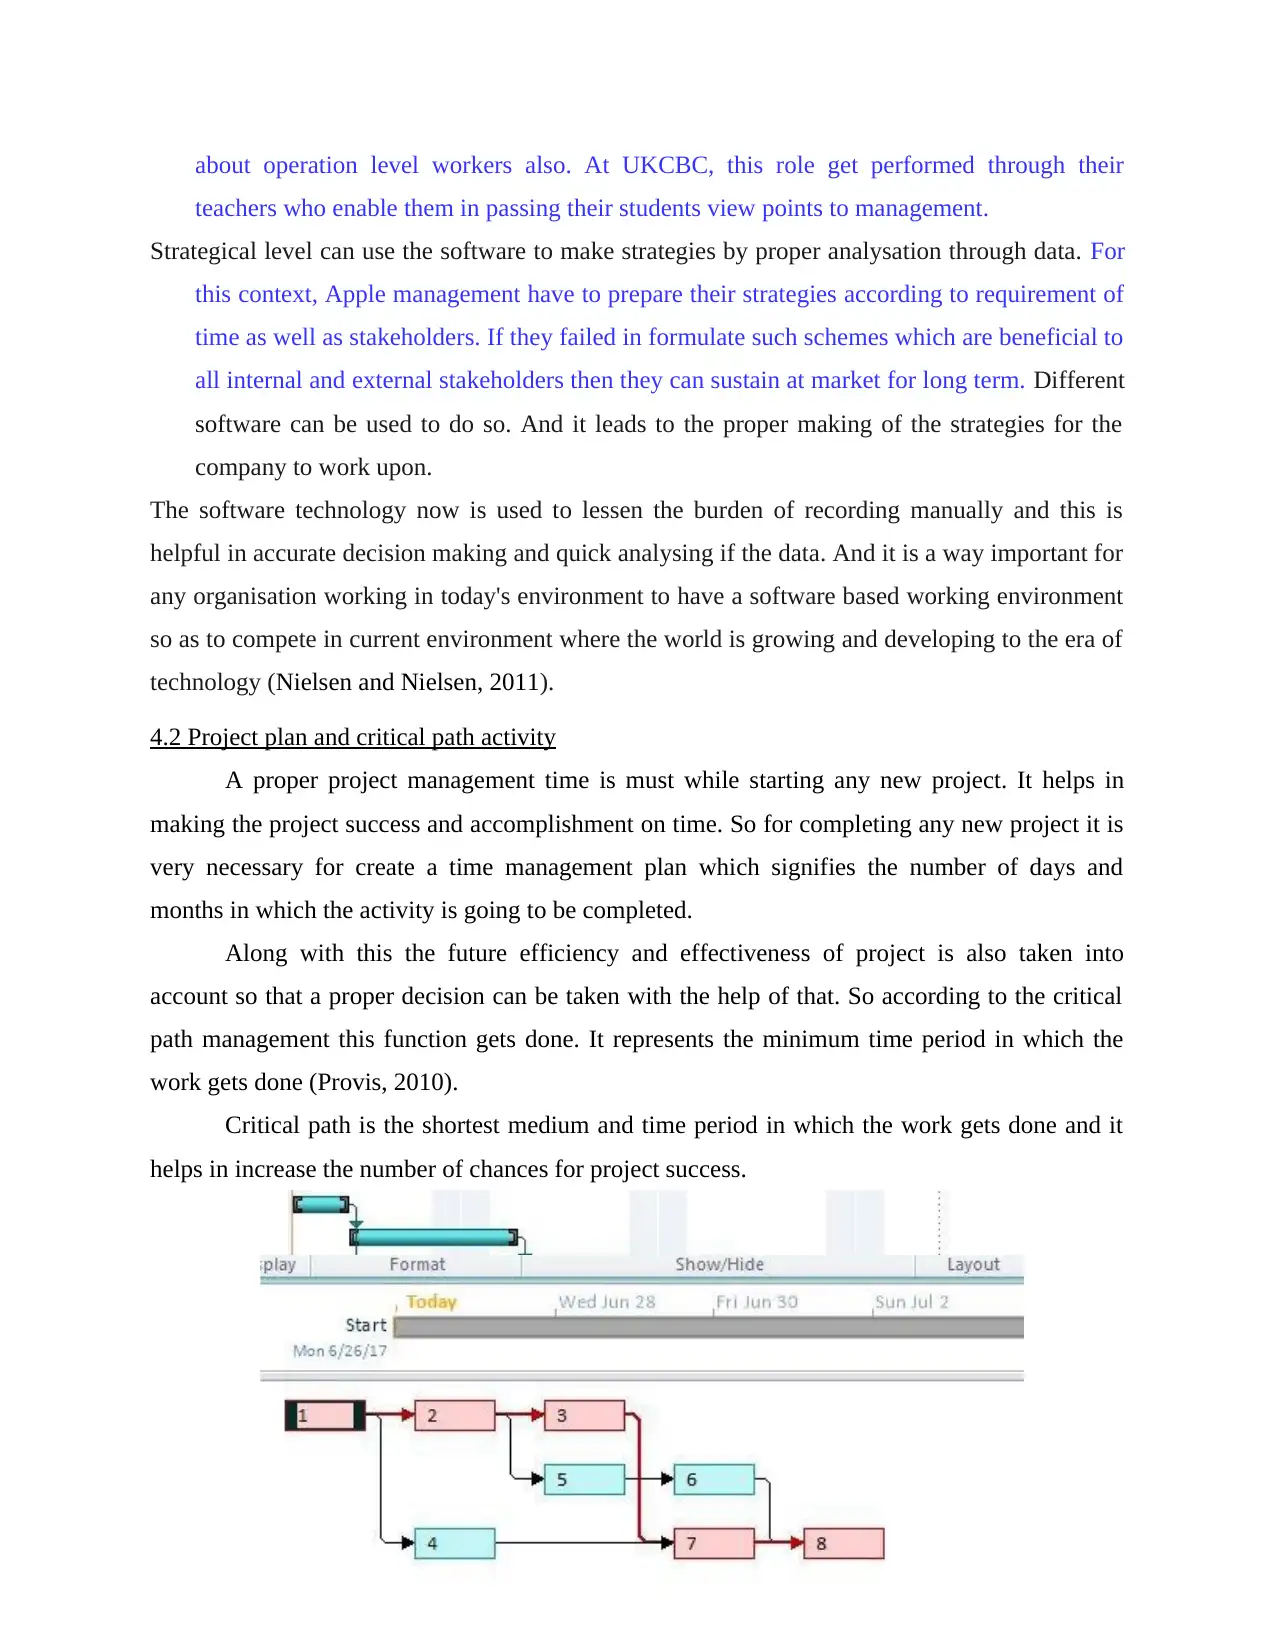
4.2 Project plan and critical path activity
A proper project management time is must while starting any new project. It helps in
making the project success and accomplishment on time. So for completing any new project it is
very necessary for create a time management plan which signifies the number of days and
months in which the activity is going to be completed.
Along with this the future efficiency and effectiveness of project is also taken into
account so that a proper decision can be taken with the help of that. So according to the critical
path management this function gets done. It represents the minimum time period in which the
work gets done (Provis, 2010).
Critical path is the shortest medium and time period in which the work gets done and it
helps in increase the number of chances for project success.
teachers who enable them in passing their students view points to management.
Strategical level can use the software to make strategies by proper analysation through data. For
this context, Apple management have to prepare their strategies according to requirement of
time as well as stakeholders. If they failed in formulate such schemes which are beneficial to
all internal and external stakeholders then they can sustain at market for long term. Different
software can be used to do so. And it leads to the proper making of the strategies for the
company to work upon.
The software technology now is used to lessen the burden of recording manually and this is
helpful in accurate decision making and quick analysing if the data. And it is a way important for
any organisation working in today's environment to have a software based working environment
so as to compete in current environment where the world is growing and developing to the era of
technology (Nielsen and Nielsen, 2011).
4.2 Project plan and critical path activity
A proper project management time is must while starting any new project. It helps in
making the project success and accomplishment on time. So for completing any new project it is
very necessary for create a time management plan which signifies the number of days and
months in which the activity is going to be completed.
Along with this the future efficiency and effectiveness of project is also taken into
account so that a proper decision can be taken with the help of that. So according to the critical
path management this function gets done. It represents the minimum time period in which the
work gets done (Provis, 2010).
Critical path is the shortest medium and time period in which the work gets done and it
helps in increase the number of chances for project success.
Secure Best Marks with AI Grader
Need help grading? Try our AI Grader for instant feedback on your assignments.
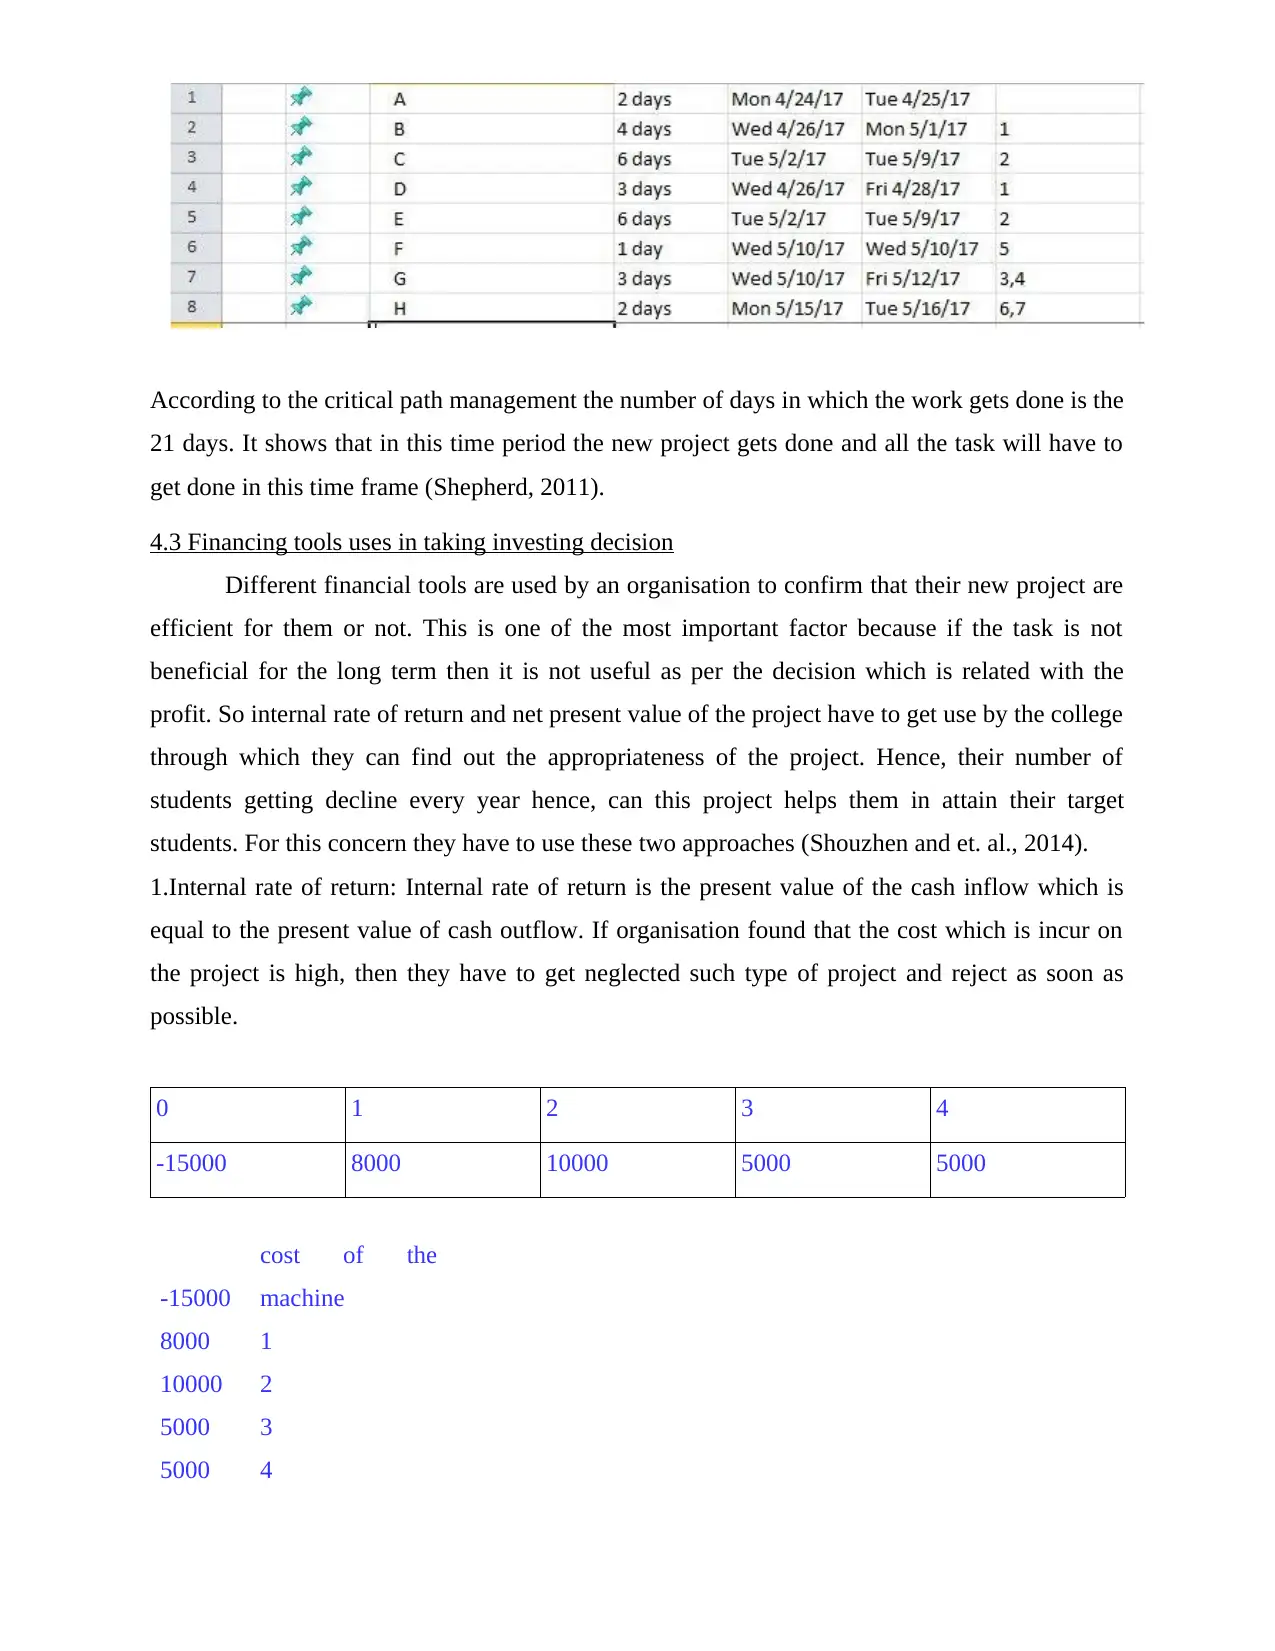
According to the critical path management the number of days in which the work gets done is the
21 days. It shows that in this time period the new project gets done and all the task will have to
get done in this time frame (Shepherd, 2011).
4.3 Financing tools uses in taking investing decision
Different financial tools are used by an organisation to confirm that their new project are
efficient for them or not. This is one of the most important factor because if the task is not
beneficial for the long term then it is not useful as per the decision which is related with the
profit. So internal rate of return and net present value of the project have to get use by the college
through which they can find out the appropriateness of the project. Hence, their number of
students getting decline every year hence, can this project helps them in attain their target
students. For this concern they have to use these two approaches (Shouzhen and et. al., 2014).
1.Internal rate of return: Internal rate of return is the present value of the cash inflow which is
equal to the present value of cash outflow. If organisation found that the cost which is incur on
the project is high, then they have to get neglected such type of project and reject as soon as
possible.
0 1 2 3 4
-15000 8000 10000 5000 5000
-15000
cost of the
machine
8000 1
10000 2
5000 3
5000 4
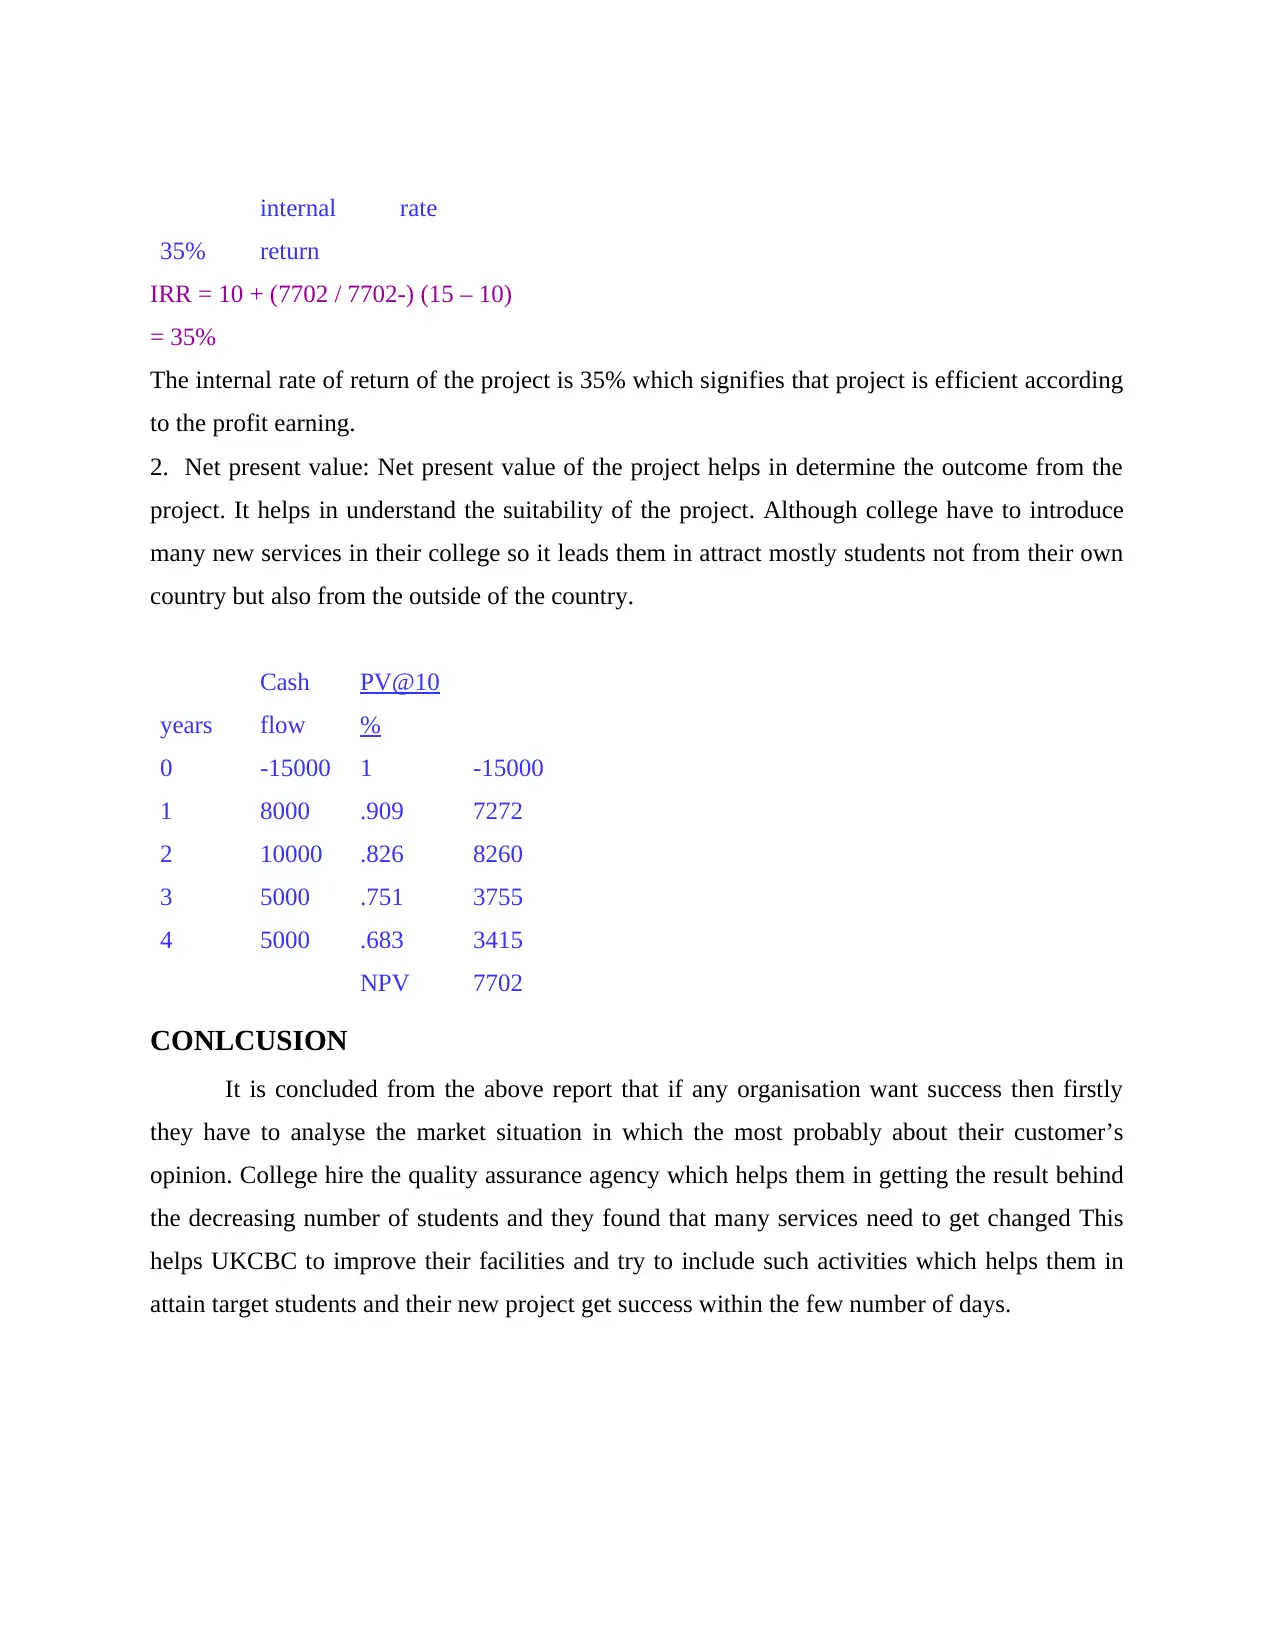
35%
internal rate
return
IRR = 10 + (7702 / 7702-) (15 – 10)
= 35%
The internal rate of return of the project is 35% which signifies that project is efficient according
to the profit earning.
2. Net present value: Net present value of the project helps in determine the outcome from the
project. It helps in understand the suitability of the project. Although college have to introduce
many new services in their college so it leads them in attract mostly students not from their own
country but also from the outside of the country.
years
Cash
flow
PV@10
%
0 -15000 1 -15000
1 8000 .909 7272
2 10000 .826 8260
3 5000 .751 3755
4 5000 .683 3415
NPV 7702
CONLCUSION
It is concluded from the above report that if any organisation want success then firstly
they have to analyse the market situation in which the most probably about their customer’s
opinion. College hire the quality assurance agency which helps them in getting the result behind
the decreasing number of students and they found that many services need to get changed This
helps UKCBC to improve their facilities and try to include such activities which helps them in
attain target students and their new project get success within the few number of days.
REFERENCES
Books and Journals
Barry, M.J. and Edgman-Levitan, S., 2012. Shared decision making—the pinnacle of patient-
centered care. New England Journal of Medicine. 366(9). pp.780-781.
Brynjolfsson, E., Hitt, L. M. and Kim, H. H., 2011. Strength in numbers: How does data-driven
decisionmaking affect firm performance?.
Craft, J. L., 2013. A review of the empirical ethical decision-making literature: 2004–2011.
Journal of Business Ethics. 117(2). pp.221-259.
Cronan, T.P and et. al., 2011. Decision making in an integrated business process context:
Learning using an ERP simulation game. Decision Sciences Journal of Innovative
Education. 9(2). pp.227-234.
Fassin, Y. and Buelens, M., 2011. The hypocrisy-sincerity continuum in corporate
communication and decision making: A model of corporate social responsibility and
business ethics practices. Management Decision. 49(4). pp.586-600.
Fernando, M. and Chowdhury, R. M., 2010. The relationship between spiritual well-being and
ethical orientations in decision making: An empirical study with business executives in
Australia. Journal of Business Ethics. 95(2). pp.211-225.
Ford, R.C. and Richardson, W.D., 2013. Ethical decision making: A review of the empirical
literature. In Citation classics from the Journal of Business Ethics. pp. 19-44. Springer
Netherlands.
Frey, D., Schulz-Hardt, S. and Stahlberg, D., 2013. Information seeking among individuals and
groups and possible consequences for decision-making in business and politics.
Understanding group behavior. 2. pp.211-225.
Frey, D., Schulz-Hardt, S. and Stahlberg, D., 2013. Information seeking among individuals and
groups and possible consequences for decision-making in business and politics.
Understanding group behavior. 2. pp.211-225.
Gabrielsson, P. and Gabrielsson, M., 2013. A dynamic model of growth phases and survival in
international business-to-business new ventures: the moderating effect of decision-
making logic. Industrial Marketing Management. 42(8). pp.1357-1373.
García-Peñalvo, F. J. and Conde, M. Á., 2014. Using informal learning for business decision
making and knowledge management. Journal of Business Research. 67(5). pp.686-691.
Gigerenzer, G. and Gaissmaier, W., 2011. Heuristic decision making. Annual review of
psychology. 62. pp.451-482.
Hwang, C.L. and Yoon, K., 2012. Multiple attribute decision making: methods and applications a
state-of-the-art survey (Vol. 186). Springer Science & Business Media.
Isik, Ö., Jones, M.C. and Sidorova, A., 2013. Business intelligence success: The roles of BI
capabilities and decision environments. Information & Management. 50(1). pp.13-23.
Maxwell, A. L., Jeffrey, S. A. and Lévesque, M., 2011. Business angel early stage decision
making. Journal of Business Venturing. 26(2). pp.212-225.
Milovic, B. and Milovic, M., 2012. Prediction and decision making in health care using data
mining. Kuwait Chapter of the Arabian Journal of Business and Management Review.
1(12). p.126.
Muindi, F. K., 2011. The relationship between participation in decision making and job
satisfaction among academic staff in the school of business, university of Nairobi.
1 out of 25
Related Documents


Your All-in-One AI-Powered Toolkit for Academic Success.
+13062052269
info@desklib.com
Available 24*7 on WhatsApp / Email
![[object Object]](/_next/static/media/star-bottom.7253800d.svg)
Unlock your academic potential
© 2024 | Zucol Services PVT LTD | All rights reserved.