Statistics for Management: Data Types, Analysis and Business Use
VerifiedAdded on 2023/01/17
|19
|4359
|79
Report
AI Summary
This report provides a comprehensive overview of statistics for management, exploring various aspects such as data types, sources, and the differences between sample and population. It delves into the importance of statistical methods in achieving business objectives and gaining a competitive advantage, differentiating between inferential and descriptive statistics and their implications for business intelligence. The report includes examples of data analysis, graphical analysis, and statistical methods used by organizations. It also covers the practical application of statistical techniques, offering insights into how businesses can leverage data to make informed decisions and improve performance. Furthermore, the report examines both internal and external data sources, and discusses the significance of statistical analysis in understanding and predicting market trends, employee performance, and other critical business factors.
UNIT 31: STATISTICS FOR
MANAGEMENT
MANAGEMENT
Paraphrase This Document
Need a fresh take? Get an instant paraphrase of this document with our AI Paraphraser
TABLE OF CONTENTS
INTRODUCTION...........................................................................................................................1
PART 1............................................................................................................................................1
Types and sources of data and information that could be accessed by business........................3
Difference between sample and a population..............................................................................4
Value of employing statistical methods for meeting the business objectives and to achieve the
competitive advantage.................................................................................................................5
Difference between inferential and descriptive statistics and implications for business
intelligence...................................................................................................................................6
Example of analysis of given sample data sets used by organisation..........................................7
PART 2............................................................................................................................................8
Differences between the inferential and descriptive data on business ........................................8
Descriptive and inferential statistical data analysis.....................................................................9
Graphical analysis of data..........................................................................................................14
CONCLUSION .............................................................................................................................14
REFERENCES.............................................................................................................................16
INTRODUCTION
Statistics are the set of mathematical equations for analysing things. Statistics have
importance as today everyone is living in informative world and the informations are determined
with the help of statistics. Statistics allows in making smarter decisions for by the management
for the business. Statistical analysis provides with more accurate information to the management
on which they could rely. The statistical analysis provides company with data that will help in
avoiding future problems. In this report meaning and characteristics of statistics are explained. It
will give sources and types of business information that could be accessed (Adeniji, 2016).
Difference between sample and population and importance of employing statistical methods for
achieving the business objectives. The report will provide different methods for calculating
descriptive and inferential statistics.
PART 1
Introduction to statistics
Statistics refers to mathematical science that includes methods for collecting, organizing
& analysing information data in manner that provides for meaningful conclusions. Some people
consider statistics as separate mathematical science and not branch of mathematics. Statistics
have concern regarding the use of information in uncertainty context and decision making
process. When applying statistics to problem, practice starts with population or the process to be
studied. Descriptive statistics are used for summarizing the data of population. When census are
not feasible subset of population is studied called sample. When sample representing population
is determined, collection of data for the determined sample in experimental and observational
setting.
Characteristics of Statistics
Statistics are the aggregate of fact
Only facts that have the capability of being studied in connection with place, time
frequency could only be called as statistics. Single, individual or the unconnected figures could
not be termed as statistics as in relation with each other they could not be studied. Because of the
reasons, only collection of facts like student groups, data for IQ of students and like are statistics
and could be studied in each other's relation (Akbari and et.al., 2016).
Statistics are affected to mark extent through multiplicity of causes.
1
⊘ This is a preview!⊘
Do you want full access?
Subscribe today to unlock all pages.
Trusted by 1+ million students worldwide
Data of statistics is much more associated with social sciences and changes are being
affected because of combined effects of various sectors. It is not possible to study effects of
specific causes over a phenomenon. It is possible to trace the individual causes and their impact
could also be known physical sciences (Ames and et.al., 2016). In statistical studies of social
sciences combined effects of multiple causes could be known.
Numerical Expression of Statistics
Qualitative data that could not be expressed numerically, cannot be termed as statistics
like goodness, honesty, ability, etc.,If numerical expressions could be assigned to them they
could be termed as statistics.
Statistics are estimated or enumerate as per reasonable accuracy standards.
Accuracy and estimation standards vary from purposes to purposes or from enquiries to
enquiries. On uniform standard could not be there for all kinds of enquiries and all purposes.
While calculating 100 student's IQ single student could not be ignored in a group while
calculating IQ of all the soldiers of country 10 soldiers could be ignored.
Systematic collection of data
For having reasonable level of accuracy, it is essential that data of the statistics is
collected in systematic manner. Haphazard and rough methods of data collection are not
desirable that could lead to wrong and improper conclusions (Bowden and et.al., 2016).
Different methods of data analysis
There are 4 types of the data analysis :
Descriptive Analysis
Diagnostic Analysis
Predictive Analysis
Prescriptive Analysis
Descriptive Analysis – It is incurred at foundation of the data insights it answers what had
happened through summarizing previous data in form of dashboard. The are mainly used for
tracking KPI's.
Diagnostic Analysis - It takes insights from descriptive analysis and drill down for finding the
reason of outcome. It involves creating detailed informations.
2
Paraphrase This Document
Need a fresh take? Get an instant paraphrase of this document with our AI Paraphraser
Predictive Analysis – It uses previous data for making predictions for future outcomes. The
analysis relies over statistical modelling requiring manpower and technology for making
forecasts.
Prescriptive Analysis - It is referred as data analysis frontier, combining insights from the
previous analysis for determining course of actions to be taken for current decision or problem
(Ciuonzo, De Maio and Orlando, 2016).
Types and sources of data and information that could be accessed by business.
A business have several data related to the organisations. The main types of data that could be
accessed by business organisation.
Transactional Data
The data describes core activities of business. It includes sale and purchase data,
production data and even activities related to firing and hiring of employees in organisation.
Compared wit other data types it has big volume of data and is maintained and stored over in
operational applications.
Master Data
Data includes key informations making up transactional data. For instance data related to
trips ion cab company containing passengers, drivers, fare data and routes. Passengers, locations,
basic fare and drivers are master data. They are application specific and also therefore the use are
specific.
Reference Data
Master data's subset is reference data. It is generally standardized data which are
governed by specific codifications. Reference data is less volatile as compared with master data.
Reporting data
It is an aggregate of data compiled for purpose of reporting and analytics. The data is
combination of reference, master and transactional data (Cornett and et.al., 2018).
Sources of data information
Business information comes through various surveys, books, articles, internal records used by
business for guiding the planning, operation and evaluation of activities.
There are two sources of business information that are external as well as internal.
3
External information
It comes in various forms.
Print Information
It covers vast array of periodicals and array including microfiche and microfilms, news
letters and any more factors. Business information is derived in considerable amount from these
print sources.
Television and Radio Media
This source is least useful in informations available to the business. Programs are devoted
fro general investments by the companies.
Online Information
Web has turned out as most important source of business information. They could be
accessed from anywhere and information of every field is available of all the relevant years is
available (Fleet, 2017).
Internal Sources
Internal sources of data include information gained from managers, employees and the
financials. Managers provide for the internal working structures and processes of the
organisation. Employees provide for information related to the working environment of
company, head counts and culture followed in organisation. Financials provide information
regarding the position of company and enables comparison of performance over years (Sources
and type of data, 2018).
Difference between sample and a population
Sampling and population are the data collection methods
Population Sample
Measurable quality are known as parameter. Measurable quality is known as statistic.
Population is complete set. Sample is subset of population.
Reports are true representations of the opinion. Reports have margins of error & confidence
interval.
4
⊘ This is a preview!⊘
Do you want full access?
Subscribe today to unlock all pages.
Trusted by 1+ million students worldwide
It contain all members of specified group. It is subset representing entire population.
Population is most commonly used practice studied in statistics. Population can have
diverse topics like people living in country or all atoms comprising of crystals. Data is compiled
for entire population. Population generally consists of large group with particularly defined
elements (Flight and Julious, 2015).
When feasibility is not there in a census, subset of chosen population is known as sample.
Once the sample representing population is been determined , than for sample members data is
collected in experimental and observational settings. Descriptive analysis could be used for
summarizing sample data. Where measuring data of every element under study is not practical or
possible than the samples at random are selected from group of elements (Konik and et.al.,
2018).
Populations is set of the entities that are studied. For instance men's mean height. The
population is hypothetical as it includes every men that lived, are living and will be living in
future. Population refers to area that is being studied. It is not possible to measure entire
population as all members are not observable. Instead subset of population called sample could
be used for drawing the inferences. Thus mean height could be measured in sample of population
that is called static and this is used for drawing interest parameter in population.
Value of employing statistical methods for meeting the business objectives and to achieve the
competitive advantage.
Statistics is body of methods for making wise decisions in face of uncertainty. Businesses
are full of risks and uncertainties. Forecasts are to be made at each step, speculation refers to
losing or gaining by forecasting. Future trends of market could be expected with use of statistics.
If anticipations are not accurate than it may lead to failure of business decisions. Statistics helps
businesses in anticipating changes in supply, demand, fashion, habits etc. Statistics have utmost
importance in determining the products, to determining depression and boom phases. Using
statistics organisations are smoothly running their business, decreasing the uncertainties and
thereby contributing towards growth and success of the business (Sun and et.al., 2019).
5
Paraphrase This Document
Need a fresh take? Get an instant paraphrase of this document with our AI Paraphraser
Companies are collecting data on their own in course of business. Statistics are helping
business to inform manager to work on performance management of employees. Manager are
collecting data related with the productivity of employees like the units produced or tasks
completed. The analysis of data helps managers to find methods in which employees should
improve for achieving maximum productivity. Companies collect data about engagement and
satisfaction of job that is used by companies for tracking and ensuring that employees are
motivated and do not leave the enterprise. This helps in improving and enhancing the
productivity of employees so that they could lead the company in achieving the organisational
goals.
Beyond performance of managers, statistics is also helping in comparing alternative
scenarios so that the best options could be adopted by company. Teams have to decide about the
software that is used for automating ordering process of customers. They analyse software that
are successfully used by other organisations (Wey and et.al., 2019). It helps the management of
the business organisation in making informed decisions by making proper analysis by collecting
the data related to the analysis.
For making making logical business decisions, statistics is used by organisations. There
are various factors regarding which business have to make decisions depending on the facts and
assumptions. Companies have to collect data before approving any project that company is
planning to adopt. Projects involves huge funds of business therefore they are required to make
prior researches using the data available using different methods.
Difference between inferential and descriptive statistics and implications for business
intelligence.
Inferential Statistics
It refers to generalising data from sample to population. It means that outcomes of the of
sample could be deduced over larger population, where from sample has been taken. It is
considered as convenient way for drawing conclusion regarding the population where enquiry
from every member of universe is not possible. Sample chosen represents entire population, thus
it is required to contain features of population. Inferential statistic is used for determining
probabilities of the properties of population on basis of properties of sample, by using
probability theory. Main inferential statistic is based on statistical models like variance analysis, t
6
distribution, chi -square test, regression analysis. Methods used in inferential statistics include
testing hypothesis and estimation of parameter.
Descriptive Statistics
Descriptive statistics deals with discipline, quantitatively describing important
characteristics of data sets. For purpose of giving description of properties, this is using measures
of the central tendency that are mean, mode, median and measuring the dispersions like standard
deviation, range, quartile deviations and variance and many more (White, 2016).
Data are summarised by researchers in useful manners with help of the numerical & graphical
tools like tables, charts and graphs for representing data in accurate ways. Also texts are
presented for giving explanations over diagrams.
Key Differences
Descriptive statistic is discipline that is concerned for describing population that is under
study. Where inferential statistics focus over drawing conclusion about population, over
observation and sample analysis.
Descriptive statistics collect, organise and represent data in meaningful way. Inferential
statistic compare data, tests hypothesis & make predictions for future results.
There is tabular or diagrammatic presentation of final results in descriptive statistic where
final results are displayed in form of probabilities .
Descriptive describes situations where inferential statistics explain likelihood that an
event will occur (Difference between descriptive and inferential statistics, 2018).
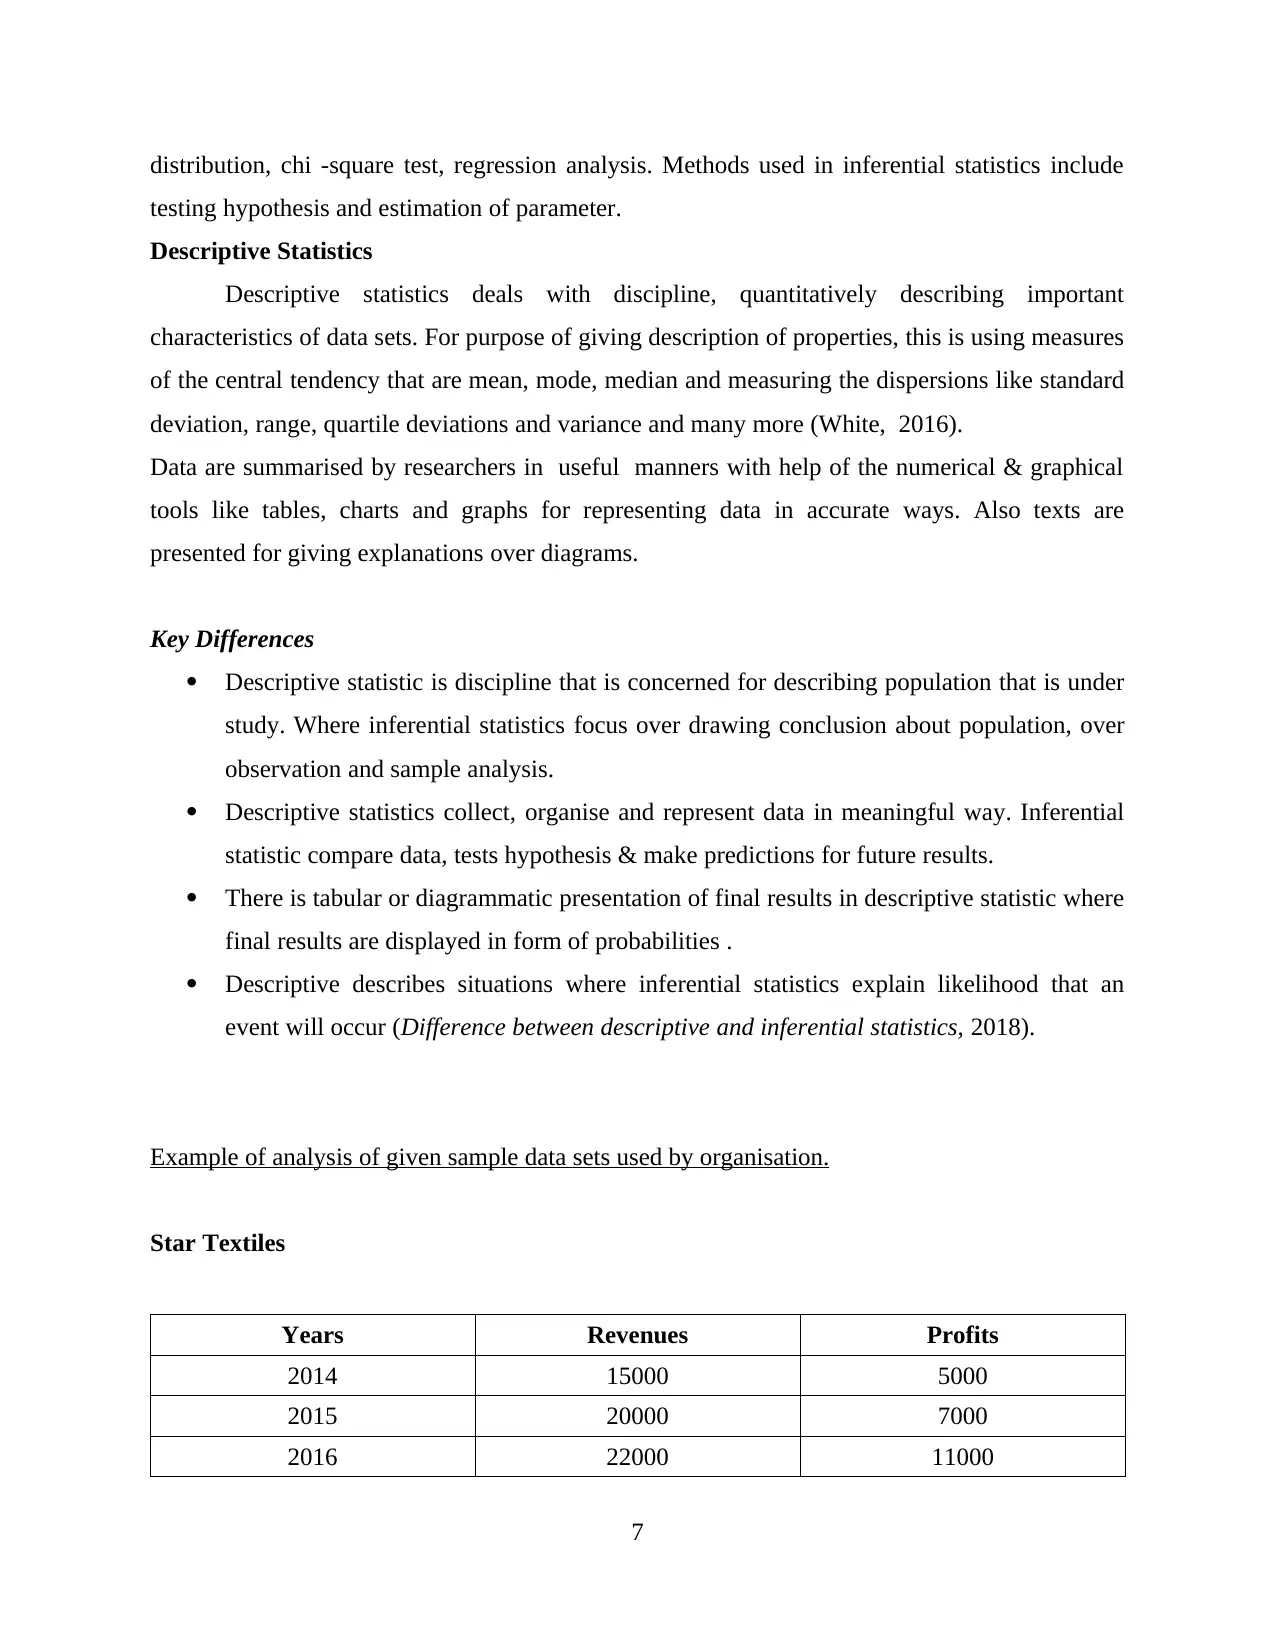
Example of analysis of given sample data sets used by organisation.
Star Textiles
Years Revenues Profits
2014 15000 5000
2015 20000 7000
2016 22000 11000
7
testing hypothesis and estimation of parameter.
Descriptive Statistics
Descriptive statistics deals with discipline, quantitatively describing important
characteristics of data sets. For purpose of giving description of properties, this is using measures
of the central tendency that are mean, mode, median and measuring the dispersions like standard
deviation, range, quartile deviations and variance and many more (White, 2016).
Data are summarised by researchers in useful manners with help of the numerical & graphical
tools like tables, charts and graphs for representing data in accurate ways. Also texts are
presented for giving explanations over diagrams.
Key Differences
Descriptive statistic is discipline that is concerned for describing population that is under
study. Where inferential statistics focus over drawing conclusion about population, over
observation and sample analysis.
Descriptive statistics collect, organise and represent data in meaningful way. Inferential
statistic compare data, tests hypothesis & make predictions for future results.
There is tabular or diagrammatic presentation of final results in descriptive statistic where
final results are displayed in form of probabilities .
Descriptive describes situations where inferential statistics explain likelihood that an
event will occur (Difference between descriptive and inferential statistics, 2018).
Example of analysis of given sample data sets used by organisation.
Star Textiles
Years Revenues Profits
2014 15000 5000
2015 20000 7000
2016 22000 11000
7
⊘ This is a preview!⊘
Do you want full access?
Subscribe today to unlock all pages.
Trusted by 1+ million students worldwide
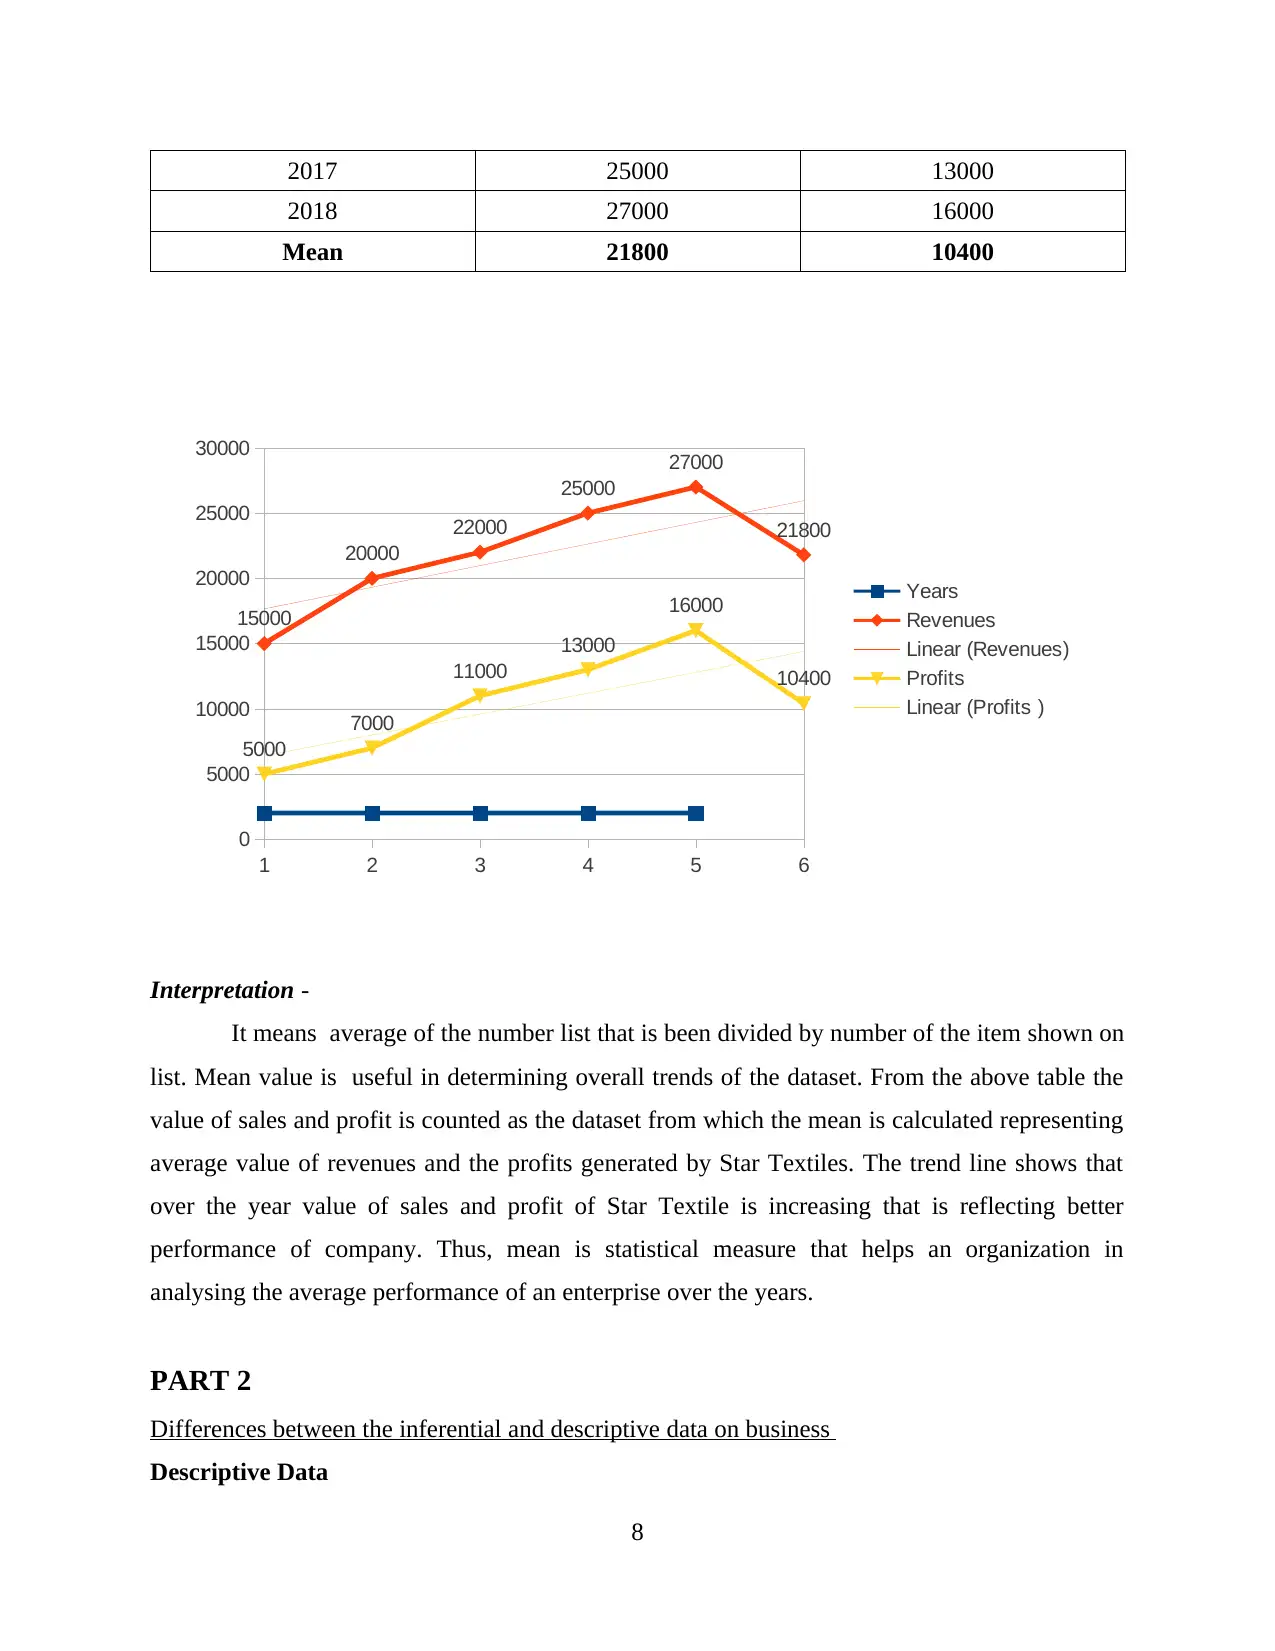
2017 25000 13000
2018 27000 16000
Mean 21800 10400
1 2 3 4 5 6
0
5000
10000
15000
20000
25000
30000
15000
20000
22000
25000
27000
21800
5000
7000
11000
13000
16000
10400
Years
Revenues
Linear (Revenues)
Profits
Linear (Profits )
Interpretation -
It means average of the number list that is been divided by number of the item shown on
list. Mean value is useful in determining overall trends of the dataset. From the above table the
value of sales and profit is counted as the dataset from which the mean is calculated representing
average value of revenues and the profits generated by Star Textiles. The trend line shows that
over the year value of sales and profit of Star Textile is increasing that is reflecting better
performance of company. Thus, mean is statistical measure that helps an organization in
analysing the average performance of an enterprise over the years.
PART 2
Differences between the inferential and descriptive data on business
Descriptive Data
8
Paraphrase This Document
Need a fresh take? Get an instant paraphrase of this document with our AI Paraphraser
Descriptive analysis helps organisations to understand things happened in past. It is
measurable that is limited. Descriptive analysis helps organisations in understanding relationship
of customers and the products. It also helps businesses to know what approach could be used by
company in future. It enables company to learn from the past behaviour for influencing the future
outcomes. Descriptive analysis is an essential sources for determining the next step (Yarnold and
Linden, 2016).
Inferential Data
Inferential analysis collects data over very large scale of population. It mainly focused
over drawing conclusions therefore is used by organisations to come at accurate results using the
sample analysis. The financial information and data of two companies can be compared and
future predictions could be made by company. It gives companies more reliable and accurate
results for making decisions.
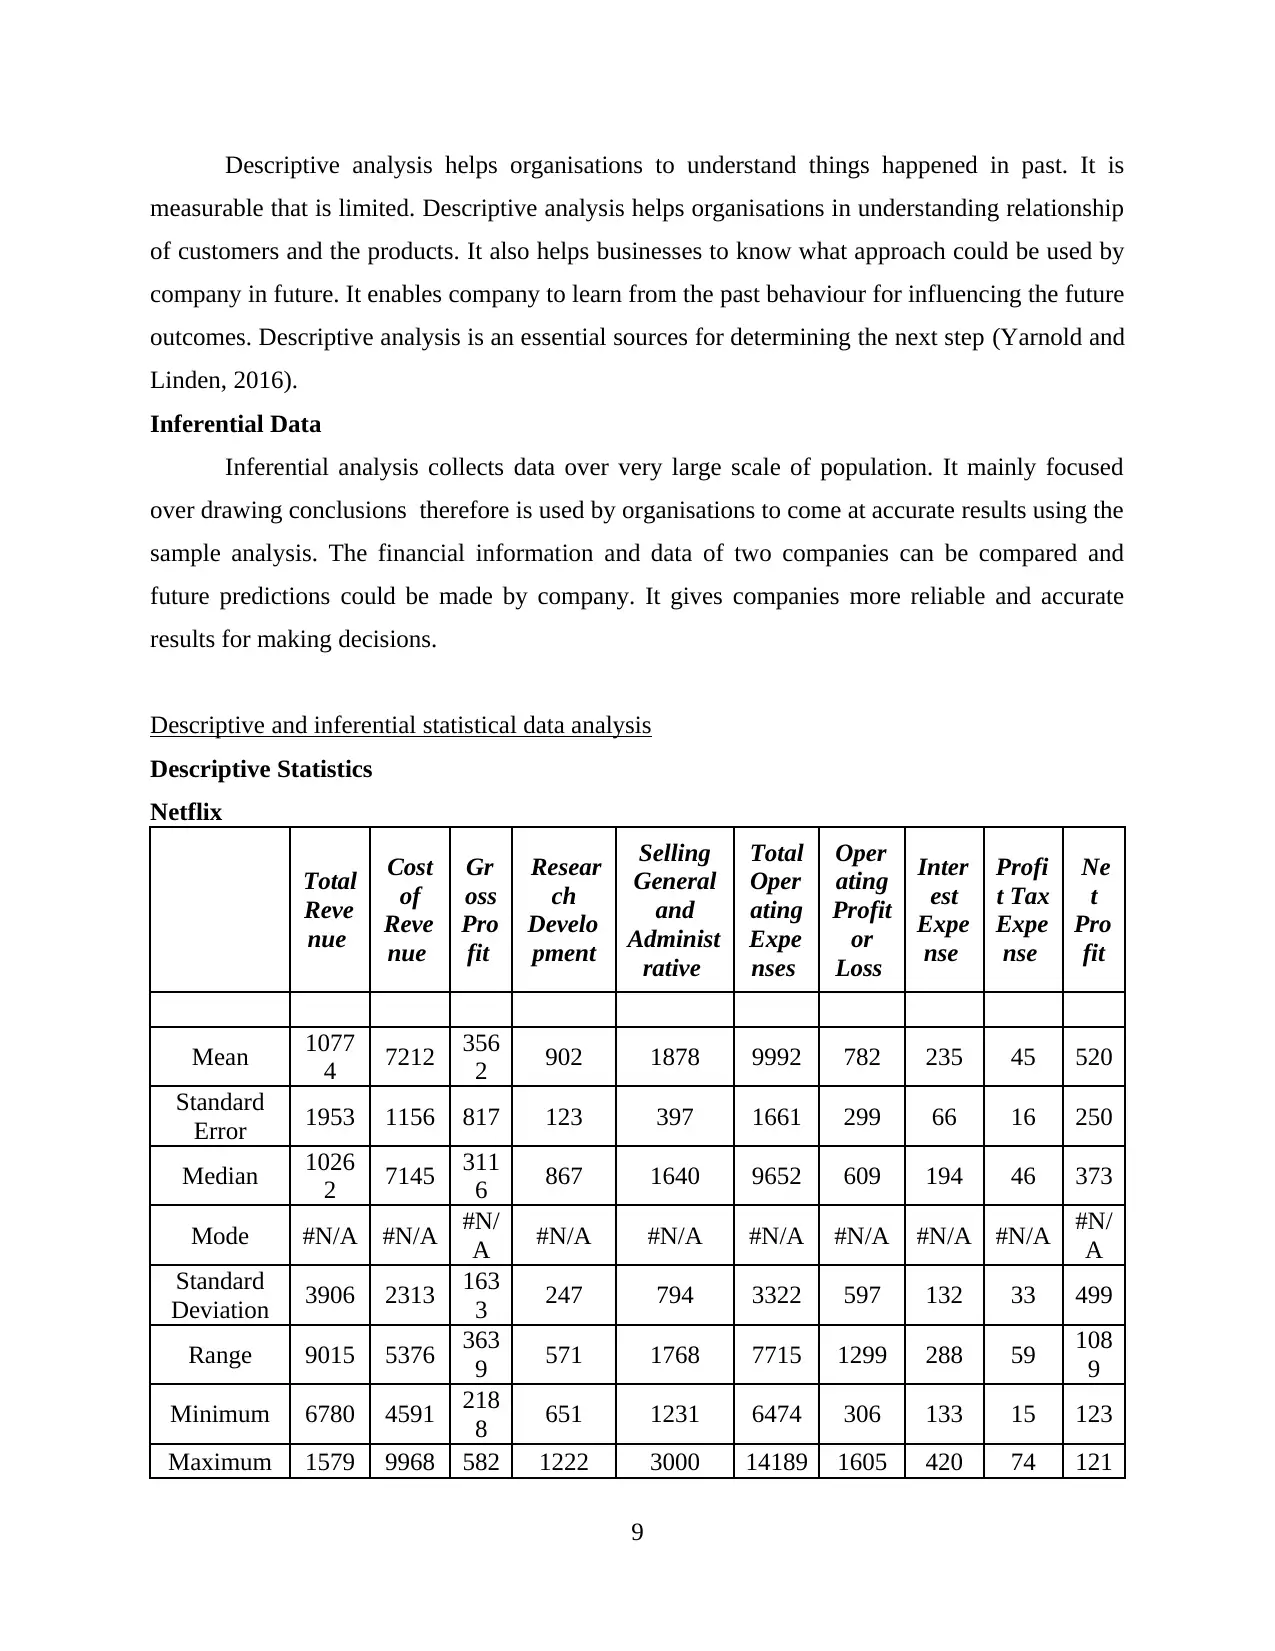
Descriptive and inferential statistical data analysis
Descriptive Statistics
Netflix
Total
Reve
nue
Cost
of
Reve
nue
Gr
oss
Pro
fit
Resear
ch
Develo
pment
Selling
General
and
Administ
rative
Total
Oper
ating
Expe
nses
Oper
ating
Profit
or
Loss
Inter
est
Expe
nse
Profi
t Tax
Expe
nse
Ne
t
Pro
fit
Mean 1077
4 7212 356
2 902 1878 9992 782 235 45 520
Standard
Error 1953 1156 817 123 397 1661 299 66 16 250
Median 1026
2 7145 311
6 867 1640 9652 609 194 46 373
Mode #N/A #N/A #N/
A #N/A #N/A #N/A #N/A #N/A #N/A #N/
A
Standard
Deviation 3906 2313 163
3 247 794 3322 597 132 33 499
Range 9015 5376 363
9 571 1768 7715 1299 288 59 108
9
Minimum 6780 4591 218
8 651 1231 6474 306 133 15 123
Maximum 1579 9968 582 1222 3000 14189 1605 420 74 121
9
measurable that is limited. Descriptive analysis helps organisations in understanding relationship
of customers and the products. It also helps businesses to know what approach could be used by
company in future. It enables company to learn from the past behaviour for influencing the future
outcomes. Descriptive analysis is an essential sources for determining the next step (Yarnold and
Linden, 2016).
Inferential Data
Inferential analysis collects data over very large scale of population. It mainly focused
over drawing conclusions therefore is used by organisations to come at accurate results using the
sample analysis. The financial information and data of two companies can be compared and
future predictions could be made by company. It gives companies more reliable and accurate
results for making decisions.
Descriptive and inferential statistical data analysis
Descriptive Statistics
Netflix
Total
Reve
nue
Cost
of
Reve
nue
Gr
oss
Pro
fit
Resear
ch
Develo
pment
Selling
General
and
Administ
rative
Total
Oper
ating
Expe
nses
Oper
ating
Profit
or
Loss
Inter
est
Expe
nse
Profi
t Tax
Expe
nse
Ne
t
Pro
fit
Mean 1077
4 7212 356
2 902 1878 9992 782 235 45 520
Standard
Error 1953 1156 817 123 397 1661 299 66 16 250
Median 1026
2 7145 311
6 867 1640 9652 609 194 46 373
Mode #N/A #N/A #N/
A #N/A #N/A #N/A #N/A #N/A #N/A #N/
A
Standard
Deviation 3906 2313 163
3 247 794 3322 597 132 33 499
Range 9015 5376 363
9 571 1768 7715 1299 288 59 108
9
Minimum 6780 4591 218
8 651 1231 6474 306 133 15 123
Maximum 1579 9968 582 1222 3000 14189 1605 420 74 121
9
4 7 1
From above table it is seen that mean value of total revenue earn by Netflix is 10774 and cost of
revenue is 7212. On an average Netflix earn gross profit of 3562. Standard deviation of all
these three is high and on this basis, it can be said that variable value is changing at fast
pace. Average operating profit and net profit are very low 782 and 520. Thus, it can be said
that low profit is earned by Netflix in its business.
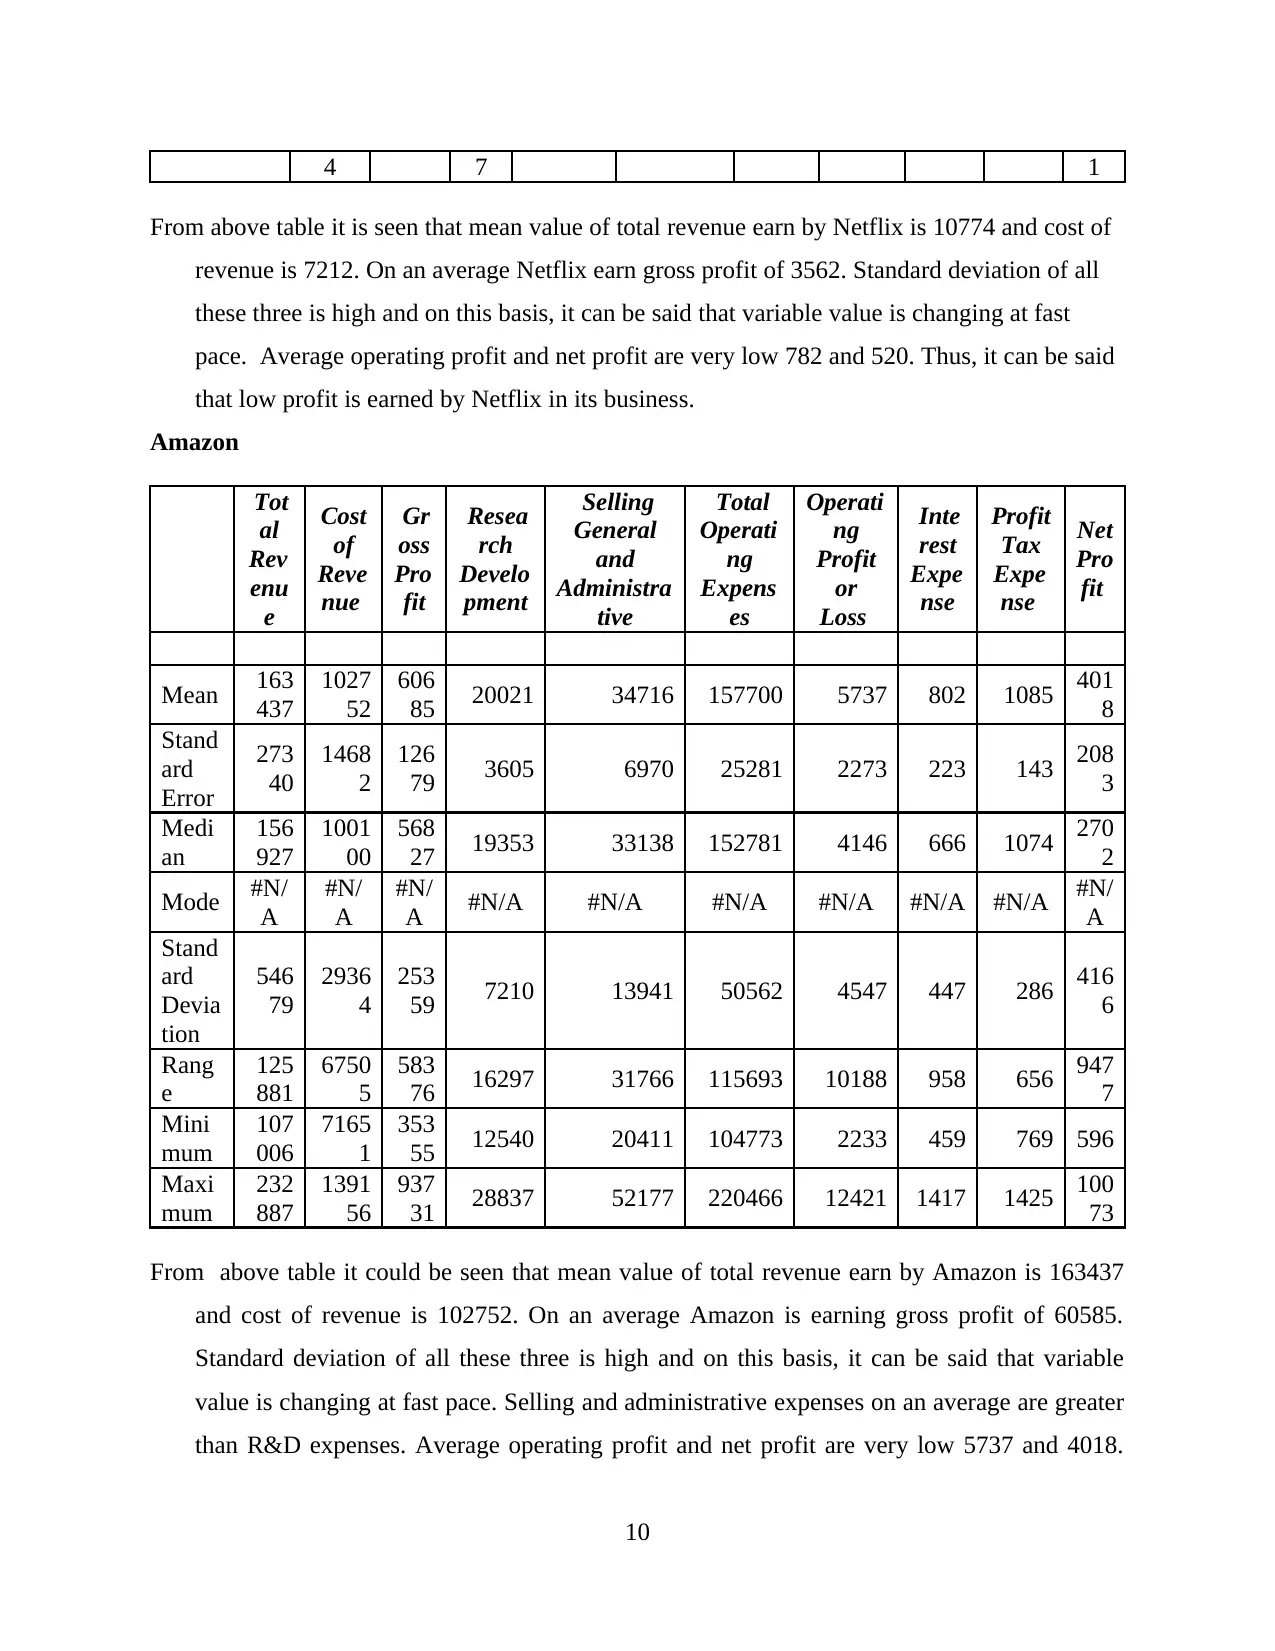
Amazon
Tot
al
Rev
enu
e
Cost
of
Reve
nue
Gr
oss
Pro
fit
Resea
rch
Develo
pment
Selling
General
and
Administra
tive
Total
Operati
ng
Expens
es
Operati
ng
Profit
or
Loss
Inte
rest
Expe
nse
Profit
Tax
Expe
nse
Net
Pro
fit
Mean 163
437
1027
52
606
85 20021 34716 157700 5737 802 1085 401
8
Stand
ard
Error
273
40
1468
2
126
79 3605 6970 25281 2273 223 143 208
3
Medi
an
156
927
1001
00
568
27 19353 33138 152781 4146 666 1074 270
2
Mode #N/
A
#N/
A
#N/
A #N/A #N/A #N/A #N/A #N/A #N/A #N/
A
Stand
ard
Devia
tion
546
79
2936
4
253
59 7210 13941 50562 4547 447 286 416
6
Rang
e
125
881
6750
5
583
76 16297 31766 115693 10188 958 656 947
7
Mini
mum
107
006
7165
1
353
55 12540 20411 104773 2233 459 769 596
Maxi
mum
232
887
1391
56
937
31 28837 52177 220466 12421 1417 1425 100
73
From above table it could be seen that mean value of total revenue earn by Amazon is 163437
and cost of revenue is 102752. On an average Amazon is earning gross profit of 60585.
Standard deviation of all these three is high and on this basis, it can be said that variable
value is changing at fast pace. Selling and administrative expenses on an average are greater
than R&D expenses. Average operating profit and net profit are very low 5737 and 4018.
10
From above table it is seen that mean value of total revenue earn by Netflix is 10774 and cost of
revenue is 7212. On an average Netflix earn gross profit of 3562. Standard deviation of all
these three is high and on this basis, it can be said that variable value is changing at fast
pace. Average operating profit and net profit are very low 782 and 520. Thus, it can be said
that low profit is earned by Netflix in its business.
Amazon
Tot
al
Rev
enu
e
Cost
of
Reve
nue
Gr
oss
Pro
fit
Resea
rch
Develo
pment
Selling
General
and
Administra
tive
Total
Operati
ng
Expens
es
Operati
ng
Profit
or
Loss
Inte
rest
Expe
nse
Profit
Tax
Expe
nse
Net
Pro
fit
Mean 163
437
1027
52
606
85 20021 34716 157700 5737 802 1085 401
8
Stand
ard
Error
273
40
1468
2
126
79 3605 6970 25281 2273 223 143 208
3
Medi
an
156
927
1001
00
568
27 19353 33138 152781 4146 666 1074 270
2
Mode #N/
A
#N/
A
#N/
A #N/A #N/A #N/A #N/A #N/A #N/A #N/
A
Stand
ard
Devia
tion
546
79
2936
4
253
59 7210 13941 50562 4547 447 286 416
6
Rang
e
125
881
6750
5
583
76 16297 31766 115693 10188 958 656 947
7
Mini
mum
107
006
7165
1
353
55 12540 20411 104773 2233 459 769 596
Maxi
mum
232
887
1391
56
937
31 28837 52177 220466 12421 1417 1425 100
73
From above table it could be seen that mean value of total revenue earn by Amazon is 163437
and cost of revenue is 102752. On an average Amazon is earning gross profit of 60585.
Standard deviation of all these three is high and on this basis, it can be said that variable
value is changing at fast pace. Selling and administrative expenses on an average are greater
than R&D expenses. Average operating profit and net profit are very low 5737 and 4018.
10
⊘ This is a preview!⊘
Do you want full access?
Subscribe today to unlock all pages.
Trusted by 1+ million students worldwide
1 out of 19