Statistics Management Report: Data Analysis and Business Decisions
VerifiedAdded on 2023/01/19
|19
|4230
|89
Report
AI Summary
This report provides a comprehensive overview of statistics management within a business context. It begins with an introduction to statistics, differentiating between descriptive and inferential statistics, and discussing data sources like primary and secondary data, including statistical and non-statistical sources. The report then clarifies the difference between samples and populations, explaining their significance in data analysis. It highlights the value of statistical techniques in achieving business competitiveness and objectives, emphasizing their role in decision-making and performance evaluation. The report contrasts descriptive and inferential statistics, illustrating their implications for business intelligence. It includes examples of datasets and concludes with an evaluation of descriptive and inferential data, the application of statistical methods, and the presentation of findings in an appropriate format.
STATISTICS
MANAGEMENT
MANAGEMENT
Paraphrase This Document
Need a fresh take? Get an instant paraphrase of this document with our AI Paraphraser
TABLE OF CONTENTS
INTRODUCTION...........................................................................................................................1
Part 1................................................................................................................................................1
Overview of statistics..................................................................................................................1
Sources and the kind of the information accessed by the business ............................................2
Difference between the sample and population .........................................................................3
Explaining the value of application of the statistical techniques in respect of achieving
competitiveness and objectives ..................................................................................................4
Explaining contrast between inferential & descriptive statistics with implication in respect of
the business intelligence .............................................................................................................5
Providing appropriate examples of given dataset ......................................................................6
PART-2............................................................................................................................................8
Evaluating contrast between an inferential and descriptive data................................................8
Application of the range of different statistical methods ...........................................................9
Presenting the finding in an appropriate format .......................................................................11
CONCLUSION..............................................................................................................................15
REFERENCES..............................................................................................................................16
INTRODUCTION
Statistics management provides the managers with tools that are important in making
sense of the large quantities of the data and making the most suitable business decisions on the
basis of the inferences drawn from the data. Collecting a numerical history of the occurrence
factors on the optional repairs or the processes which helps in determining requirement fro the
accurate quantities of the material for smoothing delay at the time of production fluctuations.
The present report is based on statistical management within which various statistical measures
are been highlighted that helps the firm in evaluating its performance.
Part 1
Overview of statistics
Statistics is the form of the mathematical analysis that makes use of the quantified
models, synopses and representations for the specific experimental dataset and real life based
examples (Walters, 2016). In other words it is the term that is been used for characterizing
dataset as in case if dataset depends on the sample of the larger population then analyst could
develop an interactions regarding population on the basis of statistical results from sample.
Mainly the characteristic of statistics reflects that it is counted as the aggregate of the facts that
are been expressed in the numerical form.
Statistics is highly affected to the market extent through multiplicity of the causes and are
enumerated in accordance to the reasonable accuracy standards. Statistical data are been gathered
for the predetermined purpose in the systematic manner which could be comparable with each
other (Kaliyadan and Kulkarni, 2019). Furthermore, statistic is stated as the discipline which is
concerned with collection, displaying, interpreting, organizing and presenting the data. For
example- Average height of the students samples and their weight.
There are majorly two statistical methods that is been used in analysing the data that
involves descriptive statistic and inferential statistics. In descriptive statistics, several techniques
been applied fro assessing the data that includes mean, median, mode, range, standard deviation,
skewness, kurtosis etc (Krickeberg, Van Trong and Hanh, 2019). on the other under inferential
method, data are been subjected to the random variation like sampling variation and
observational errors etc. that helps in drawing conclusions in an effective manner.
1
⊘ This is a preview!⊘
Do you want full access?
Subscribe today to unlock all pages.
Trusted by 1+ million students worldwide
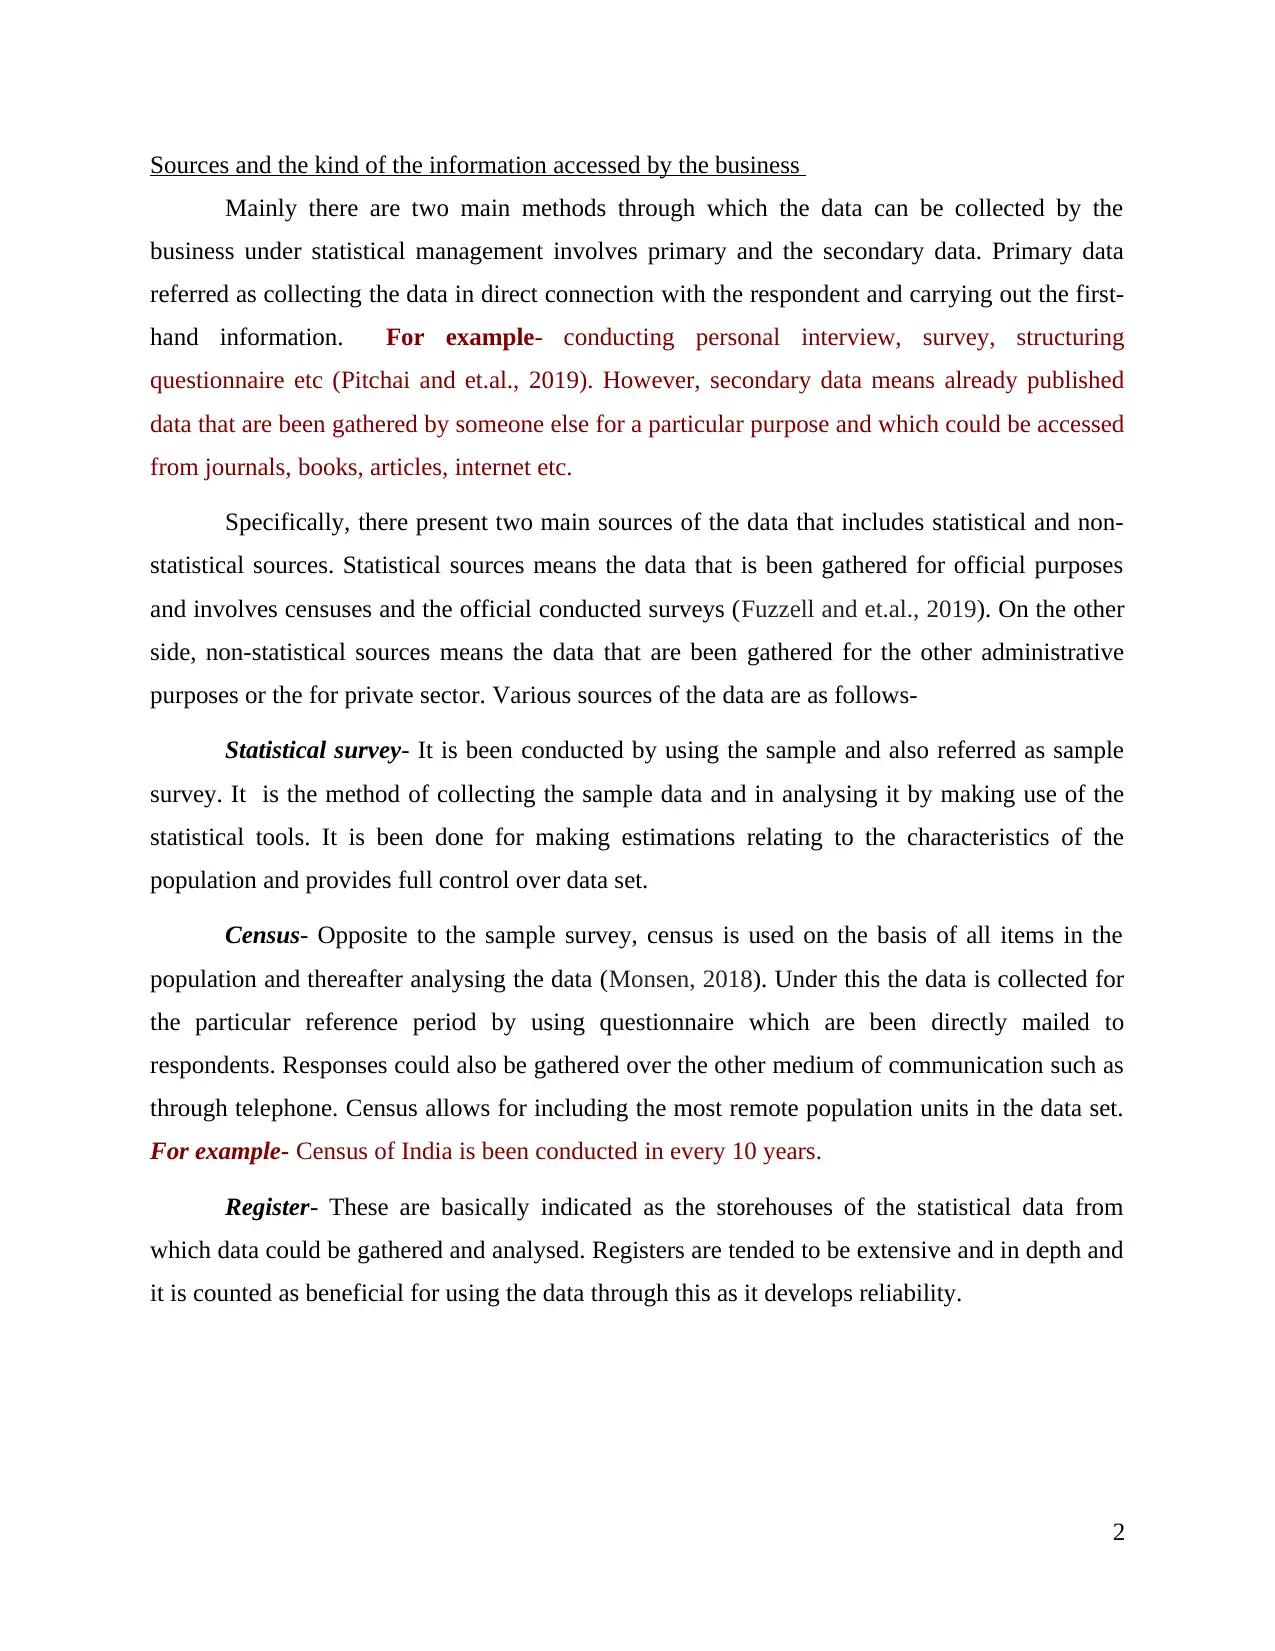
Sources and the kind of the information accessed by the business
Mainly there are two main methods through which the data can be collected by the
business under statistical management involves primary and the secondary data. Primary data
referred as collecting the data in direct connection with the respondent and carrying out the first-
hand information. For example- conducting personal interview, survey, structuring
questionnaire etc (Pitchai and et.al., 2019). However, secondary data means already published
data that are been gathered by someone else for a particular purpose and which could be accessed
from journals, books, articles, internet etc.
Specifically, there present two main sources of the data that includes statistical and non-
statistical sources. Statistical sources means the data that is been gathered for official purposes
and involves censuses and the official conducted surveys (Fuzzell and et.al., 2019). On the other
side, non-statistical sources means the data that are been gathered for the other administrative
purposes or the for private sector. Various sources of the data are as follows-
Statistical survey- It is been conducted by using the sample and also referred as sample
survey. It is the method of collecting the sample data and in analysing it by making use of the
statistical tools. It is been done for making estimations relating to the characteristics of the
population and provides full control over data set.
Census- Opposite to the sample survey, census is used on the basis of all items in the
population and thereafter analysing the data (Monsen, 2018). Under this the data is collected for
the particular reference period by using questionnaire which are been directly mailed to
respondents. Responses could also be gathered over the other medium of communication such as
through telephone. Census allows for including the most remote population units in the data set.
For example- Census of India is been conducted in every 10 years.
Register- These are basically indicated as the storehouses of the statistical data from
which data could be gathered and analysed. Registers are tended to be extensive and in depth and
it is counted as beneficial for using the data through this as it develops reliability.
2
Paraphrase This Document
Need a fresh take? Get an instant paraphrase of this document with our AI Paraphraser
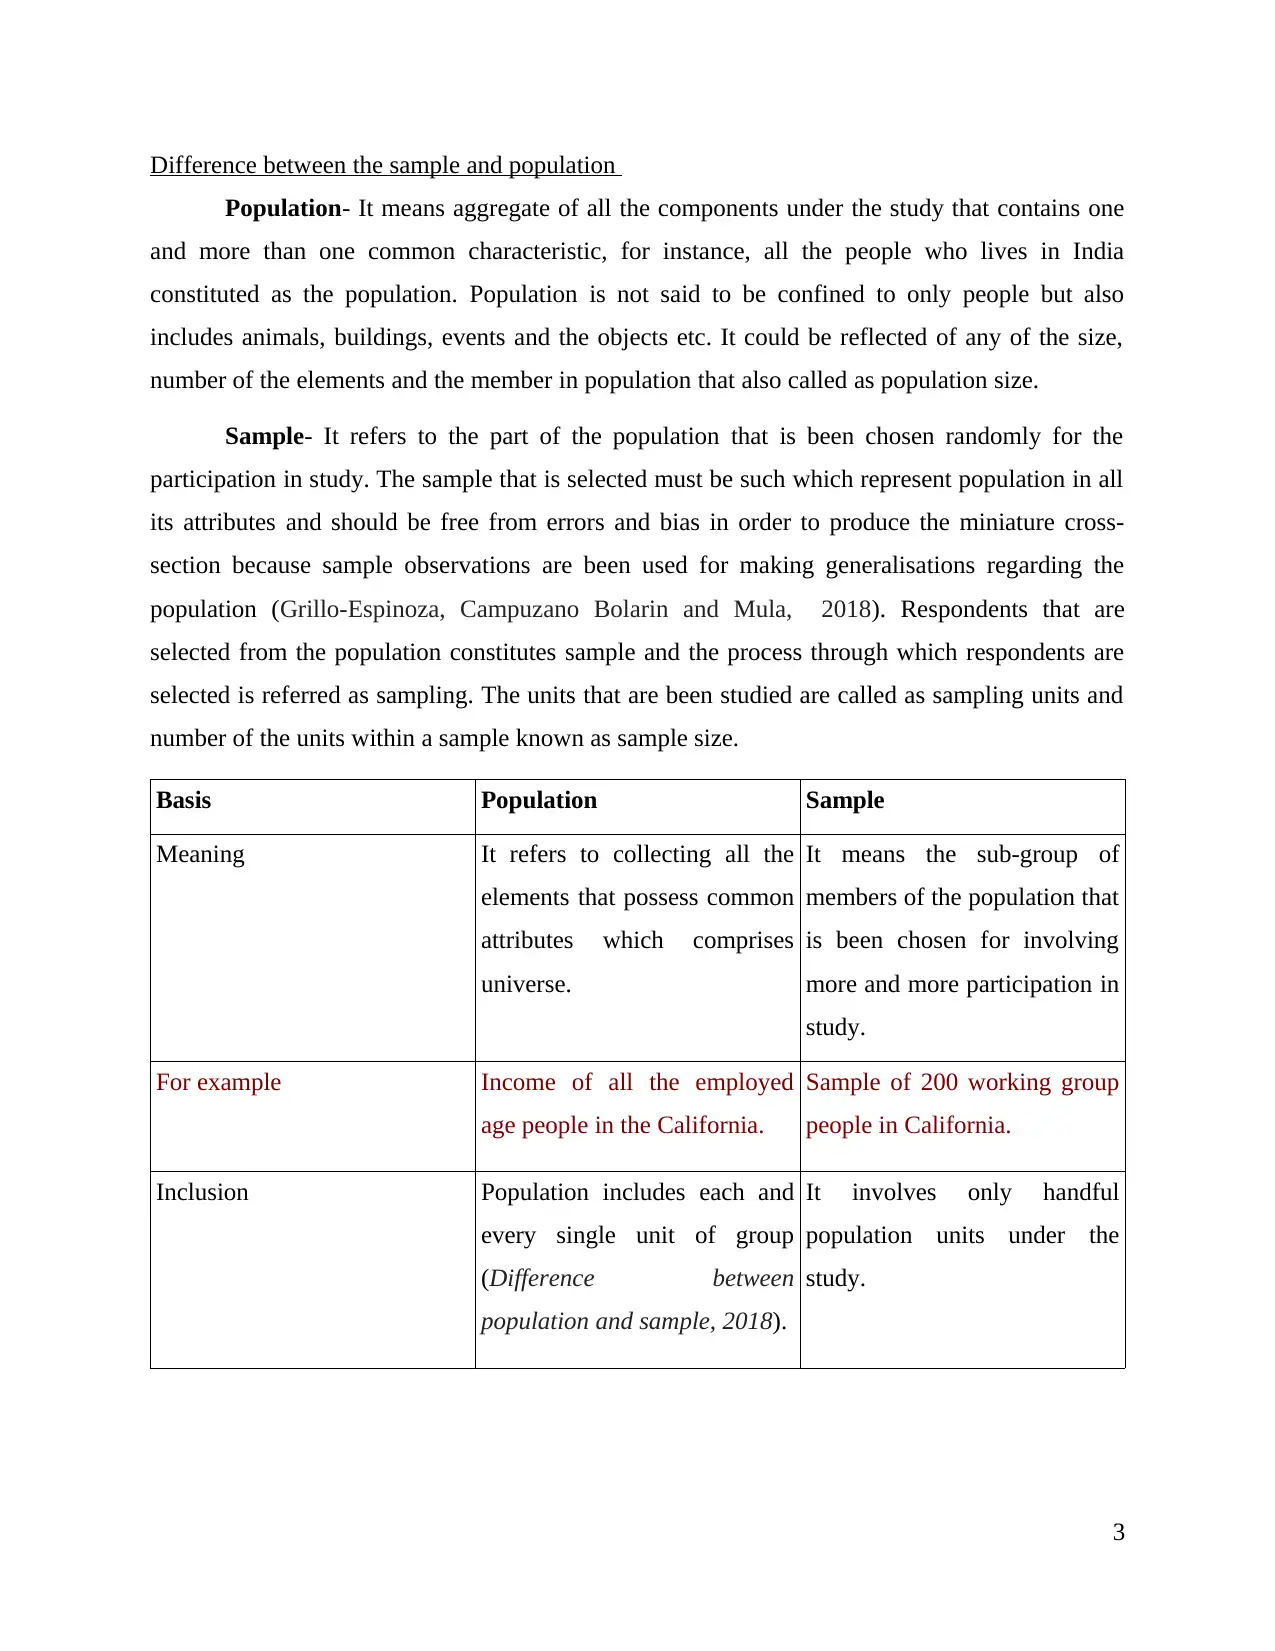
Difference between the sample and population
Population- It means aggregate of all the components under the study that contains one
and more than one common characteristic, for instance, all the people who lives in India
constituted as the population. Population is not said to be confined to only people but also
includes animals, buildings, events and the objects etc. It could be reflected of any of the size,
number of the elements and the member in population that also called as population size.
Sample- It refers to the part of the population that is been chosen randomly for the
participation in study. The sample that is selected must be such which represent population in all
its attributes and should be free from errors and bias in order to produce the miniature cross-
section because sample observations are been used for making generalisations regarding the
population (Grillo-Espinoza, Campuzano Bolarin and Mula, 2018). Respondents that are
selected from the population constitutes sample and the process through which respondents are
selected is referred as sampling. The units that are been studied are called as sampling units and
number of the units within a sample known as sample size.
Basis Population Sample
Meaning It refers to collecting all the
elements that possess common
attributes which comprises
universe.
It means the sub-group of
members of the population that
is been chosen for involving
more and more participation in
study.
For example Income of all the employed
age people in the California.
Sample of 200 working group
people in California.
Inclusion Population includes each and
every single unit of group
(Difference between
population and sample, 2018).
It involves only handful
population units under the
study.
3
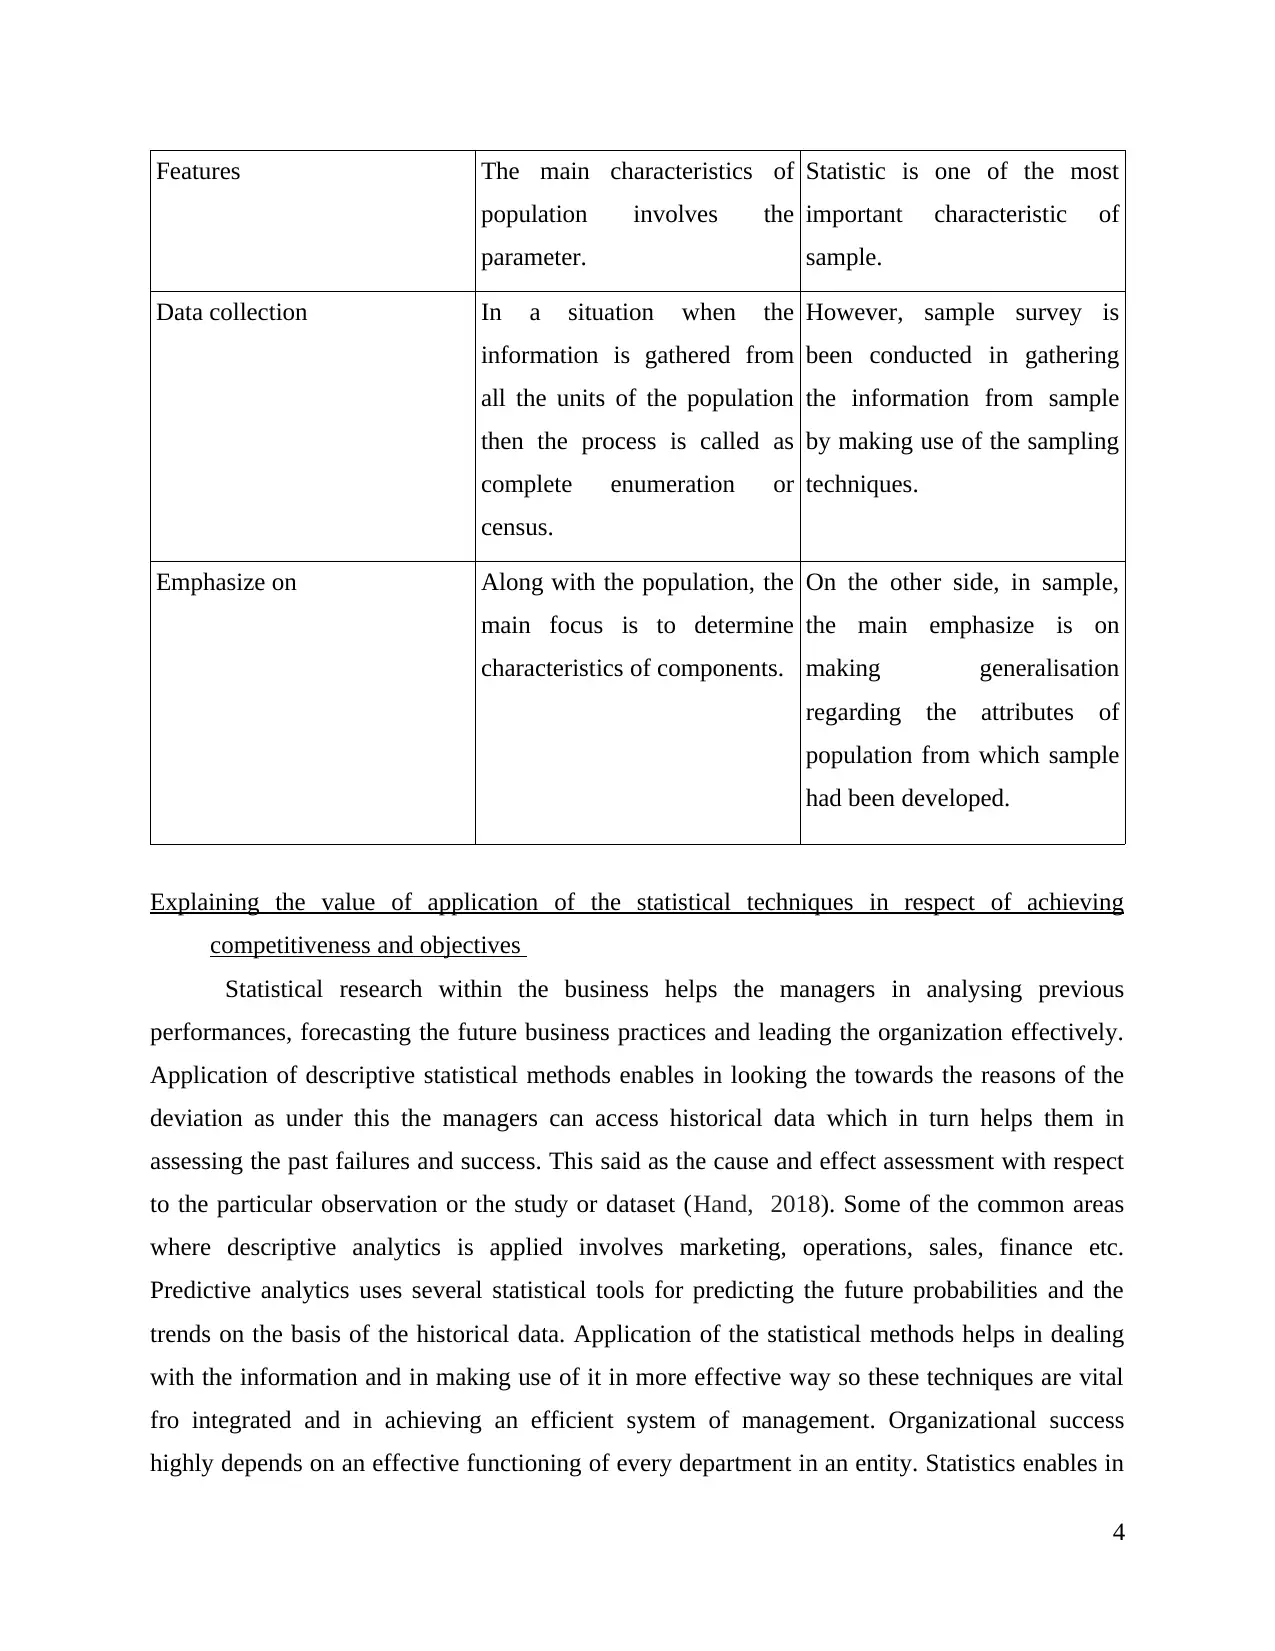
Features The main characteristics of
population involves the
parameter.
Statistic is one of the most
important characteristic of
sample.
Data collection In a situation when the
information is gathered from
all the units of the population
then the process is called as
complete enumeration or
census.
However, sample survey is
been conducted in gathering
the information from sample
by making use of the sampling
techniques.
Emphasize on Along with the population, the
main focus is to determine
characteristics of components.
On the other side, in sample,
the main emphasize is on
making generalisation
regarding the attributes of
population from which sample
had been developed.
Explaining the value of application of the statistical techniques in respect of achieving
competitiveness and objectives
Statistical research within the business helps the managers in analysing previous
performances, forecasting the future business practices and leading the organization effectively.
Application of descriptive statistical methods enables in looking the towards the reasons of the
deviation as under this the managers can access historical data which in turn helps them in
assessing the past failures and success. This said as the cause and effect assessment with respect
to the particular observation or the study or dataset (Hand, 2018). Some of the common areas
where descriptive analytics is applied involves marketing, operations, sales, finance etc.
Predictive analytics uses several statistical tools for predicting the future probabilities and the
trends on the basis of the historical data. Application of the statistical methods helps in dealing
with the information and in making use of it in more effective way so these techniques are vital
fro integrated and in achieving an efficient system of management. Organizational success
highly depends on an effective functioning of every department in an entity. Statistics enables in
4
⊘ This is a preview!⊘
Do you want full access?
Subscribe today to unlock all pages.
Trusted by 1+ million students worldwide
assessing effectiveness and efficiency of the functioning within individual departments and also
in improving their performance on the continuous basis. Statistical methods facilitates an
effective medium for ensuring effective communication at all levels with the company and this in
turn helps in attaining competitive edge and objectives in an efficient way (Nuijten, 2019).
Applying statistical methods is considered as the right method in securing the goal setting and in
achieving social and an economic phenomena in order to find out an adequate solution. In the
commercial segment, statistical techniques attracts increasing the attention from the different
institutions that are working in field of making operation policies and in taking sound or suitable
decisions based on scientific evaluation along with the future planning. For example- Sampling
tools and an estimation theory are counted as very powerful in conducting social survey relating
to the strata of any society.
Regression and the correlation analysis is been used for studying impact of the each factor in
accordance to the given observation.
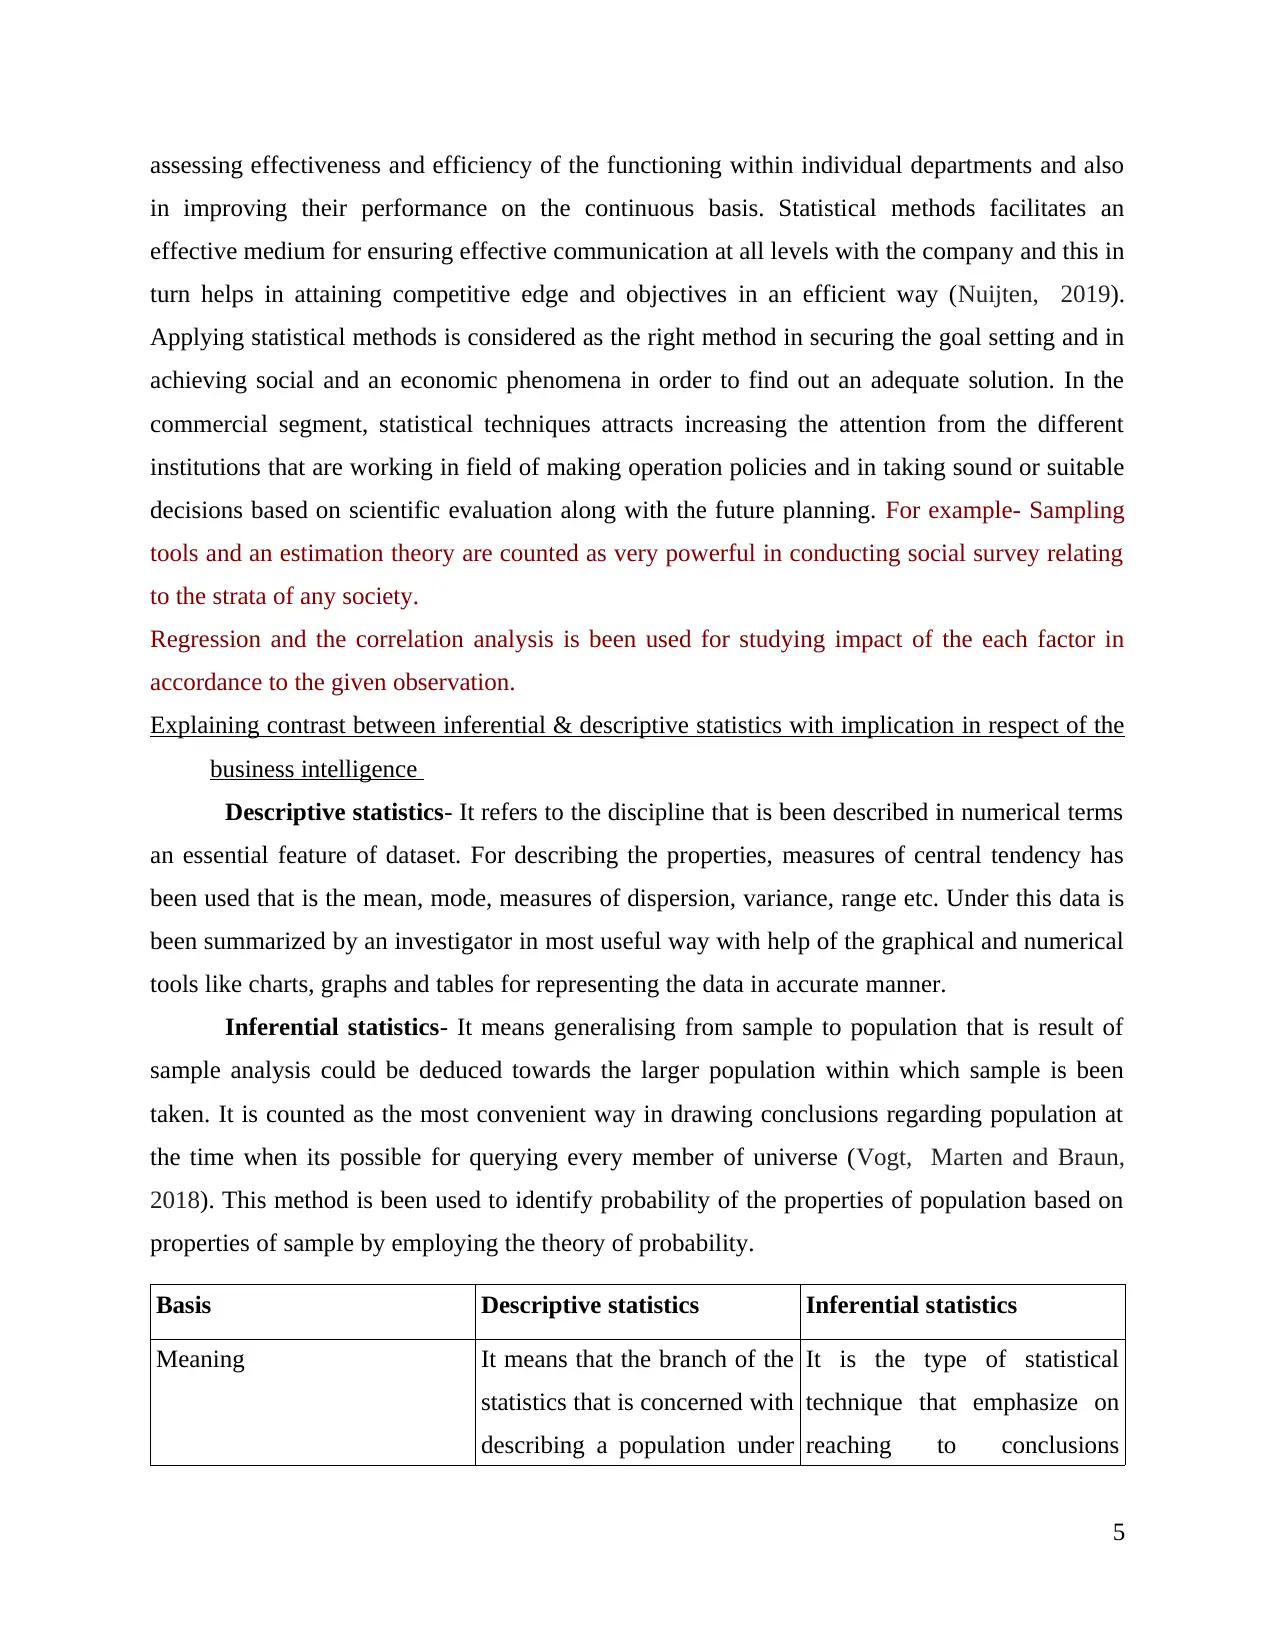
Explaining contrast between inferential & descriptive statistics with implication in respect of the
business intelligence
Descriptive statistics- It refers to the discipline that is been described in numerical terms
an essential feature of dataset. For describing the properties, measures of central tendency has
been used that is the mean, mode, measures of dispersion, variance, range etc. Under this data is
been summarized by an investigator in most useful way with help of the graphical and numerical
tools like charts, graphs and tables for representing the data in accurate manner.
Inferential statistics- It means generalising from sample to population that is result of
sample analysis could be deduced towards the larger population within which sample is been
taken. It is counted as the most convenient way in drawing conclusions regarding population at
the time when its possible for querying every member of universe (Vogt, Marten and Braun,
2018). This method is been used to identify probability of the properties of population based on
properties of sample by employing the theory of probability.
Basis Descriptive statistics Inferential statistics
Meaning It means that the branch of the
statistics that is concerned with
describing a population under
It is the type of statistical
technique that emphasize on
reaching to conclusions
5
in improving their performance on the continuous basis. Statistical methods facilitates an
effective medium for ensuring effective communication at all levels with the company and this in
turn helps in attaining competitive edge and objectives in an efficient way (Nuijten, 2019).
Applying statistical methods is considered as the right method in securing the goal setting and in
achieving social and an economic phenomena in order to find out an adequate solution. In the
commercial segment, statistical techniques attracts increasing the attention from the different
institutions that are working in field of making operation policies and in taking sound or suitable
decisions based on scientific evaluation along with the future planning. For example- Sampling
tools and an estimation theory are counted as very powerful in conducting social survey relating
to the strata of any society.
Regression and the correlation analysis is been used for studying impact of the each factor in
accordance to the given observation.
Explaining contrast between inferential & descriptive statistics with implication in respect of the
business intelligence
Descriptive statistics- It refers to the discipline that is been described in numerical terms
an essential feature of dataset. For describing the properties, measures of central tendency has
been used that is the mean, mode, measures of dispersion, variance, range etc. Under this data is
been summarized by an investigator in most useful way with help of the graphical and numerical
tools like charts, graphs and tables for representing the data in accurate manner.
Inferential statistics- It means generalising from sample to population that is result of
sample analysis could be deduced towards the larger population within which sample is been
taken. It is counted as the most convenient way in drawing conclusions regarding population at
the time when its possible for querying every member of universe (Vogt, Marten and Braun,
2018). This method is been used to identify probability of the properties of population based on
properties of sample by employing the theory of probability.
Basis Descriptive statistics Inferential statistics
Meaning It means that the branch of the
statistics that is concerned with
describing a population under
It is the type of statistical
technique that emphasize on
reaching to conclusions
5
Paraphrase This Document
Need a fresh take? Get an instant paraphrase of this document with our AI Paraphraser
the study. relating to the population
based on the sample analysis
and an observation.
Purpose The main purpose of applying
the descriptive tool of statistics
is organizing, analysing the
present data in more
meaningful way.
Under this the data is been
compared, predicted and tested
in an effective manner.
Final result form The result generated under this
is been reflected in from of
charts, tables and graph
(Contrast between inferential
and descriptive statistics,
2019. ).
Under inferential statistics, the
result are been shown in form
of the probability.
Use Descriptive technique is
mainly been used for
describing a particular
situation.
In order to explain possibility
of occurrence of a specific
event.
function It describes the data that is
already been known in
summarizing the sample.
This technique attempts for
reaching to conclusions for
learning about population
which extends beyond the
available data.
Example Mean, Mode, range etc. Hypotheses testing, ANOVA
etc.
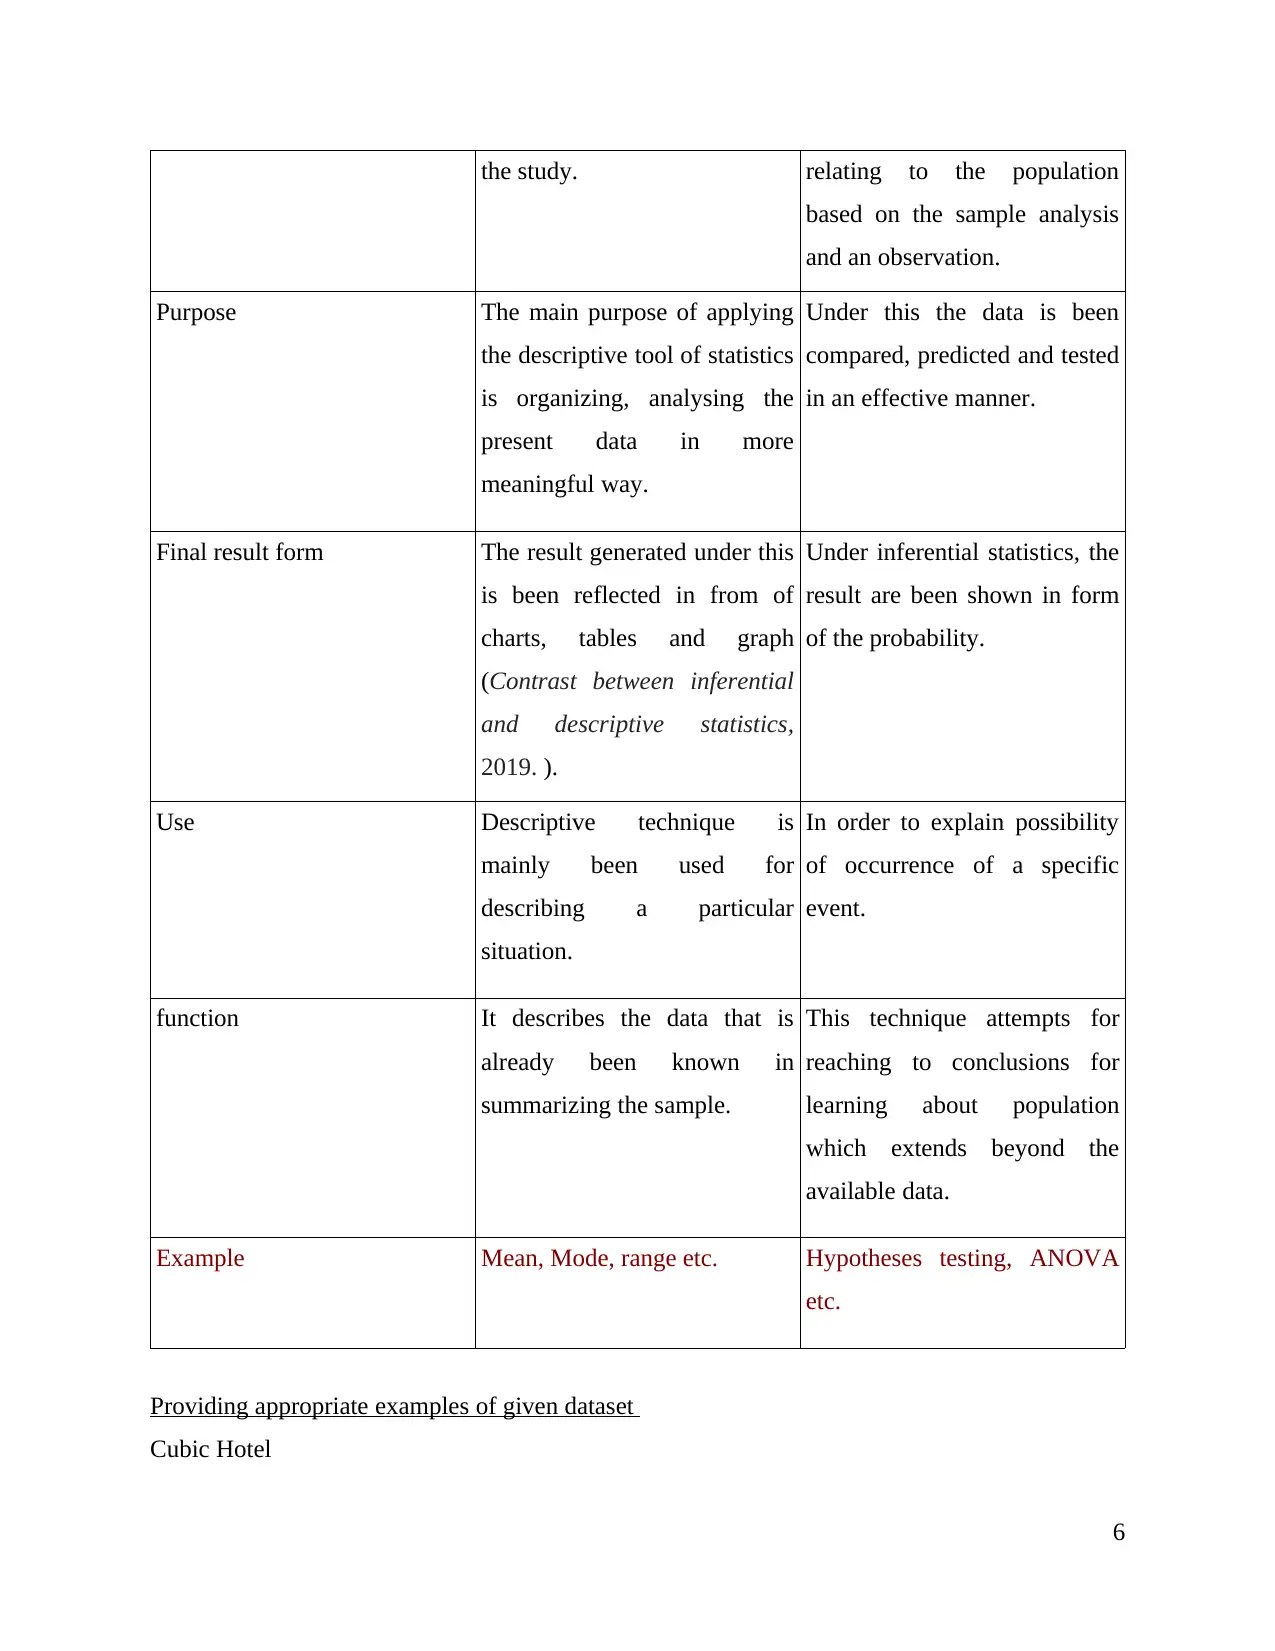
Providing appropriate examples of given dataset
Cubic Hotel
6
based on the sample analysis
and an observation.
Purpose The main purpose of applying
the descriptive tool of statistics
is organizing, analysing the
present data in more
meaningful way.
Under this the data is been
compared, predicted and tested
in an effective manner.
Final result form The result generated under this
is been reflected in from of
charts, tables and graph
(Contrast between inferential
and descriptive statistics,
2019. ).
Under inferential statistics, the
result are been shown in form
of the probability.
Use Descriptive technique is
mainly been used for
describing a particular
situation.
In order to explain possibility
of occurrence of a specific
event.
function It describes the data that is
already been known in
summarizing the sample.
This technique attempts for
reaching to conclusions for
learning about population
which extends beyond the
available data.
Example Mean, Mode, range etc. Hypotheses testing, ANOVA
etc.
Providing appropriate examples of given dataset
Cubic Hotel
6
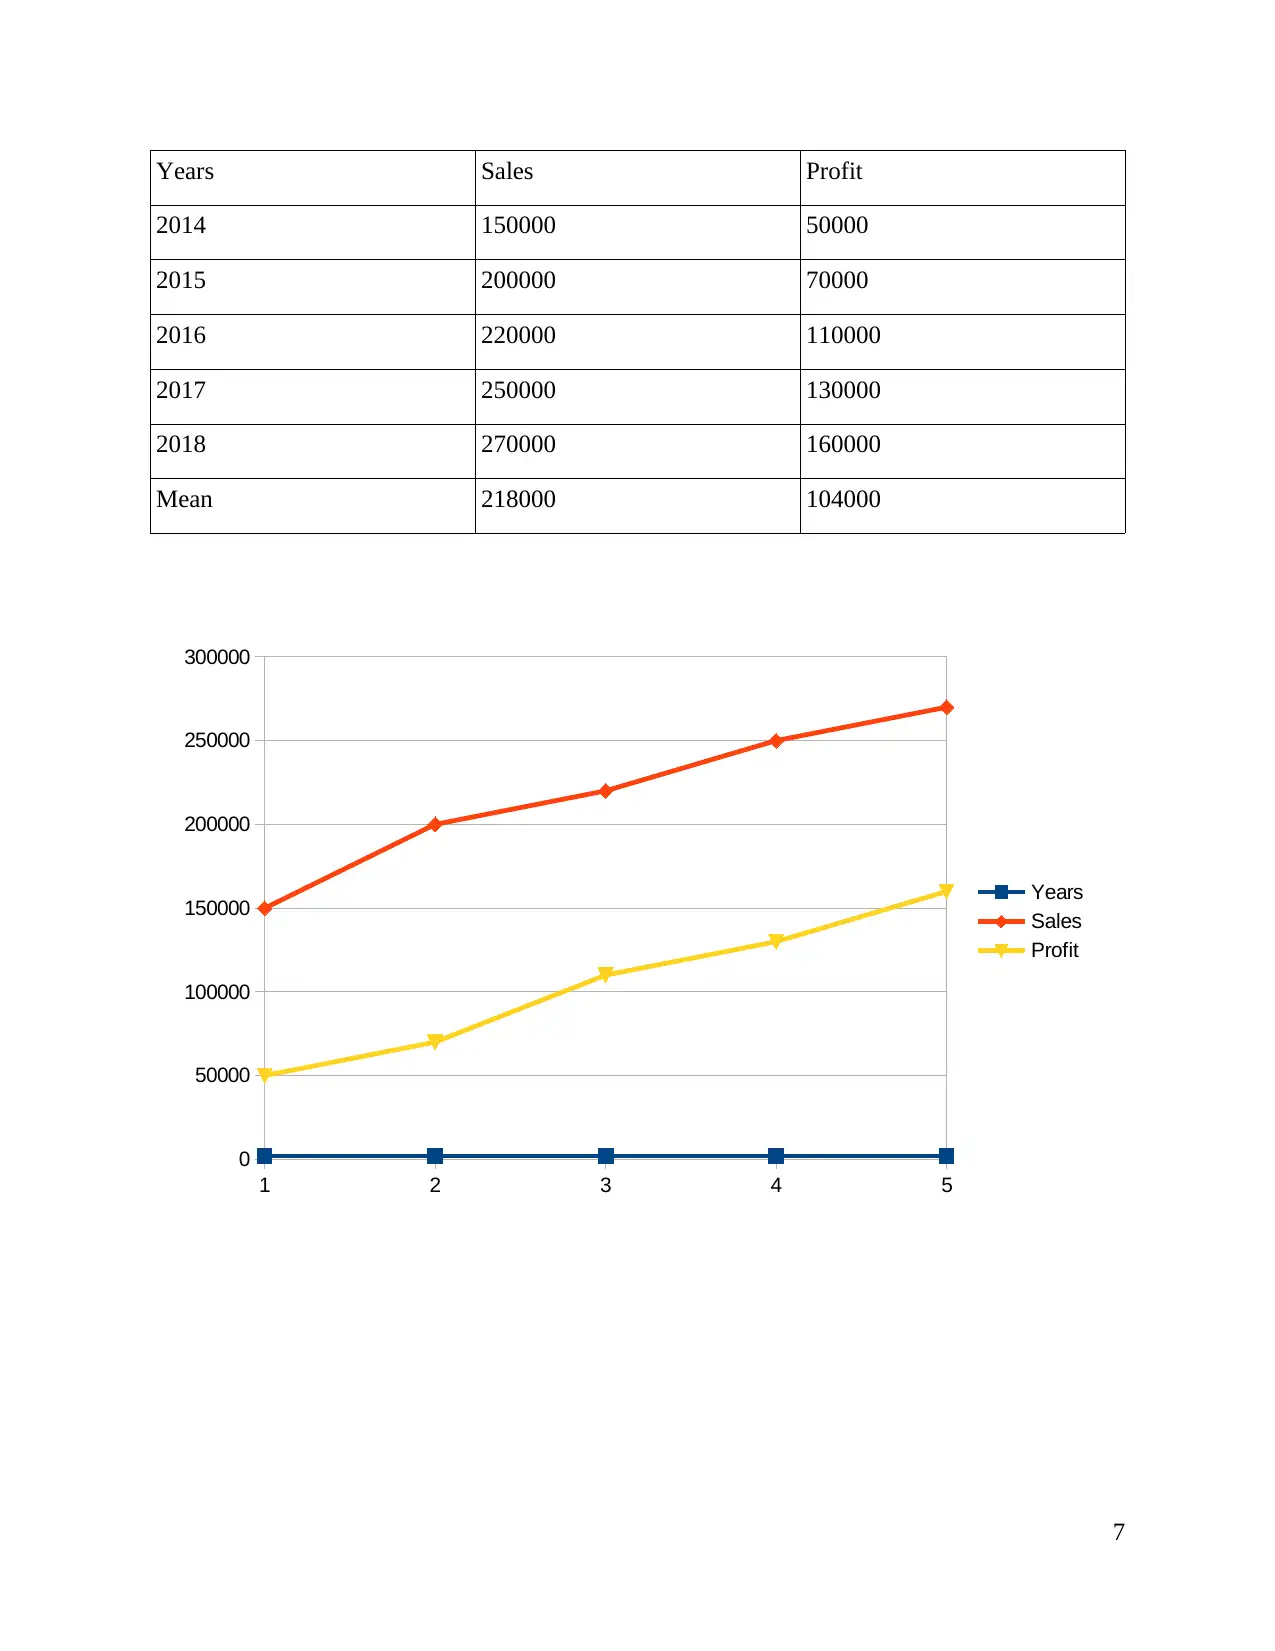
Years Sales Profit
2014 150000 50000
2015 200000 70000
2016 220000 110000
2017 250000 130000
2018 270000 160000
Mean 218000 104000
7
1 2 3 4 5
0
50000
100000
150000
200000
250000
300000
Years
Sales
Profit
2014 150000 50000
2015 200000 70000
2016 220000 110000
2017 250000 130000
2018 270000 160000
Mean 218000 104000
7
1 2 3 4 5
0
50000
100000
150000
200000
250000
300000
Years
Sales
Profit
⊘ This is a preview!⊘
Do you want full access?
Subscribe today to unlock all pages.
Trusted by 1+ million students worldwide
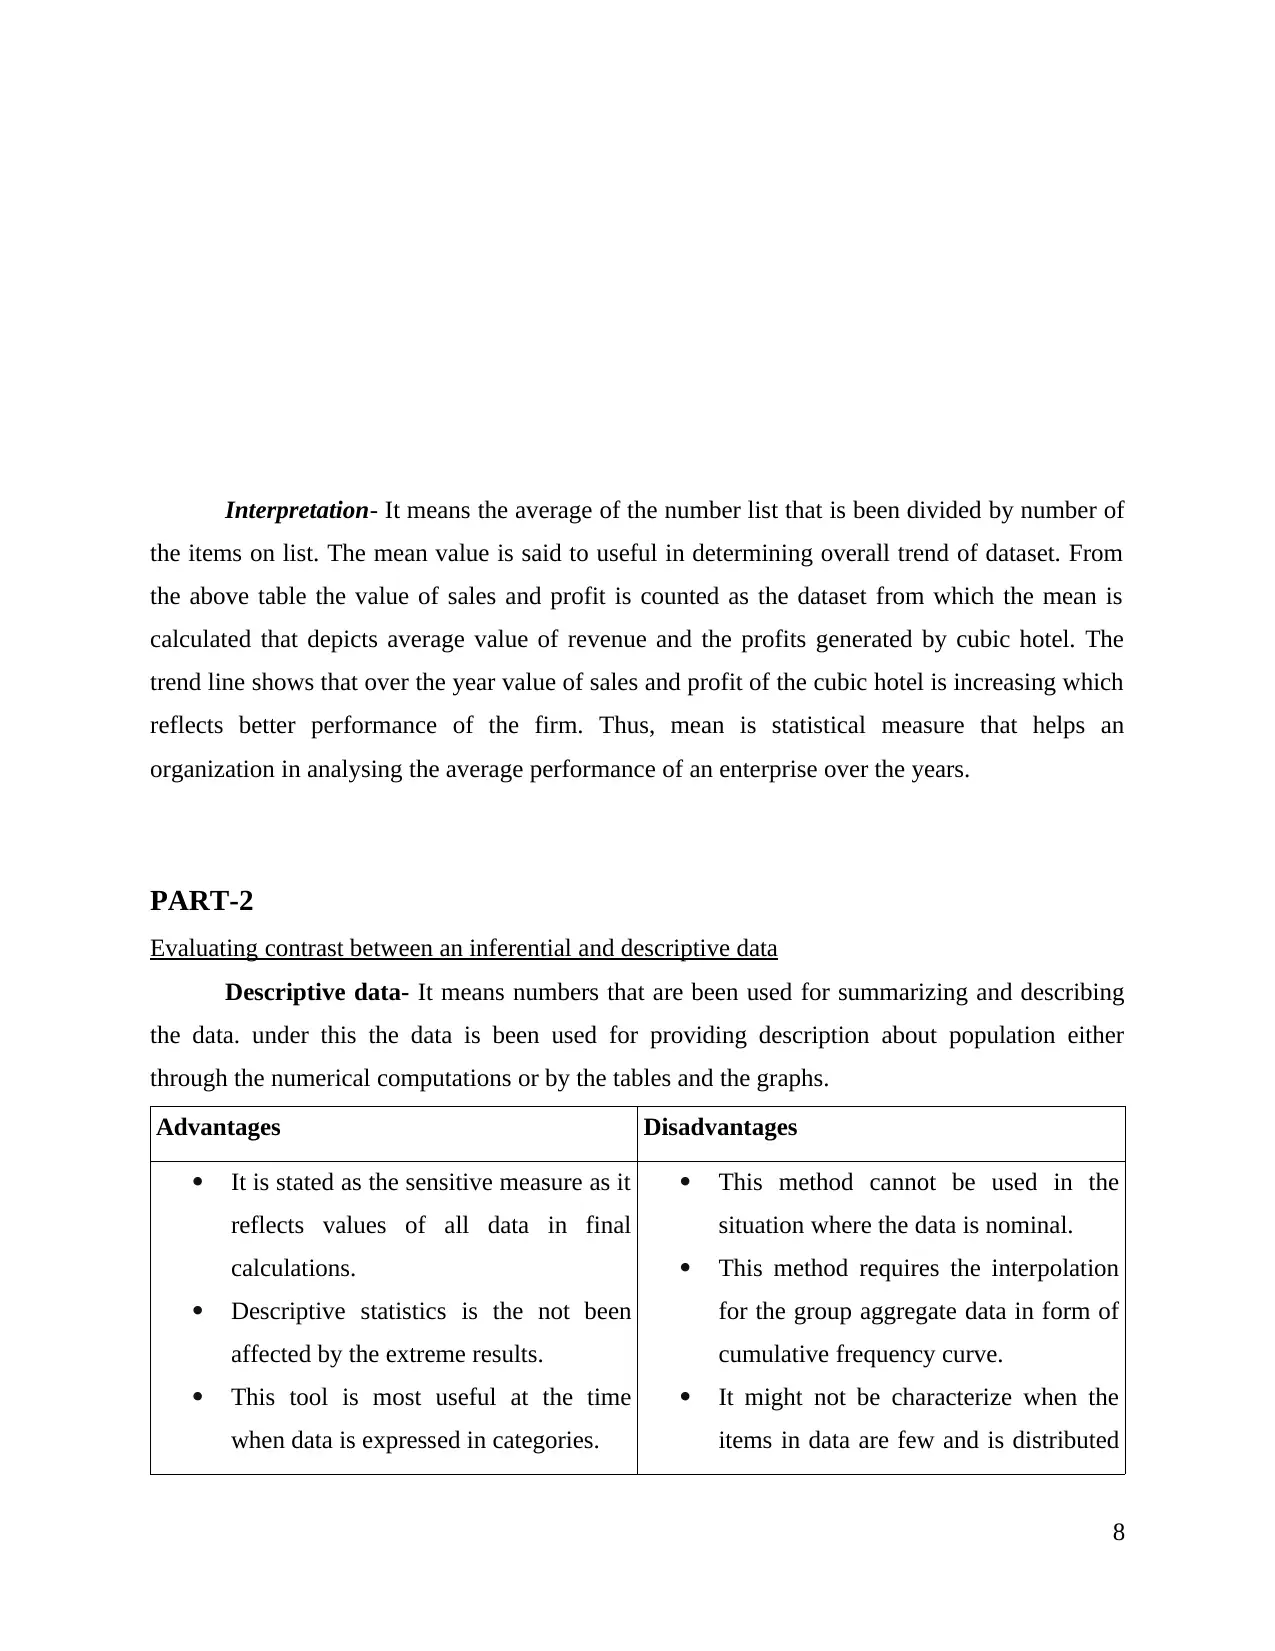
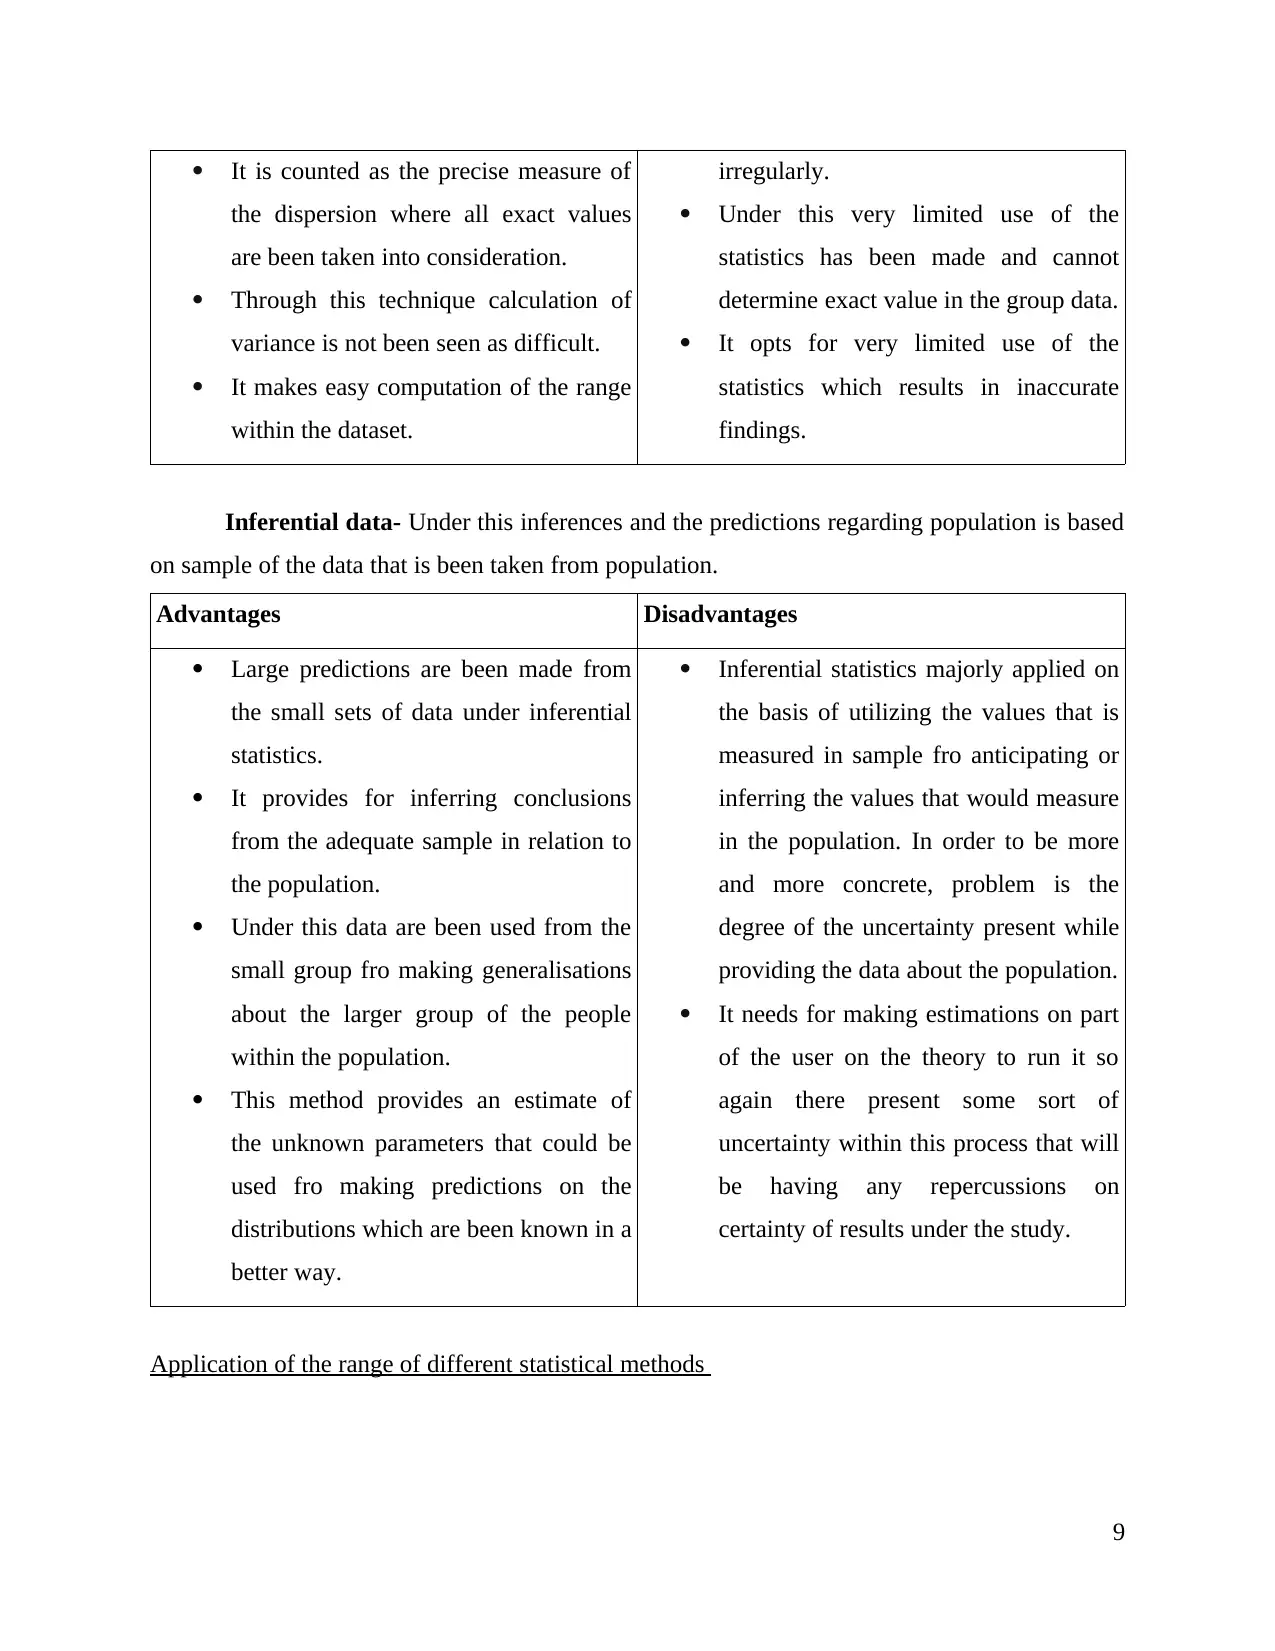
Interpretation- It means the average of the number list that is been divided by number of
the items on list. The mean value is said to useful in determining overall trend of dataset. From
the above table the value of sales and profit is counted as the dataset from which the mean is
calculated that depicts average value of revenue and the profits generated by cubic hotel. The
trend line shows that over the year value of sales and profit of the cubic hotel is increasing which
reflects better performance of the firm. Thus, mean is statistical measure that helps an
organization in analysing the average performance of an enterprise over the years.
PART-2
Evaluating contrast between an inferential and descriptive data
Descriptive data- It means numbers that are been used for summarizing and describing
the data. under this the data is been used for providing description about population either
through the numerical computations or by the tables and the graphs.
Advantages Disadvantages
It is stated as the sensitive measure as it
reflects values of all data in final
calculations.
Descriptive statistics is the not been
affected by the extreme results.
This tool is most useful at the time
when data is expressed in categories.
This method cannot be used in the
situation where the data is nominal.
This method requires the interpolation
for the group aggregate data in form of
cumulative frequency curve.
It might not be characterize when the
items in data are few and is distributed
8
Paraphrase This Document
Need a fresh take? Get an instant paraphrase of this document with our AI Paraphraser
It is counted as the precise measure of
the dispersion where all exact values
are been taken into consideration.
Through this technique calculation of
variance is not been seen as difficult.
It makes easy computation of the range
within the dataset.
irregularly.
Under this very limited use of the
statistics has been made and cannot
determine exact value in the group data.
It opts for very limited use of the
statistics which results in inaccurate
findings.
Inferential data- Under this inferences and the predictions regarding population is based
on sample of the data that is been taken from population.
Advantages Disadvantages
Large predictions are been made from
the small sets of data under inferential
statistics.
It provides for inferring conclusions
from the adequate sample in relation to
the population.
Under this data are been used from the
small group fro making generalisations
about the larger group of the people
within the population.
This method provides an estimate of
the unknown parameters that could be
used fro making predictions on the
distributions which are been known in a
better way.
Inferential statistics majorly applied on
the basis of utilizing the values that is
measured in sample fro anticipating or
inferring the values that would measure
in the population. In order to be more
and more concrete, problem is the
degree of the uncertainty present while
providing the data about the population.
It needs for making estimations on part
of the user on the theory to run it so
again there present some sort of
uncertainty within this process that will
be having any repercussions on
certainty of results under the study.
Application of the range of different statistical methods
9
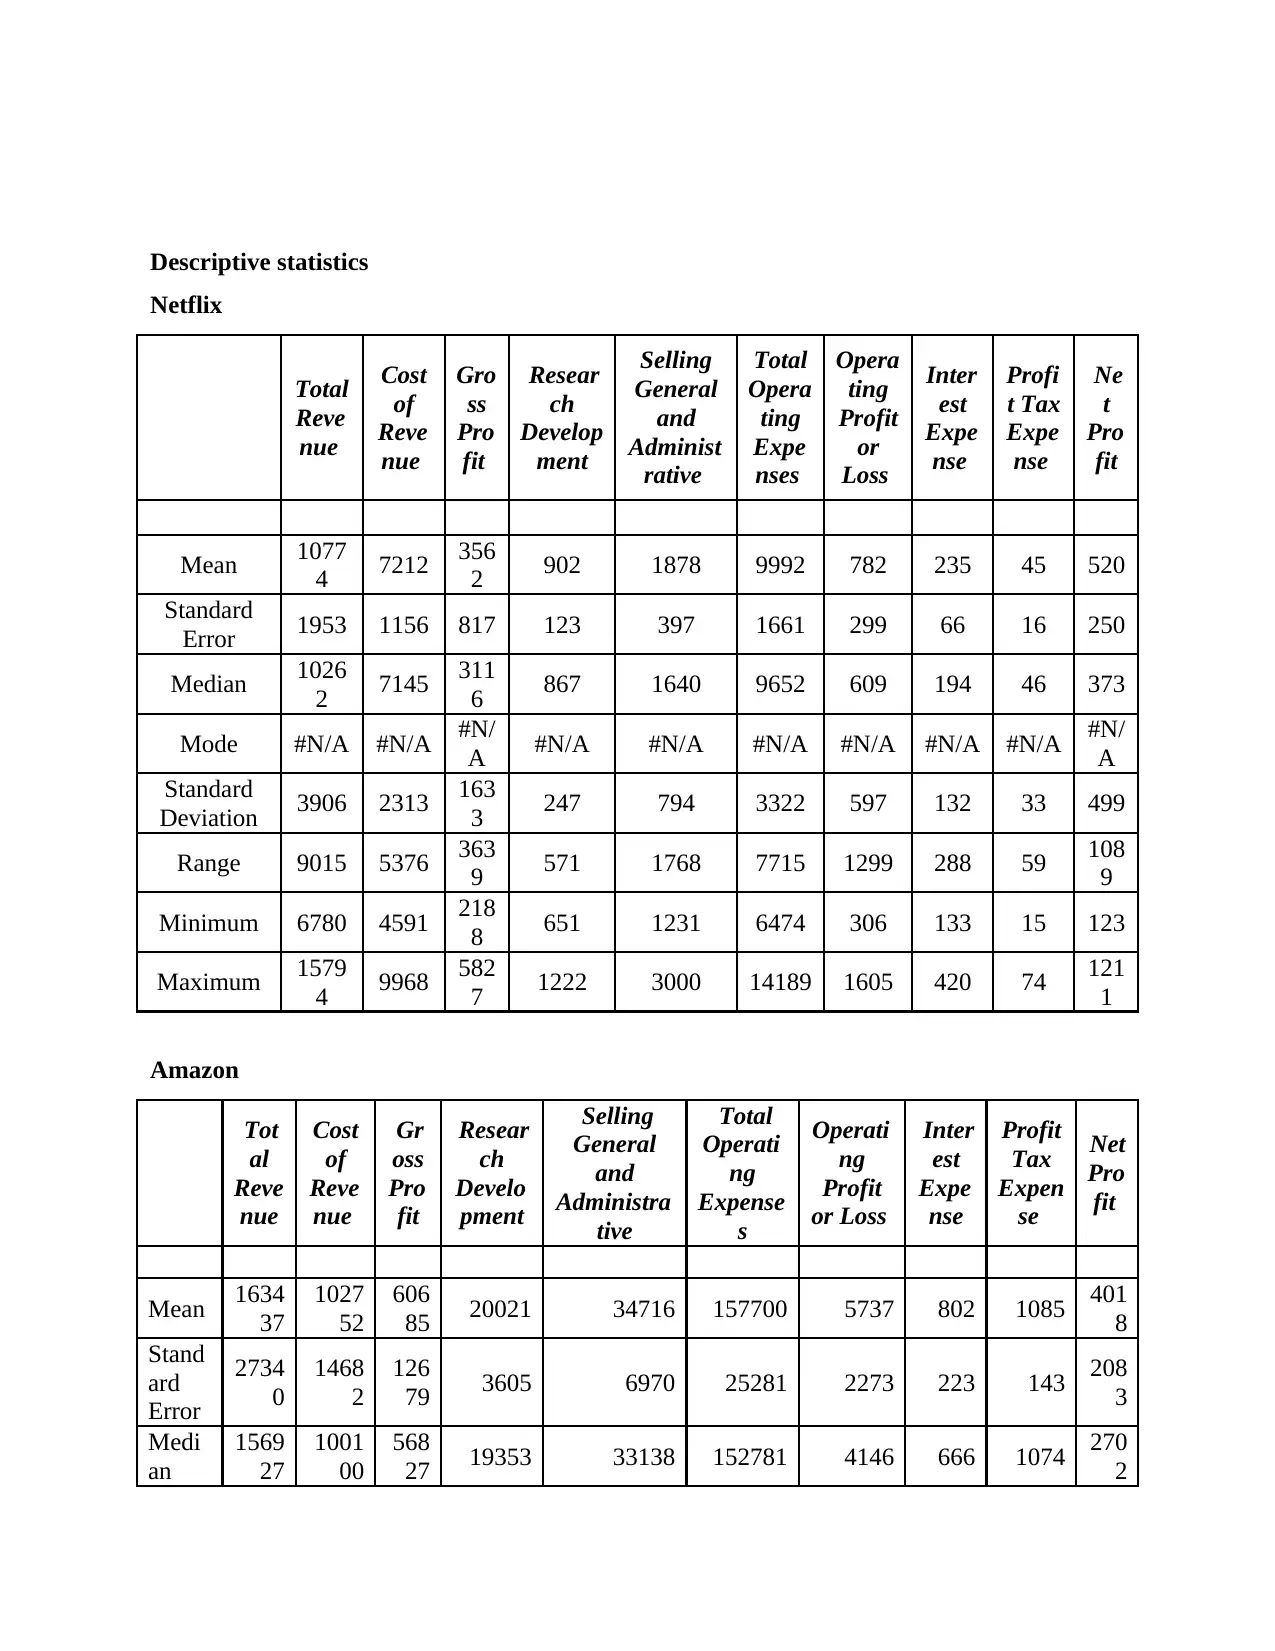
Descriptive statistics
Netflix
Total
Reve
nue
Cost
of
Reve
nue
Gro
ss
Pro
fit
Resear
ch
Develop
ment
Selling
General
and
Administ
rative
Total
Opera
ting
Expe
nses
Opera
ting
Profit
or
Loss
Inter
est
Expe
nse
Profi
t Tax
Expe
nse
Ne
t
Pro
fit
Mean 1077
4 7212 356
2 902 1878 9992 782 235 45 520
Standard
Error 1953 1156 817 123 397 1661 299 66 16 250
Median 1026
2 7145 311
6 867 1640 9652 609 194 46 373
Mode #N/A #N/A #N/
A #N/A #N/A #N/A #N/A #N/A #N/A #N/
A
Standard
Deviation 3906 2313 163
3 247 794 3322 597 132 33 499
Range 9015 5376 363
9 571 1768 7715 1299 288 59 108
9
Minimum 6780 4591 218
8 651 1231 6474 306 133 15 123
Maximum 1579
4 9968 582
7 1222 3000 14189 1605 420 74 121
1
Amazon
Tot
al
Reve
nue
Cost
of
Reve
nue
Gr
oss
Pro
fit
Resear
ch
Develo
pment
Selling
General
and
Administra
tive
Total
Operati
ng
Expense
s
Operati
ng
Profit
or Loss
Inter
est
Expe
nse
Profit
Tax
Expen
se
Net
Pro
fit
Mean 1634
37
1027
52
606
85 20021 34716 157700 5737 802 1085 401
8
Stand
ard
Error
2734
0
1468
2
126
79 3605 6970 25281 2273 223 143 208
3
Medi
an
1569
27
1001
00
568
27 19353 33138 152781 4146 666 1074 270
2
⊘ This is a preview!⊘
Do you want full access?
Subscribe today to unlock all pages.
Trusted by 1+ million students worldwide
1 out of 19
Related Documents


Your All-in-One AI-Powered Toolkit for Academic Success.
+13062052269
info@desklib.com
Available 24*7 on WhatsApp / Email
![[object Object]](/_next/static/media/star-bottom.7253800d.svg)
Unlock your academic potential
Copyright © 2020–2025 A2Z Services. All Rights Reserved. Developed and managed by ZUCOL.