University **** Big Data Analysis Project: Algorithm Performance
VerifiedAdded on 2022/11/24
|41
|2948
|215
Project
AI Summary
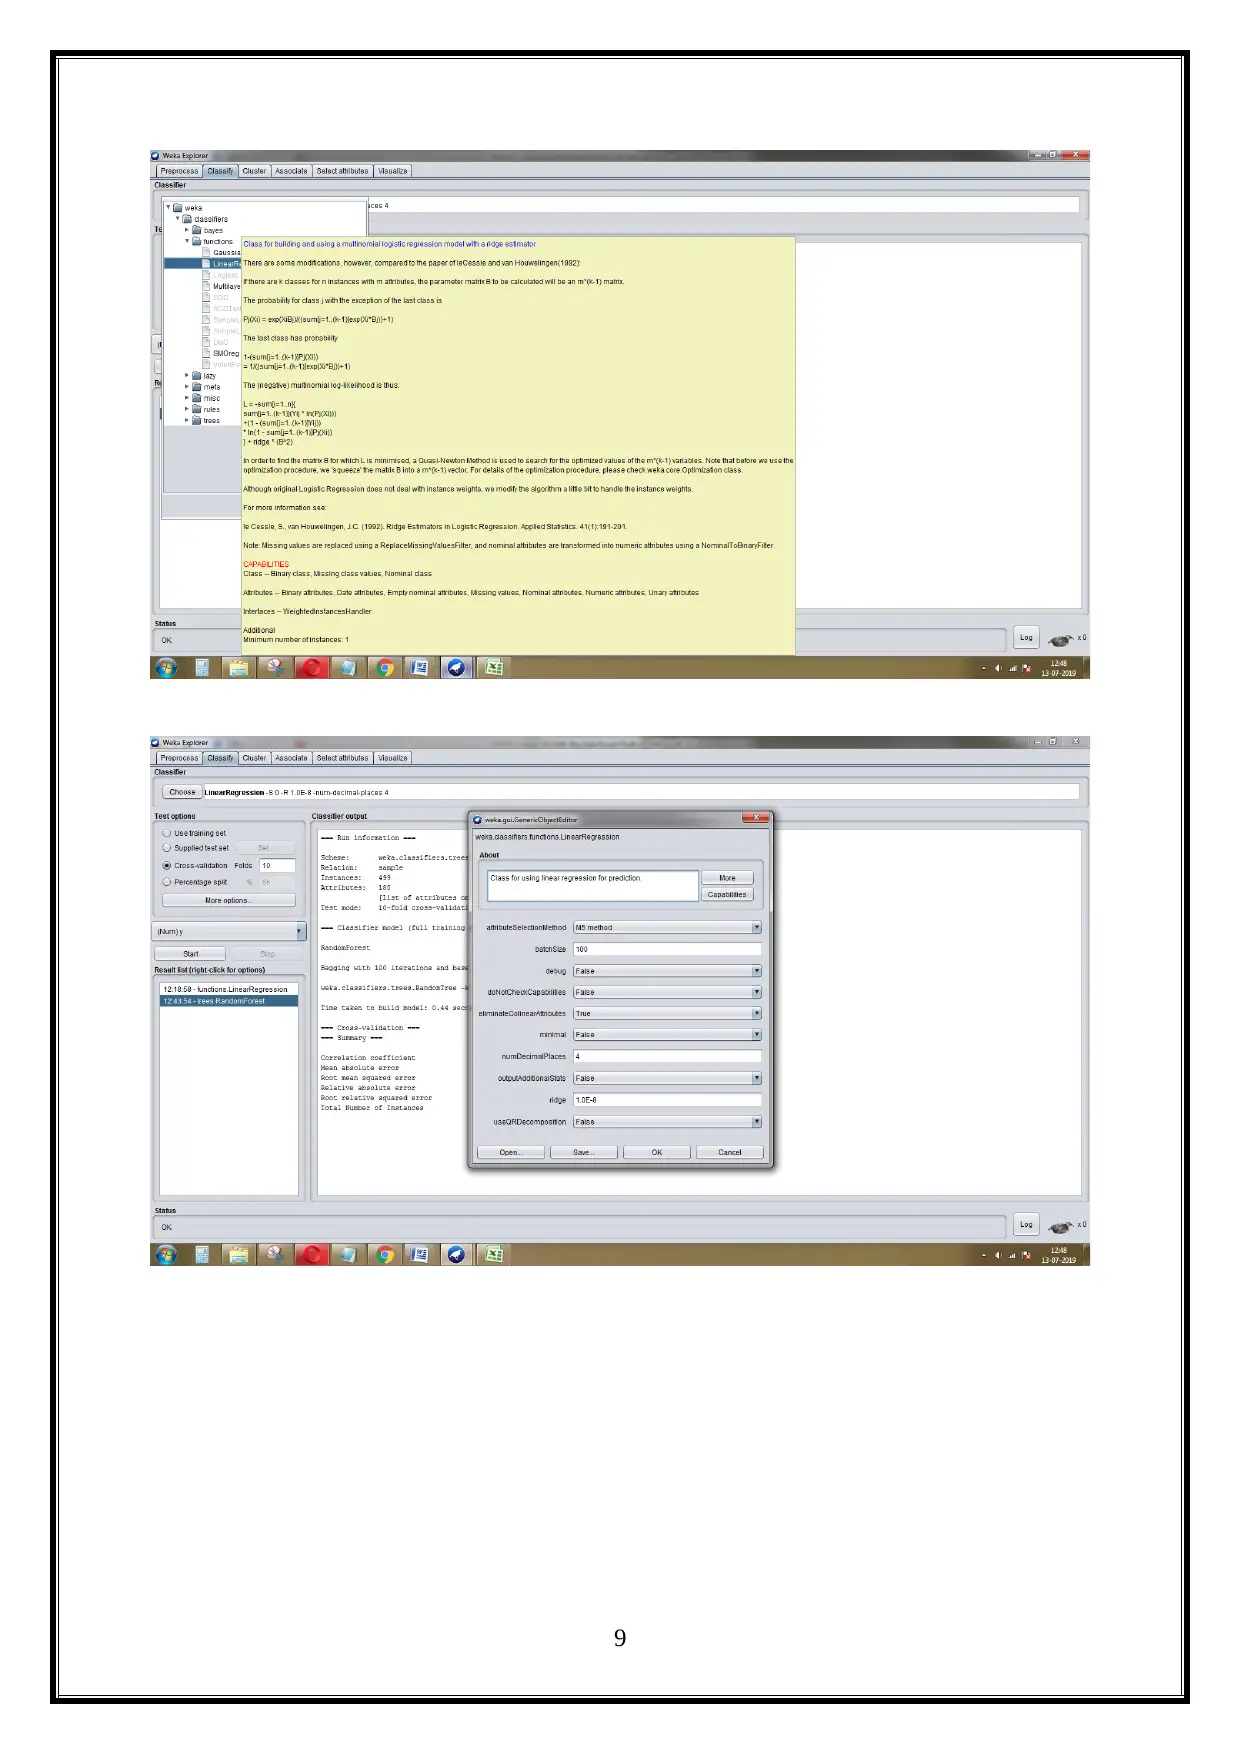
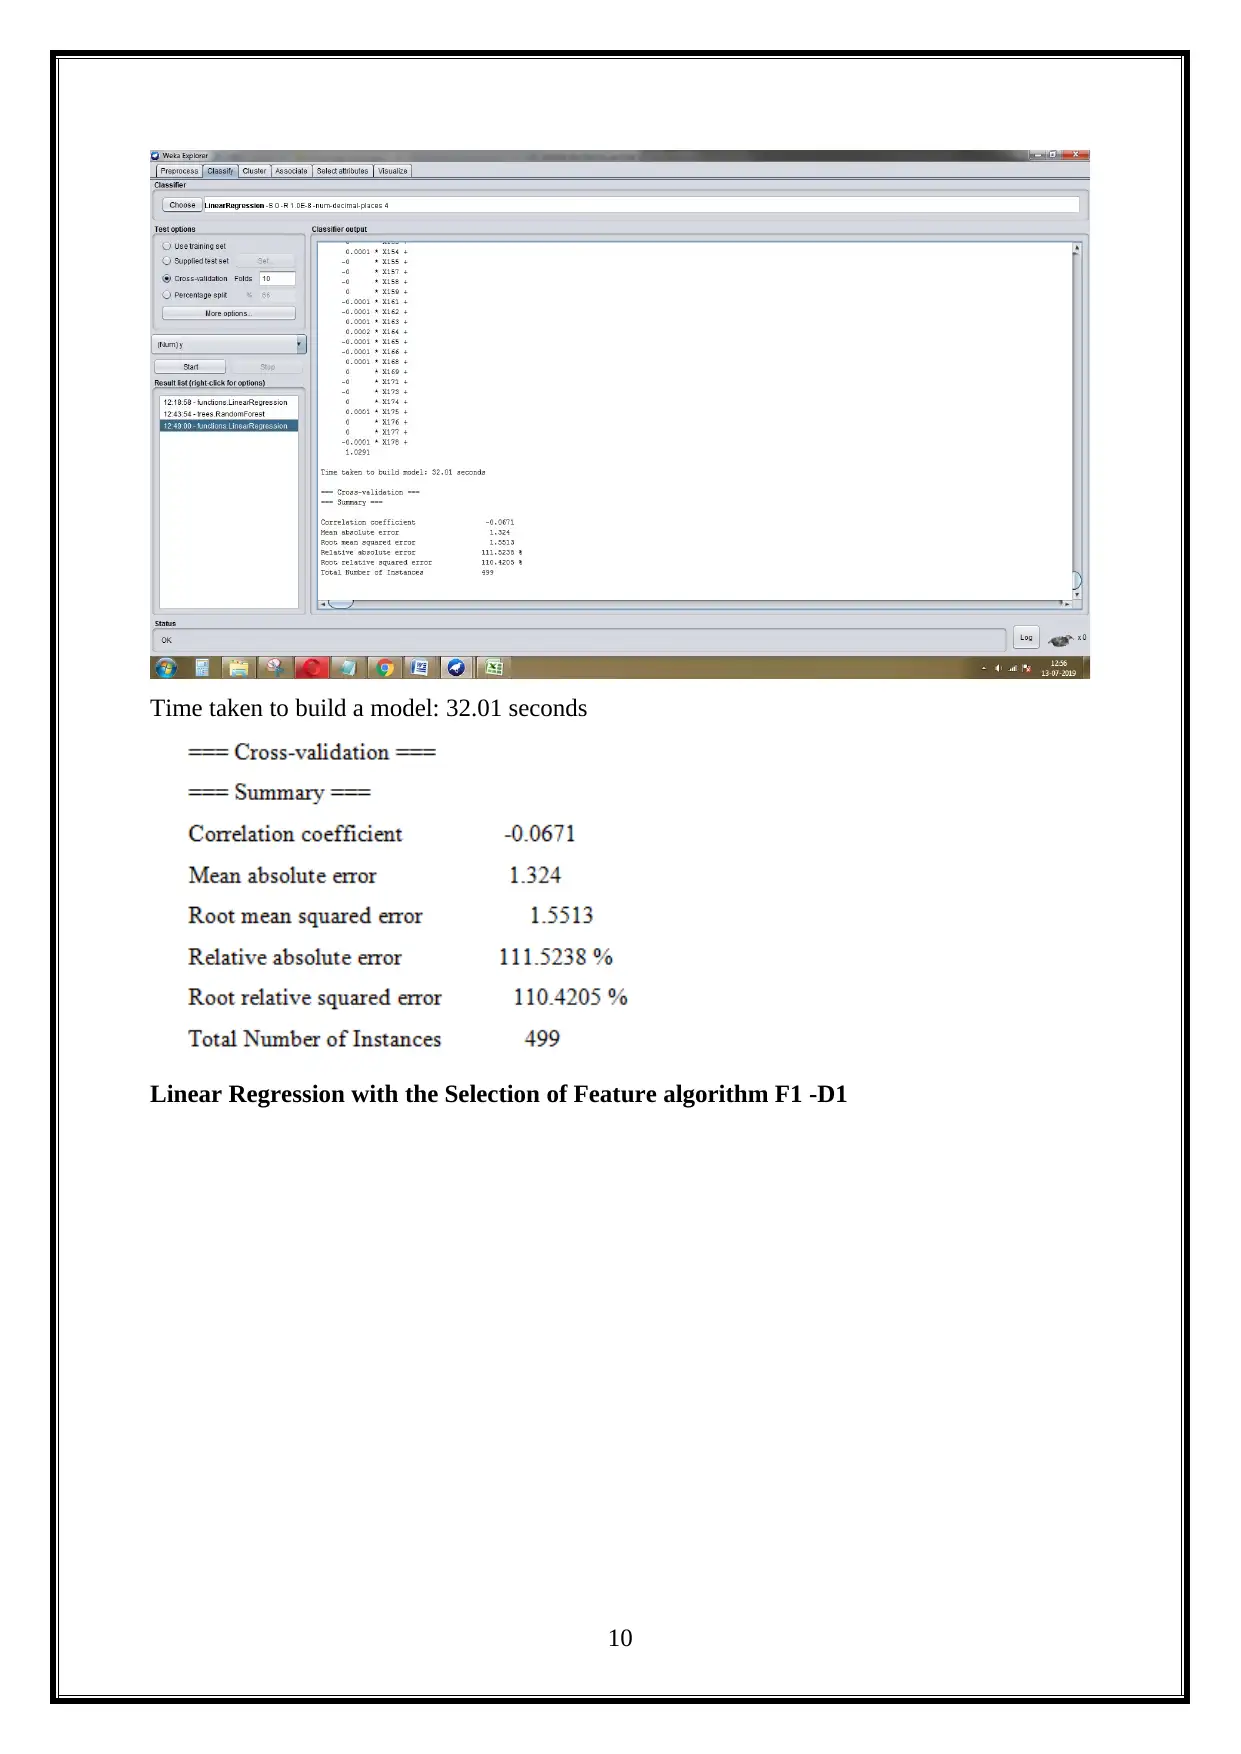
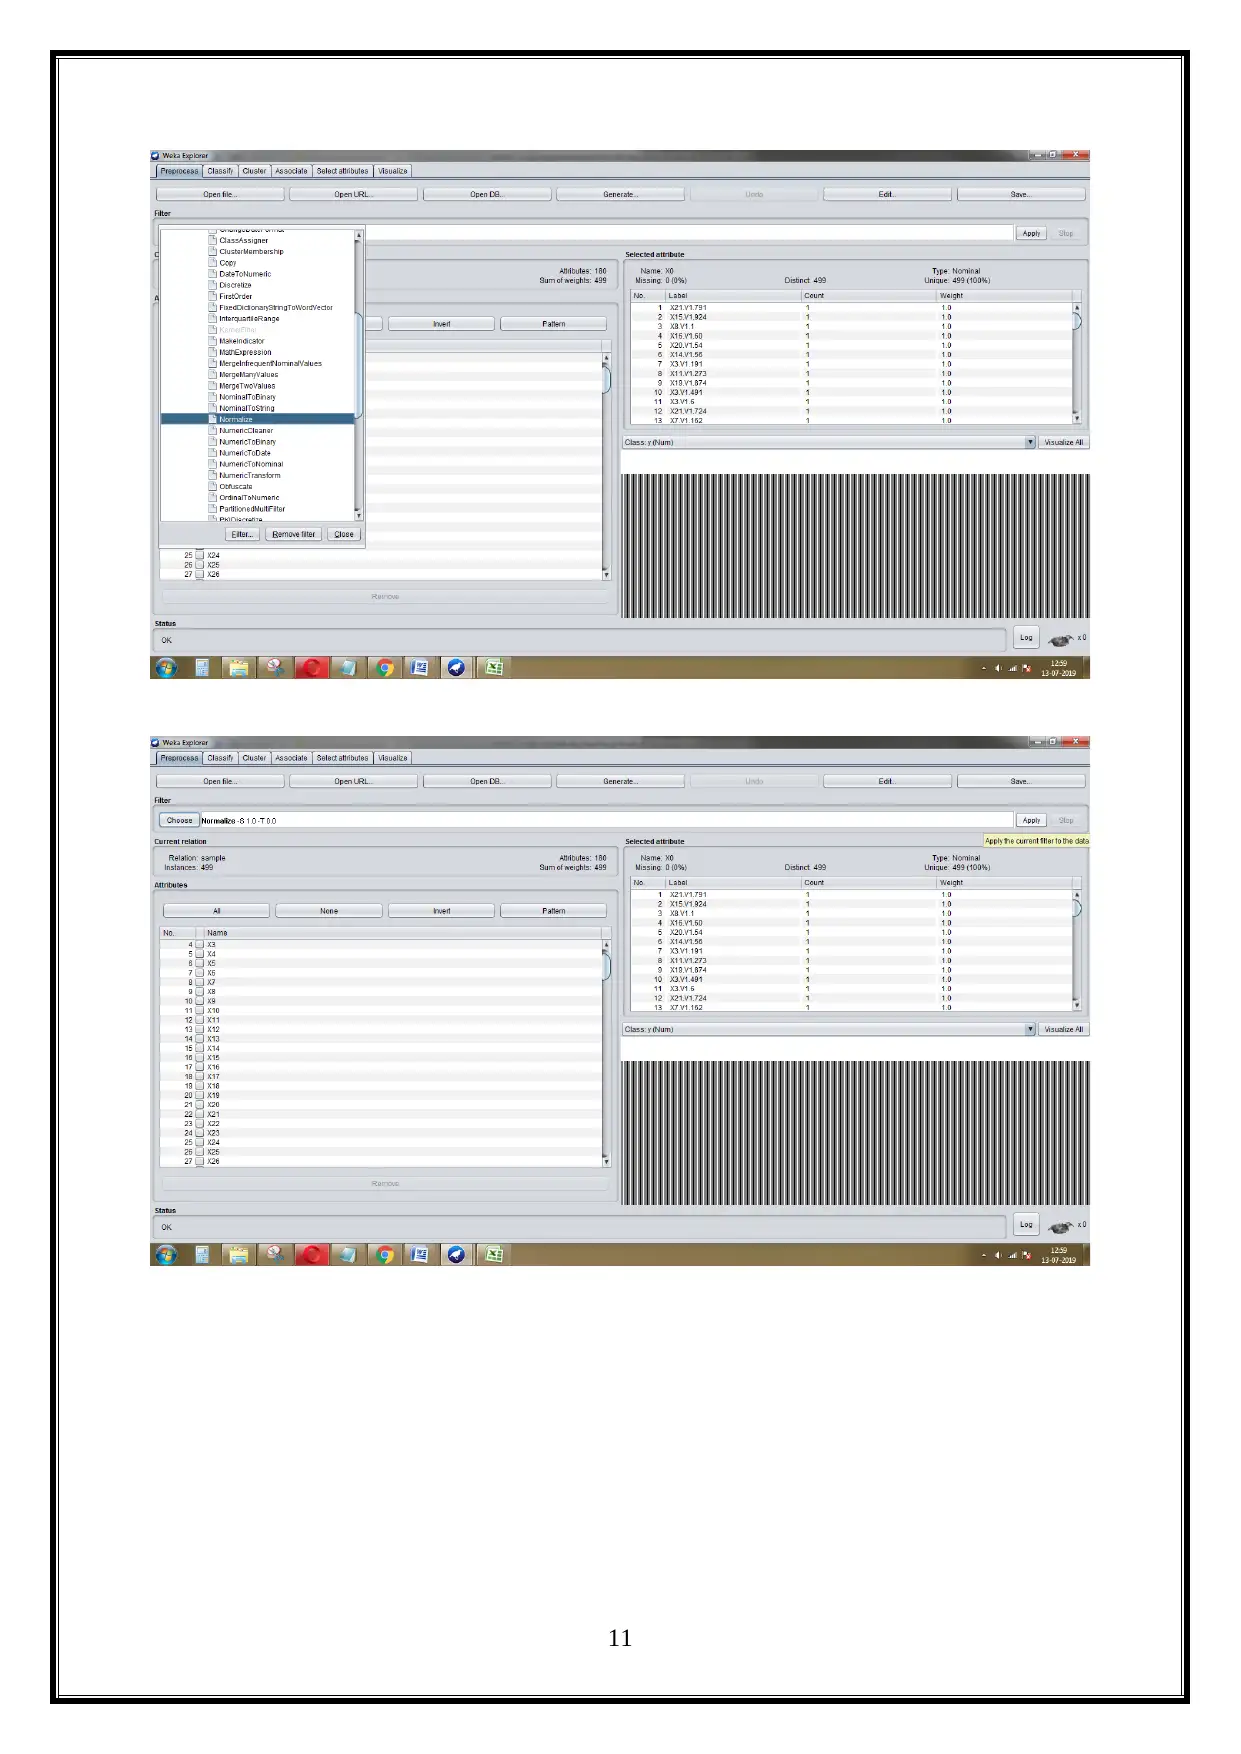
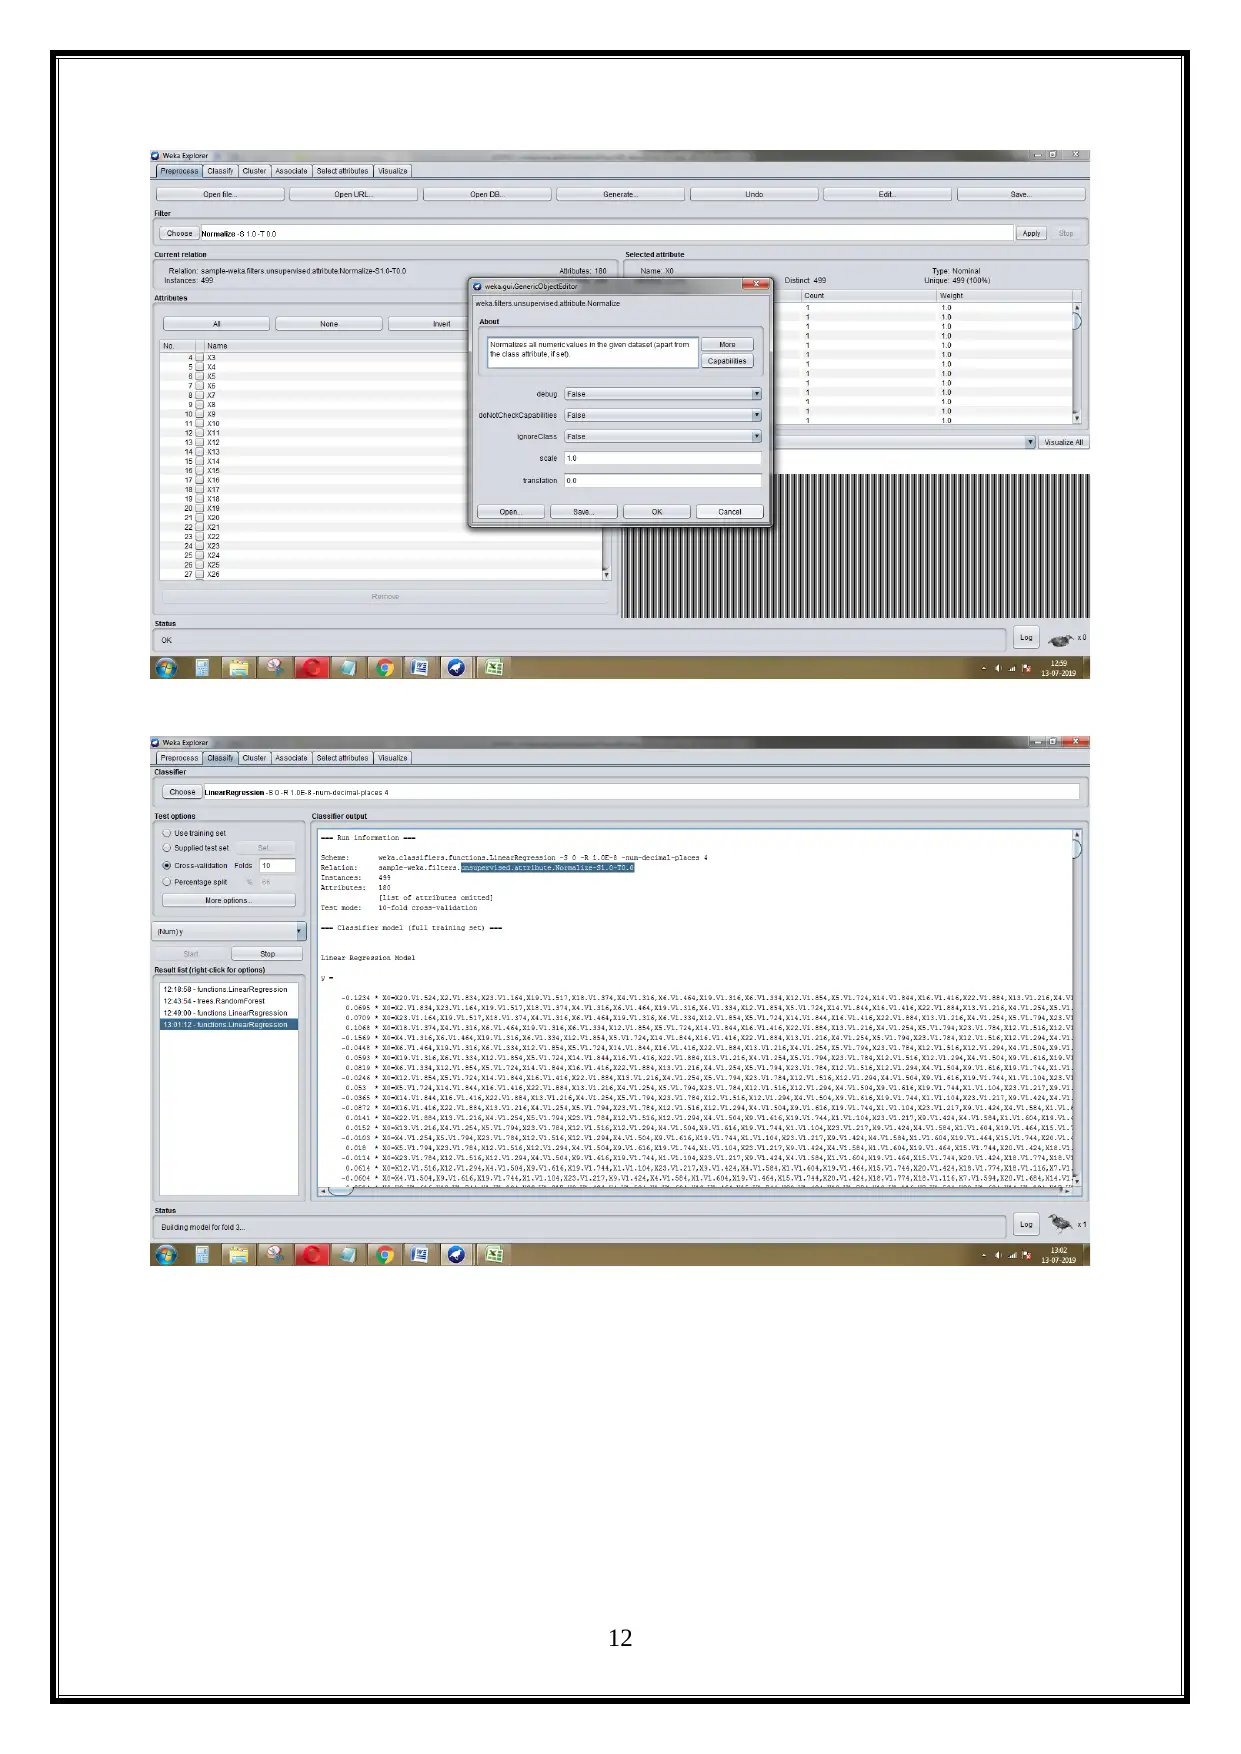
This project evaluates the performance of machine learning algorithms, specifically Linear Regression and Random Forest, using the Weka data mining software. The project utilizes two datasets: an Epileptic Seizure Recognition dataset and a Train and test dataset. The study involves comparing the algorithms across various experimental setups, including different feature selection methods. The experimental setups involve comparing Linear Regression and Random Forest algorithms with and without feature selection algorithms. The results are presented with various metrics like correlation coefficient, mean absolute error, root absolute error, and root relative squared error. Furthermore, the project includes a discussion of the results, a significance test on Dataset 1, AUC curve analysis, and a critical understanding of big data analysis challenges and implications. The project concludes with a comparison of the significance tests on both datasets, and the analysis of the AUC curve based on the classification algorithm.
1 out of 41
Your All-in-One AI-Powered Toolkit for Academic Success.
+13062052269
info@desklib.com
Available 24*7 on WhatsApp / Email
![[object Object]](/_next/static/media/star-bottom.7253800d.svg)
Copyright © 2020–2025 A2Z Services. All Rights Reserved. Developed and managed by ZUCOL.