University Graduate Employment Status: Statistical Report

Verified

Added on  2023/06/04

|7
|1009
|303
Report
AI Summary
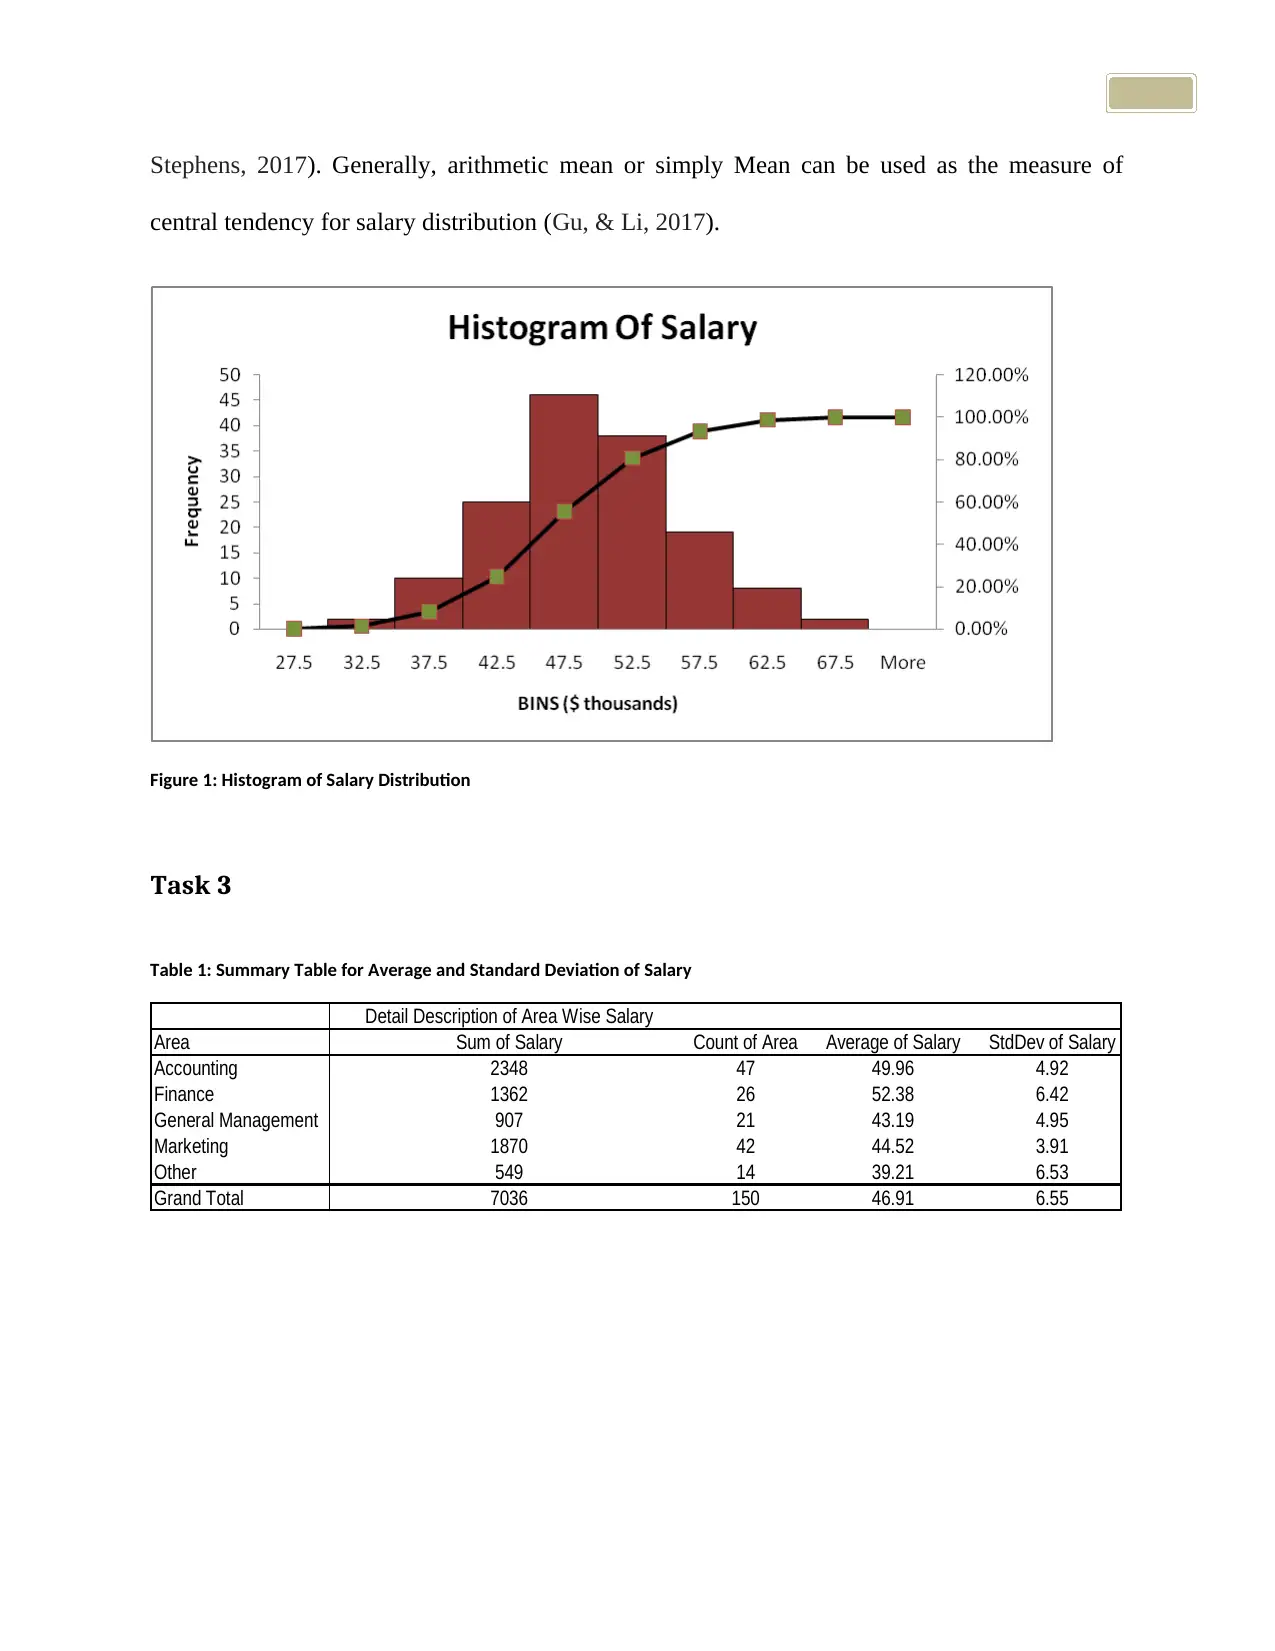
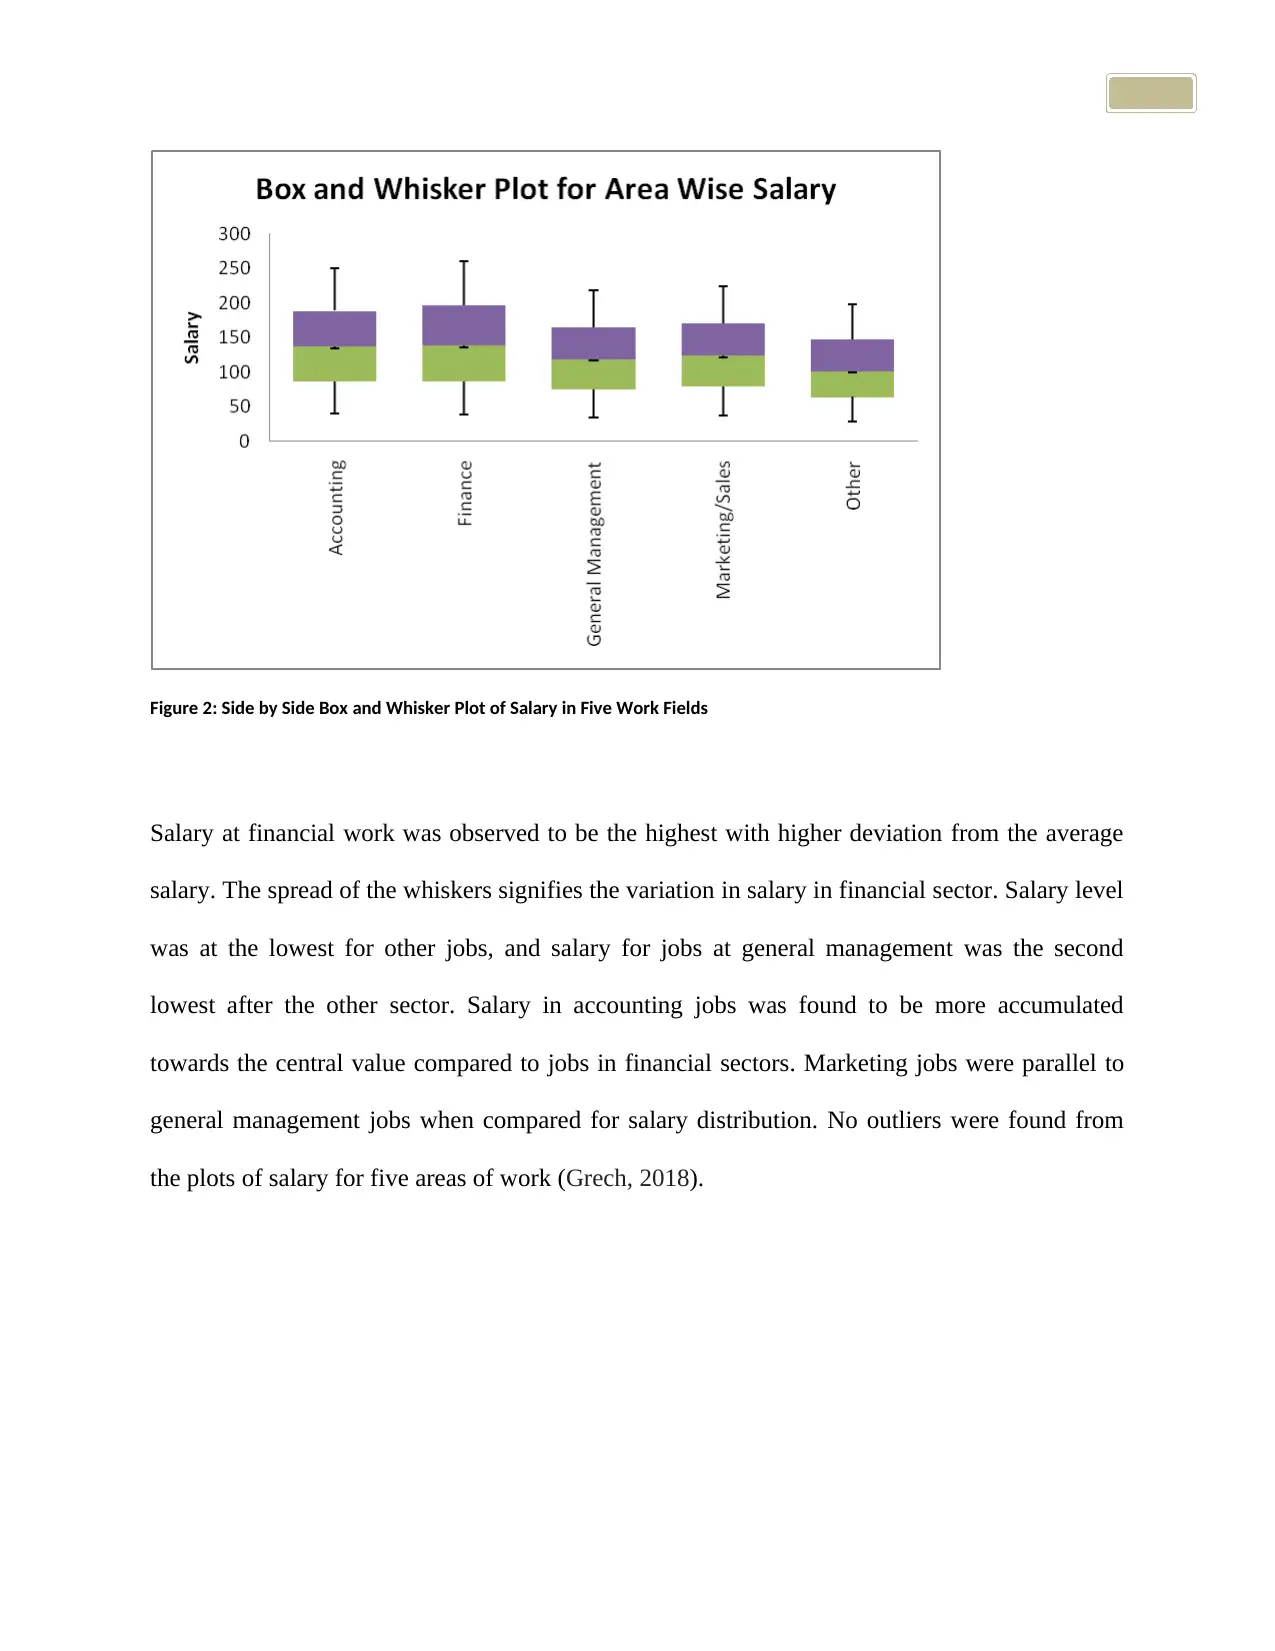
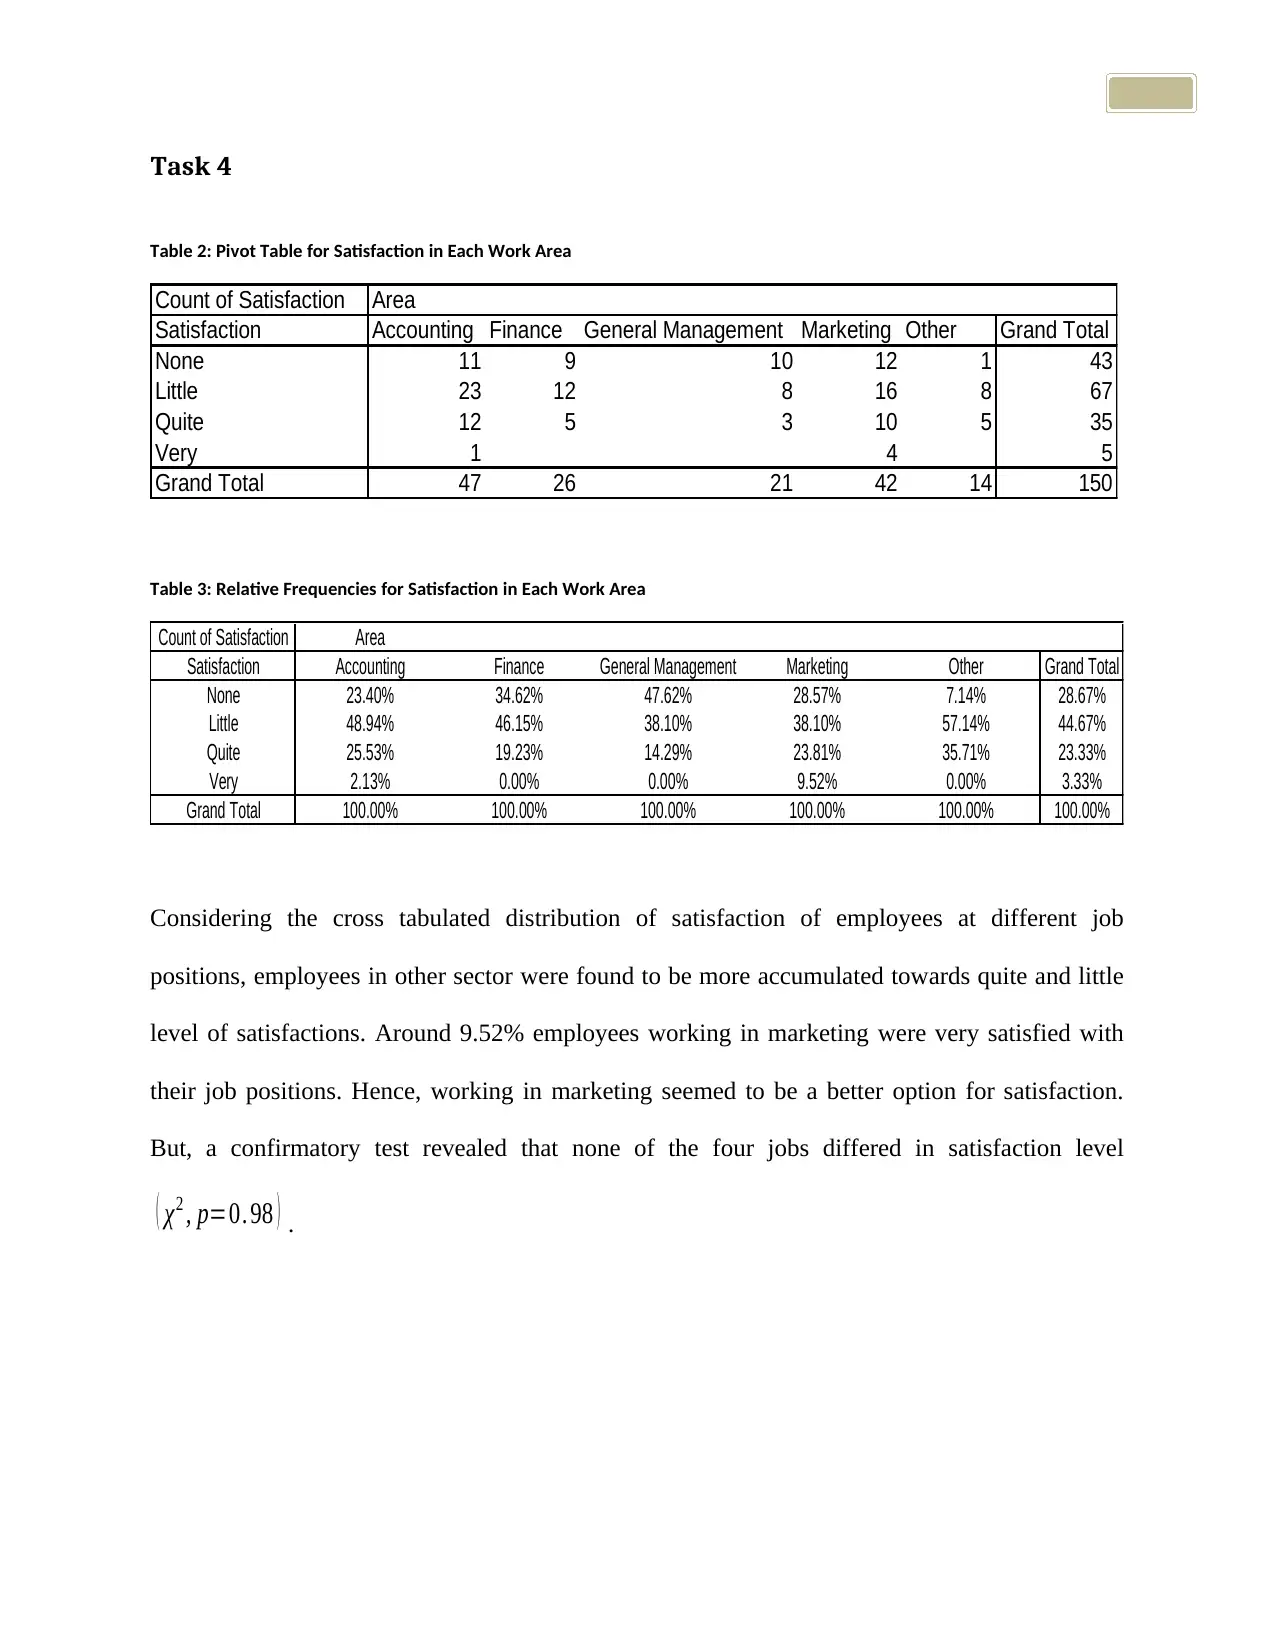
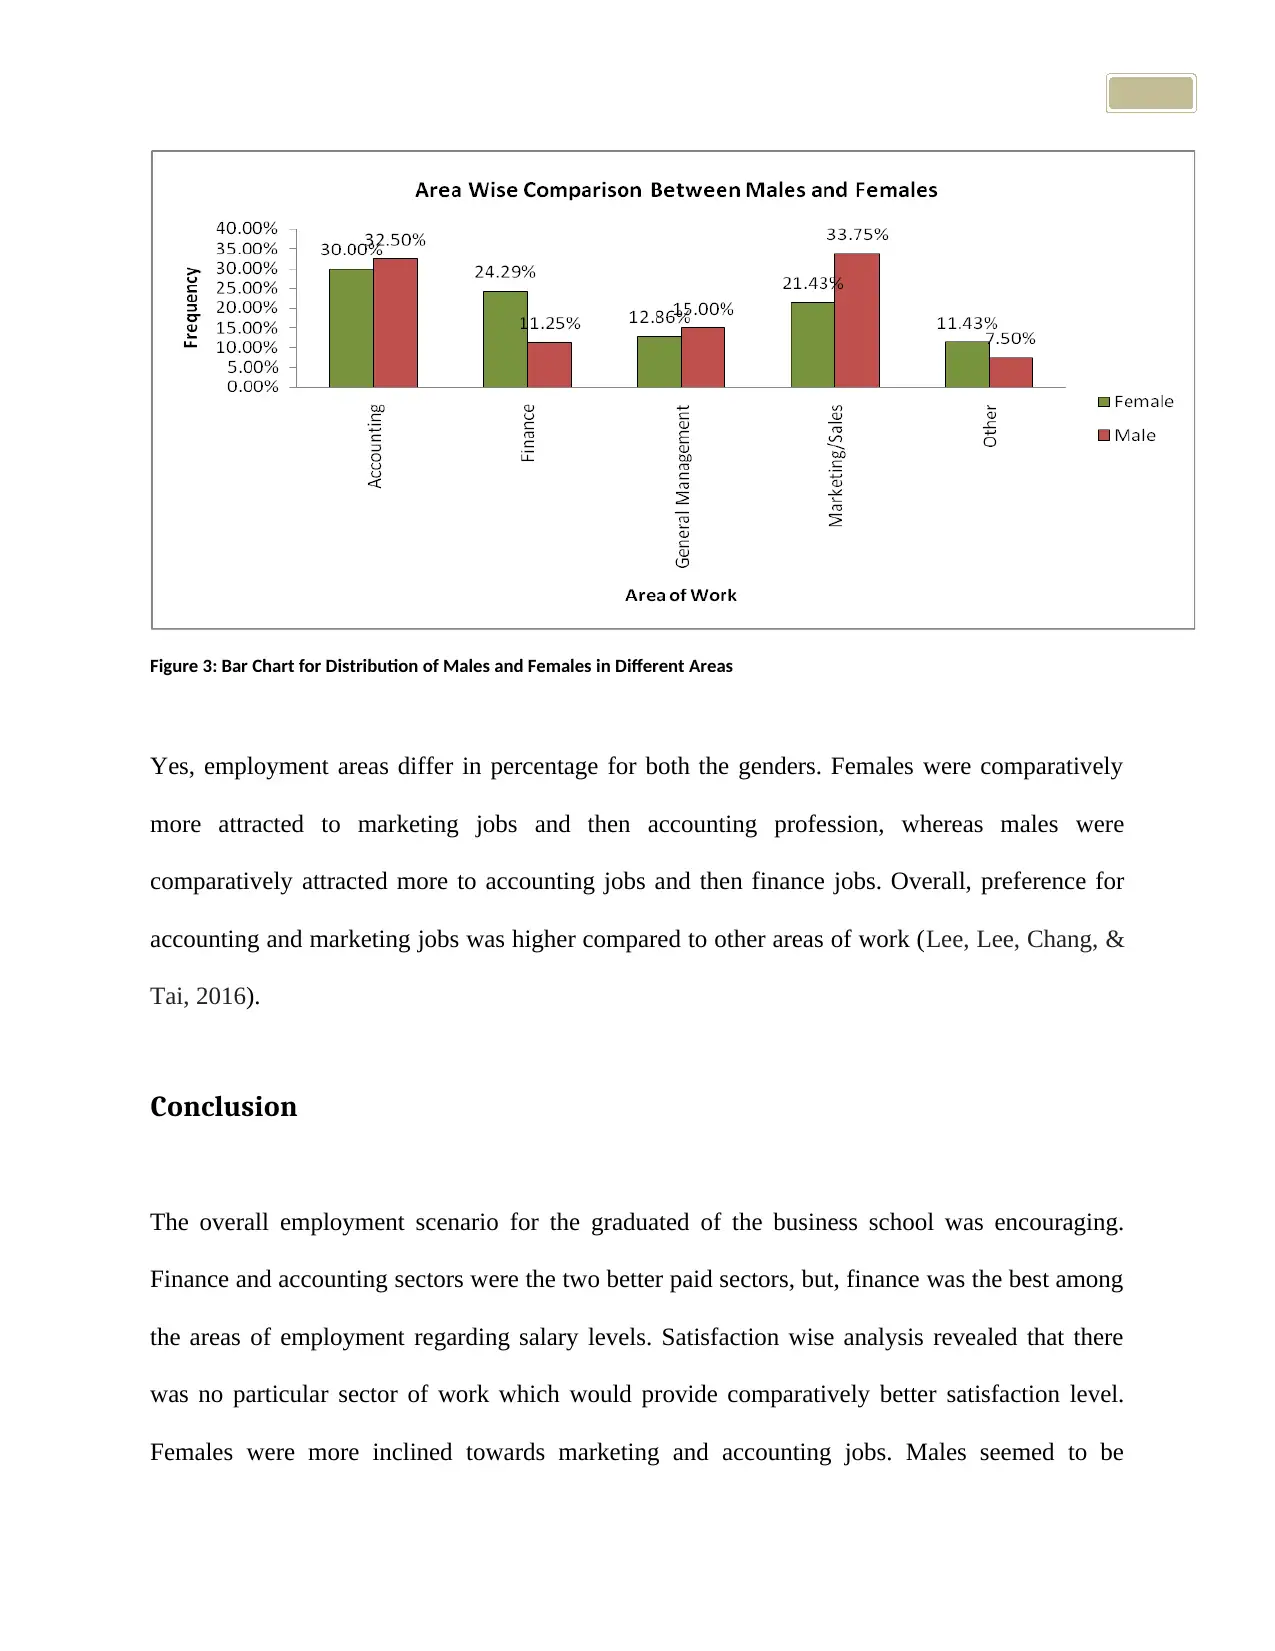
This report presents a statistical analysis of the employment status of university graduates, based on a survey of 150 students. The study explores several variables, including area of work, job satisfaction, gender, job search duration, and salary. The analysis includes descriptive statistics, such as mean, median, and standard deviation for salary distribution, and visual representations like histograms and box plots. The report investigates the relationship between salary and employment areas, with finance and accounting sectors showing higher salaries. Job satisfaction levels are examined across different sectors, revealing that marketing jobs were associated with higher satisfaction. Gender-based employment preferences are also analyzed, highlighting differences in the attraction of males and females towards different sectors. The report concludes with an overview of the employment scenario for business school graduates, emphasizing the importance of finance and accounting sectors for salary, and the absence of a specific sector for better satisfaction levels.
Document Page
Employment Staus of University Graduates – An Exploratory Study
tabler-icon-diamond-filled.svg

Paraphrase This Document

Need a fresh take? Get an instant paraphrase of this document with our AI Paraphraser
Document Page
Introduction
University graduates are getting jobs at different positions in the company. In the present study,
salary, job satisfaction, and area of employment has been explored to acquire an idea about the
entire scenario. The scholar randomly selected data for 150 students along with description of
their current job status.
Data Exploration
Task 1
There were five variables in the collected sample data. Area of work, Satisfaction level at work,
and Gender were qualitative variables. Area of employment and gender were nominal variables,
whereas Satisfaction level was ordinal variable. Number of weeks of job searching (Search) and
Salary ($ thousands) were quantitative variables. Search was a discrete variable, and Salary was
continuous in nature.
Task 2
Distribution of salaries has been represented in the following histogram. The shape of the
histogram was almost normal in nature. The shape of the cumulative distribution curve was also
of the shape of cumulative normal curve. No outliers were noticed in the representation of the
data (histogram). Mean and Median for normal distribution coincide, hence, either Mean or
Median can be used as a measure of central tendency for salary distribution (Spiegel, &
Document Page
Stephens, 2017). Generally, arithmetic mean or simply Mean can be used as the measure of
central tendency for salary distribution (Gu, & Li, 2017).
Figure 1: Histogram of Salary Distribution
Task 3
Table 1: Summary Table for Average and Standard Deviation of Salary
Detail Description of Area Wise Salary
Area Sum of Salary Count of Area Average of Salary StdDev of Salary
Accounting 2348 47 49.96 4.92
Finance 1362 26 52.38 6.42
General Management 907 21 43.19 4.95
Marketing 1870 42 44.52 3.91
Other 549 14 39.21 6.53
Grand Total 7036 150 46.91 6.55
Document Page
Figure 2: Side by Side Box and Whisker Plot of Salary in Five Work Fields
Salary at financial work was observed to be the highest with higher deviation from the average
salary. The spread of the whiskers signifies the variation in salary in financial sector. Salary level
was at the lowest for other jobs, and salary for jobs at general management was the second
lowest after the other sector. Salary in accounting jobs was found to be more accumulated
towards the central value compared to jobs in financial sectors. Marketing jobs were parallel to
general management jobs when compared for salary distribution. No outliers were found from
the plots of salary for five areas of work (Grech, 2018).
tabler-icon-diamond-filled.svg

Paraphrase This Document

Need a fresh take? Get an instant paraphrase of this document with our AI Paraphraser
Document Page
Task 4
Table 2: Pivot Table for Satisfaction in Each Work Area
Count of Satisfaction Area
Satisfaction Accounting Finance General Management Marketing Other Grand Total
None 11 9 10 12 1 43
Little 23 12 8 16 8 67
Quite 12 5 3 10 5 35
Very 1 4 5
Grand Total 47 26 21 42 14 150
Table 3: Relative Frequencies for Satisfaction in Each Work Area
Count of Satisfaction Area
Satisfaction Accounting Finance General Management Marketing Other Grand Total
None 23.40% 34.62% 47.62% 28.57% 7.14% 28.67%
Little 48.94% 46.15% 38.10% 38.10% 57.14% 44.67%
Quite 25.53% 19.23% 14.29% 23.81% 35.71% 23.33%
Very 2.13% 0.00% 0.00% 9.52% 0.00% 3.33%
Grand Total 100.00% 100.00% 100.00% 100.00% 100.00% 100.00%
Considering the cross tabulated distribution of satisfaction of employees at different job
positions, employees in other sector were found to be more accumulated towards quite and little
level of satisfactions. Around 9.52% employees working in marketing were very satisfied with
their job positions. Hence, working in marketing seemed to be a better option for satisfaction.
But, a confirmatory test revealed that none of the four jobs differed in satisfaction level
( χ2 , p=0. 98 ) .
Document Page
Figure 3: Bar Chart for Distribution of Males and Females in Different Areas
Yes, employment areas differ in percentage for both the genders. Females were comparatively
more attracted to marketing jobs and then accounting profession, whereas males were
comparatively attracted more to accounting jobs and then finance jobs. Overall, preference for
accounting and marketing jobs was higher compared to other areas of work (Lee, Lee, Chang, &
Tai, 2016).
Conclusion
The overall employment scenario for the graduated of the business school was encouraging.
Finance and accounting sectors were the two better paid sectors, but, finance was the best among
the areas of employment regarding salary levels. Satisfaction wise analysis revealed that there
was no particular sector of work which would provide comparatively better satisfaction level.
Females were more inclined towards marketing and accounting jobs. Males seemed to be
Document Page
interested in accounting sector followed by finance jobs. Salary for jobs at other sectors was
accumulated towards the central measure, which was comparatively less compared to other
areas.
References
Grech, V. (2018). WASP (Write a Scientific Paper) using Excel–5: Quartiles and standard
deviation. Early human development, 118, 56-60.
Gu, W., & Li, S. (2017). EXCEL Advanced Tips and Tricks: Filter, Data Sort, Pivot Table, and
Graphics.
Lee, C. F., Lee, J., Chang, J. R., & Tai, T. (2016). Essentials of Excel, Excel VBA, SAS and
Minitab for statistical and financial analyses. Springer.
Spiegel, M. R., & Stephens, L. J. (2017). Schaum's outline of statistics. McGraw Hill
Professional.
chevron_up_icon
1 out of 7
circle_padding
hide_on_mobile
zoom_out_icon