Understanding the Formation and Reconstruction of CT Projection Data in Medical Imaging
Added on 2023-04-24
7 Pages1490 Words377 Views
UNIVERSITY
NAME
ASSIGNMENT
Date
NAME
ASSIGNMENT
Date

Formation of CT Projection data
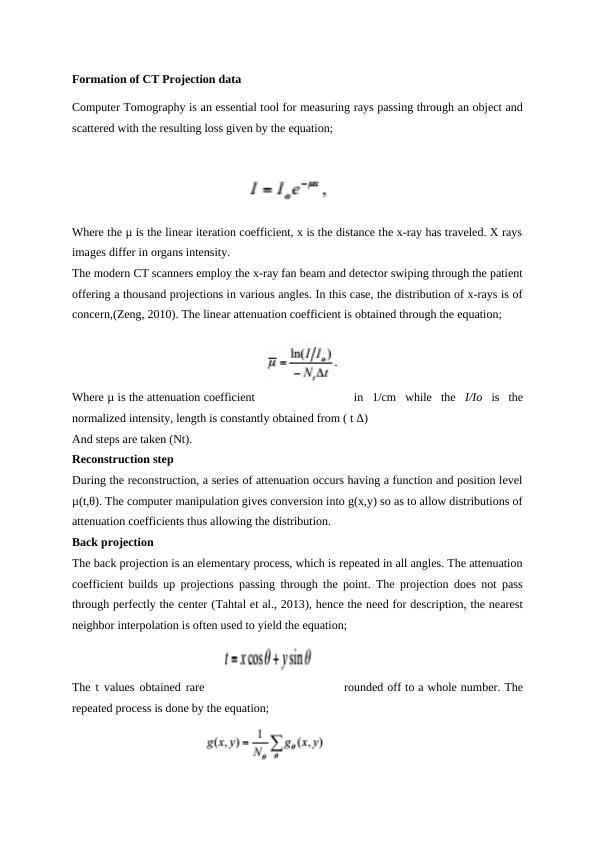
Computer Tomography is an essential tool for measuring rays passing through an object and
scattered with the resulting loss given by the equation;
Where the μ is the linear iteration coefficient, x is the distance the x-ray has traveled. X rays
images differ in organs intensity.
The modern CT scanners employ the x-ray fan beam and detector swiping through the patient
offering a thousand projections in various angles. In this case, the distribution of x-rays is of
concern,(Zeng, 2010). The linear attenuation coefficient is obtained through the equation;
Where μ is the attenuation coefficient in 1/cm while the I/Io is the
normalized intensity, length is constantly obtained from ( t Δ)
And steps are taken (Nt).
Reconstruction step
During the reconstruction, a series of attenuation occurs having a function and position level
μ(t,θ). The computer manipulation gives conversion into g(x,y) so as to allow distributions of
attenuation coefficients thus allowing the distribution.
Back projection
The back projection is an elementary process, which is repeated in all angles. The attenuation
coefficient builds up projections passing through the point. The projection does not pass
through perfectly the center (Tahtal et al., 2013), hence the need for description, the nearest
neighbor interpolation is often used to yield the equation;
The t values obtained rare rounded off to a whole number. The
repeated process is done by the equation;
The summation of the matrices is summed and divided by angles number (No).
Filtering
The resultant back projections often yield blurred reconstruction images. Addition of 1/r
convolution to the image is done, hence filtering is applied. Filters to be used can range from
a variety; the simplest method is the ramp filter with the formula;
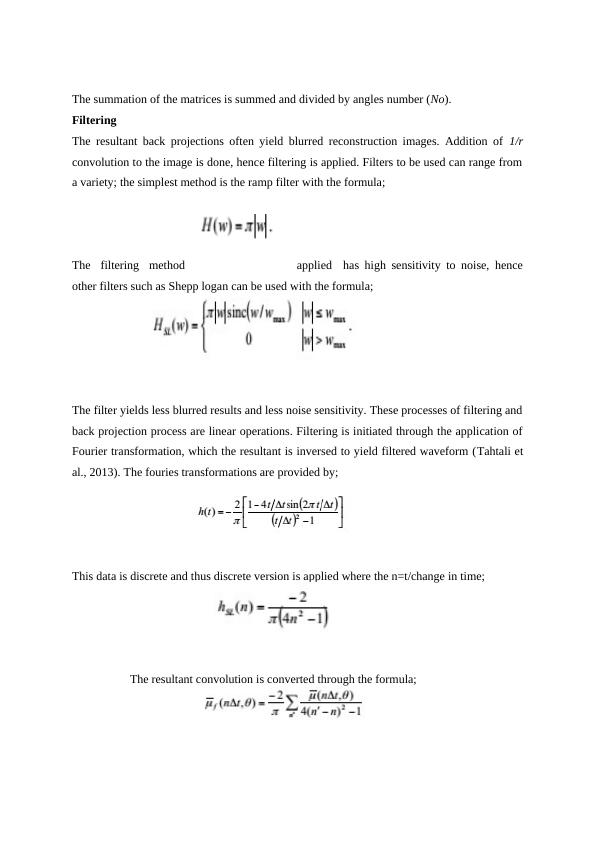
The filtering method applied has high sensitivity to noise, hence
other filters such as Shepp logan can be used with the formula;
The filter yields less blurred results and less noise sensitivity. These processes of filtering and
back projection process are linear operations. Filtering is initiated through the application of
Fourier transformation, which the resultant is inversed to yield filtered waveform (Tahtali et
al., 2013). The fouries transformations are provided by;
This data is discrete and thus discrete version is applied where the n=t/change in time;
The resultant convolution is converted through the formula;
Filtering
The resultant back projections often yield blurred reconstruction images. Addition of 1/r
convolution to the image is done, hence filtering is applied. Filters to be used can range from
a variety; the simplest method is the ramp filter with the formula;
The filtering method applied has high sensitivity to noise, hence
other filters such as Shepp logan can be used with the formula;
The filter yields less blurred results and less noise sensitivity. These processes of filtering and
back projection process are linear operations. Filtering is initiated through the application of
Fourier transformation, which the resultant is inversed to yield filtered waveform (Tahtali et
al., 2013). The fouries transformations are provided by;
This data is discrete and thus discrete version is applied where the n=t/change in time;
The resultant convolution is converted through the formula;
End of preview
Want to access all the pages? Upload your documents or become a member.