STAT200: Descriptive Statistics Analysis & Write-up at UMUC
VerifiedAdded on 2023/04/20
|8
|1160
|345
Report
AI Summary
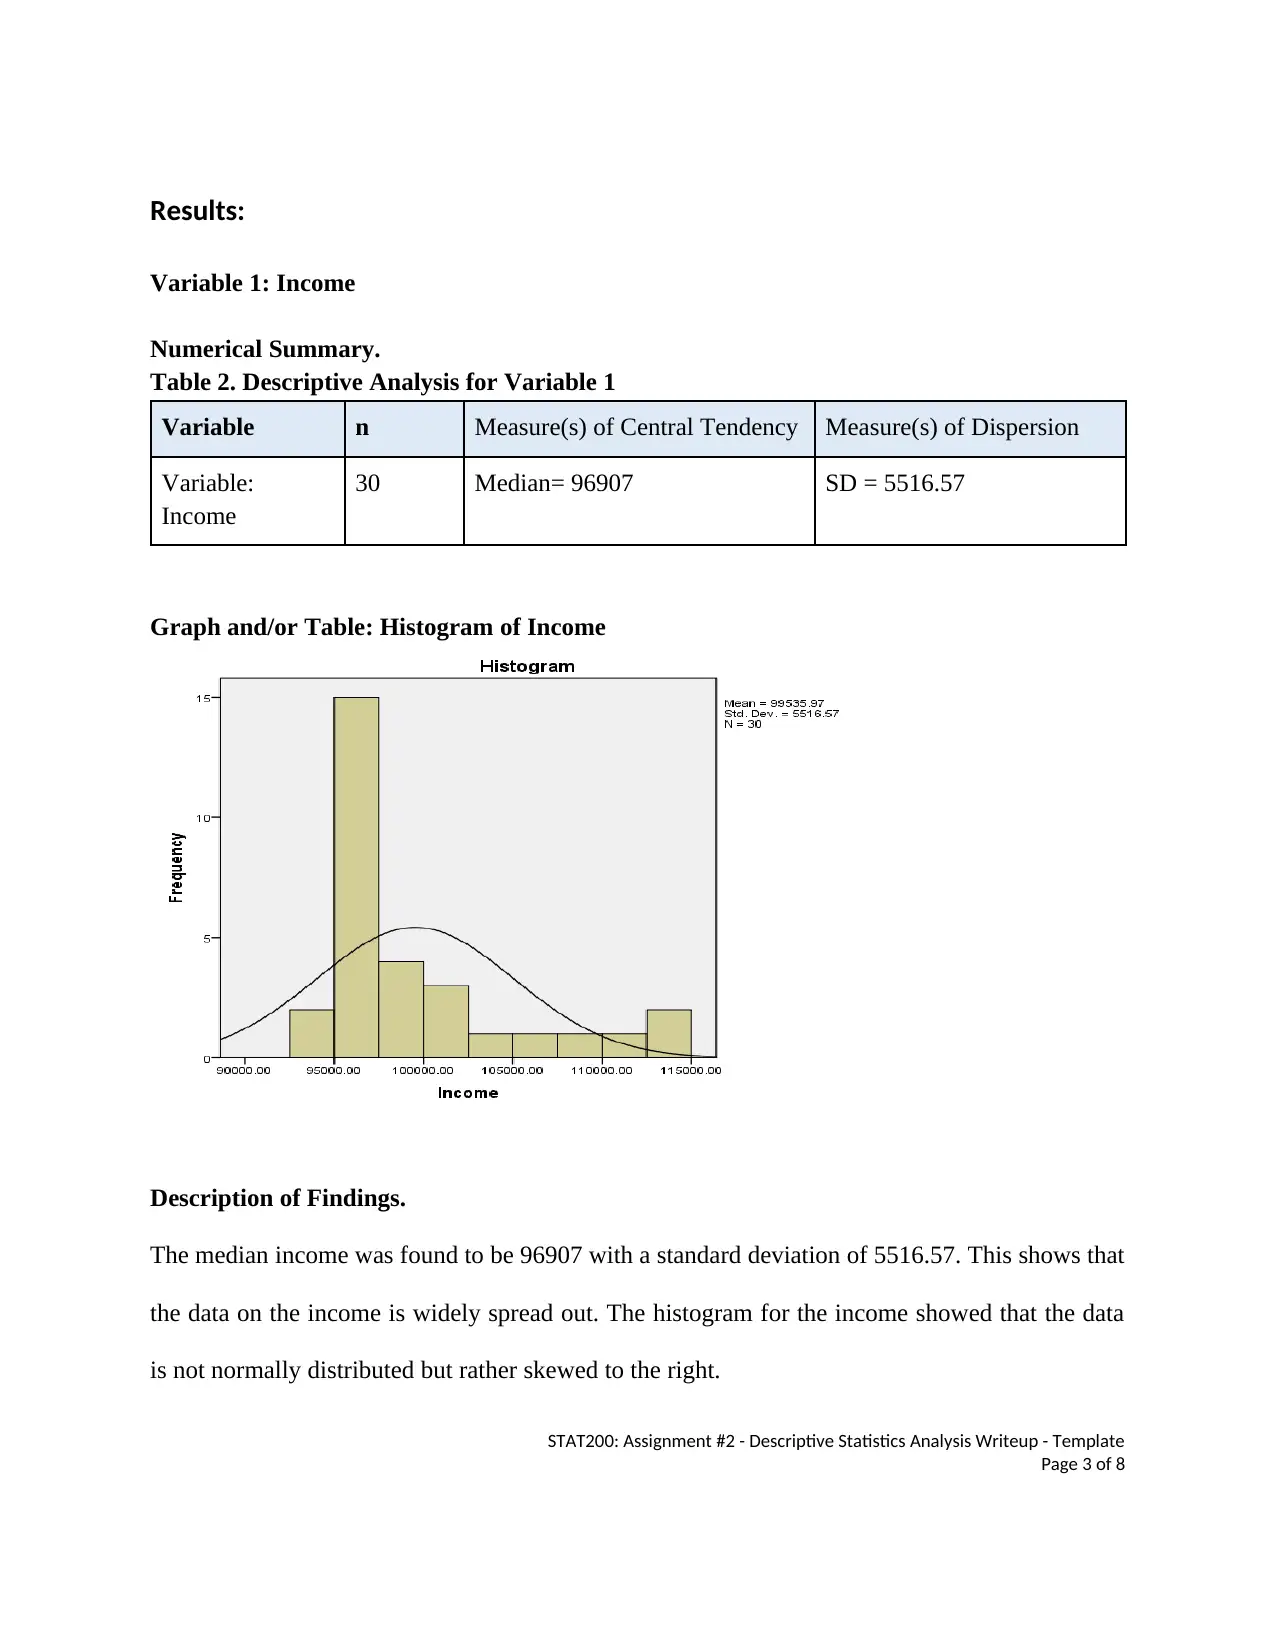
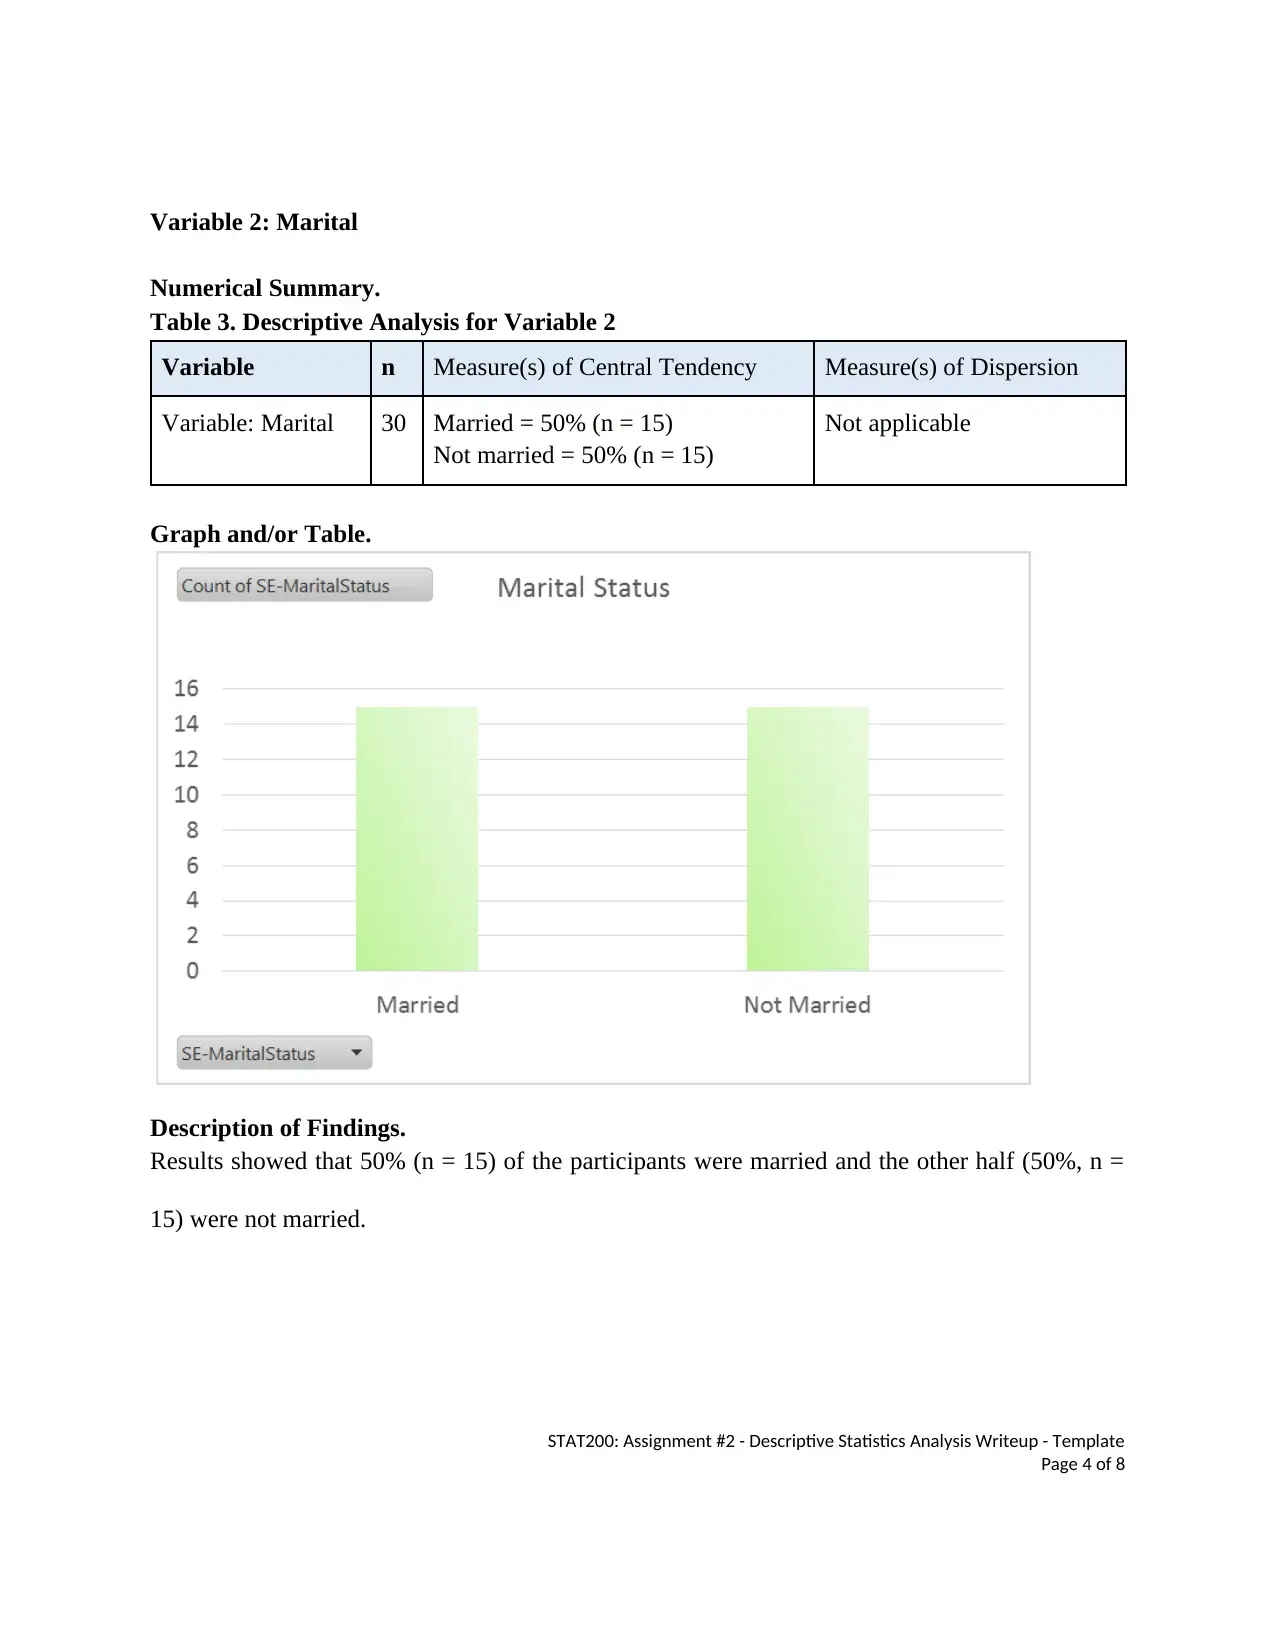
This report presents a descriptive statistics analysis of a dataset comprising information on 30 households, focusing on socioeconomic and expenditure variables. The analysis includes variables such as annual income, marital status, family size, annual expenditures, and housing expenditure. Descriptive statistics, including measures of central tendency (mean, median) and dispersion (standard deviation), were used to analyze the data. The findings indicate that the median income was 96907 with a standard deviation of 5516.57, the median family size was 3 with a standard deviation of 1.3222, and the mean annual expenditure was 66165.5333 with a standard deviation of 10896.76. The report also notes that the data for income, annual expenditures, and housing expenditure is skewed to the right, indicating a non-normal distribution. The highest expenditure was on total annual expenditure, suggesting an area for potential savings.

1 out of 8
Related Documents


Your All-in-One AI-Powered Toolkit for Academic Success.
+13062052269
info@desklib.com
Available 24*7 on WhatsApp / Email
![[object Object]](/_next/static/media/star-bottom.7253800d.svg)
Copyright © 2020–2026 A2Z Services. All Rights Reserved. Developed and managed by ZUCOL.