92296 Epidemiology: Comparative Study of Cancer Death Rates 2013
VerifiedAdded on 2023/03/31
|12
|1717
|200
Homework Assignment
AI Summary
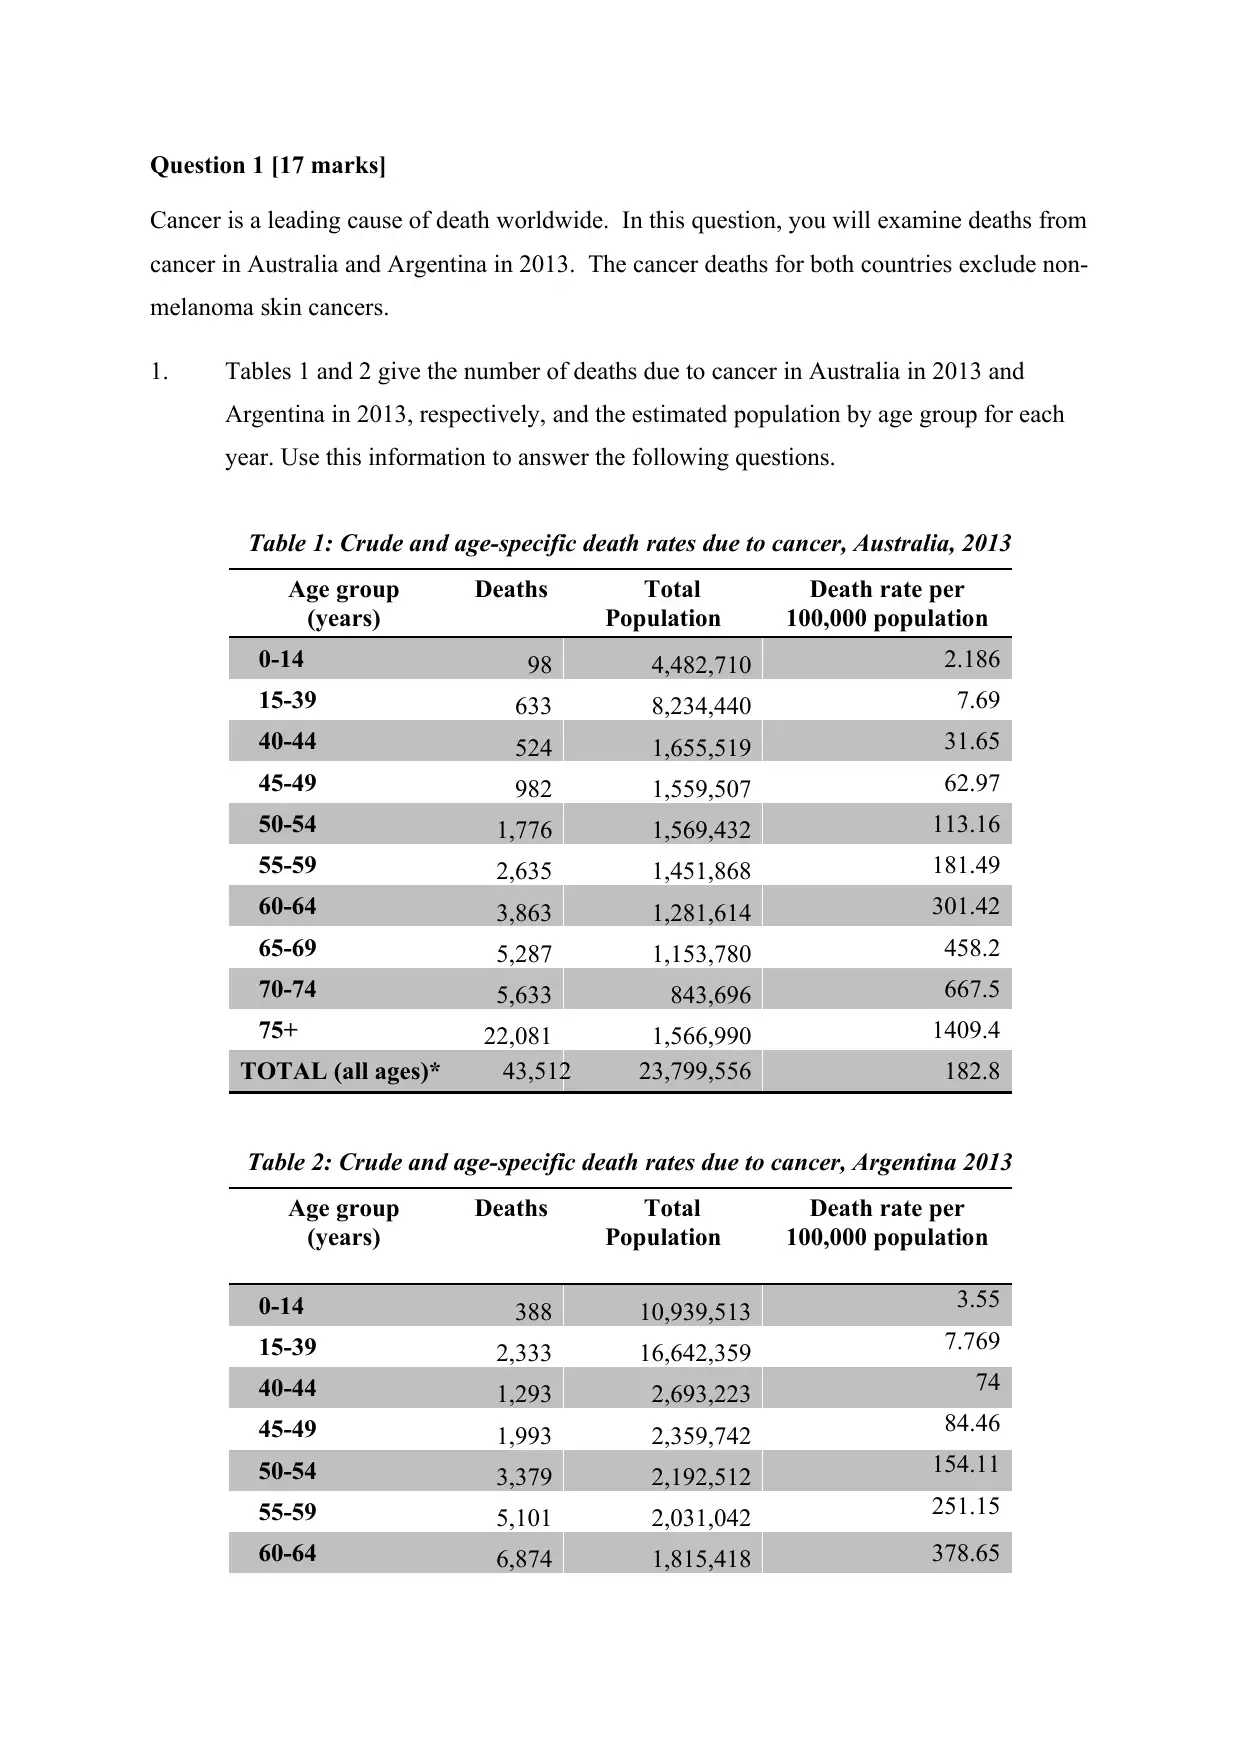
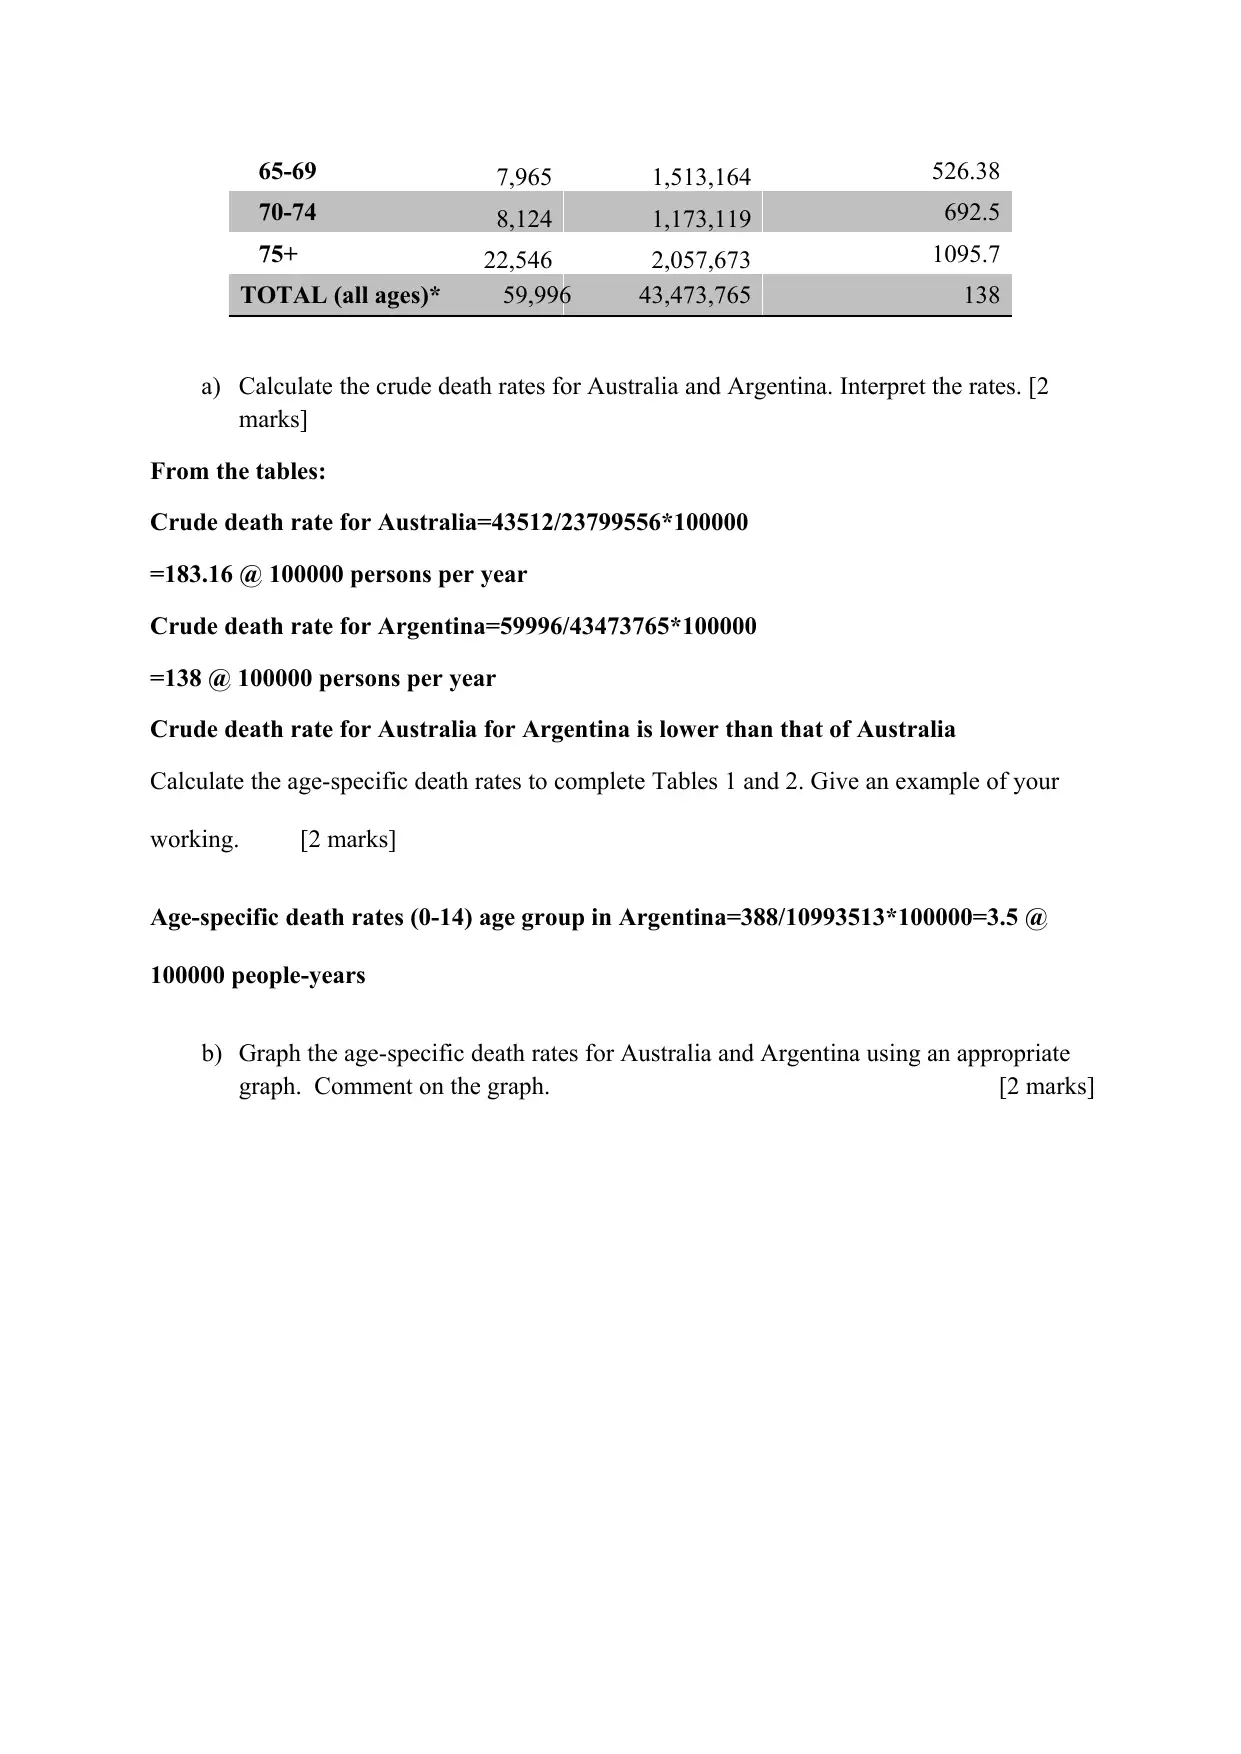
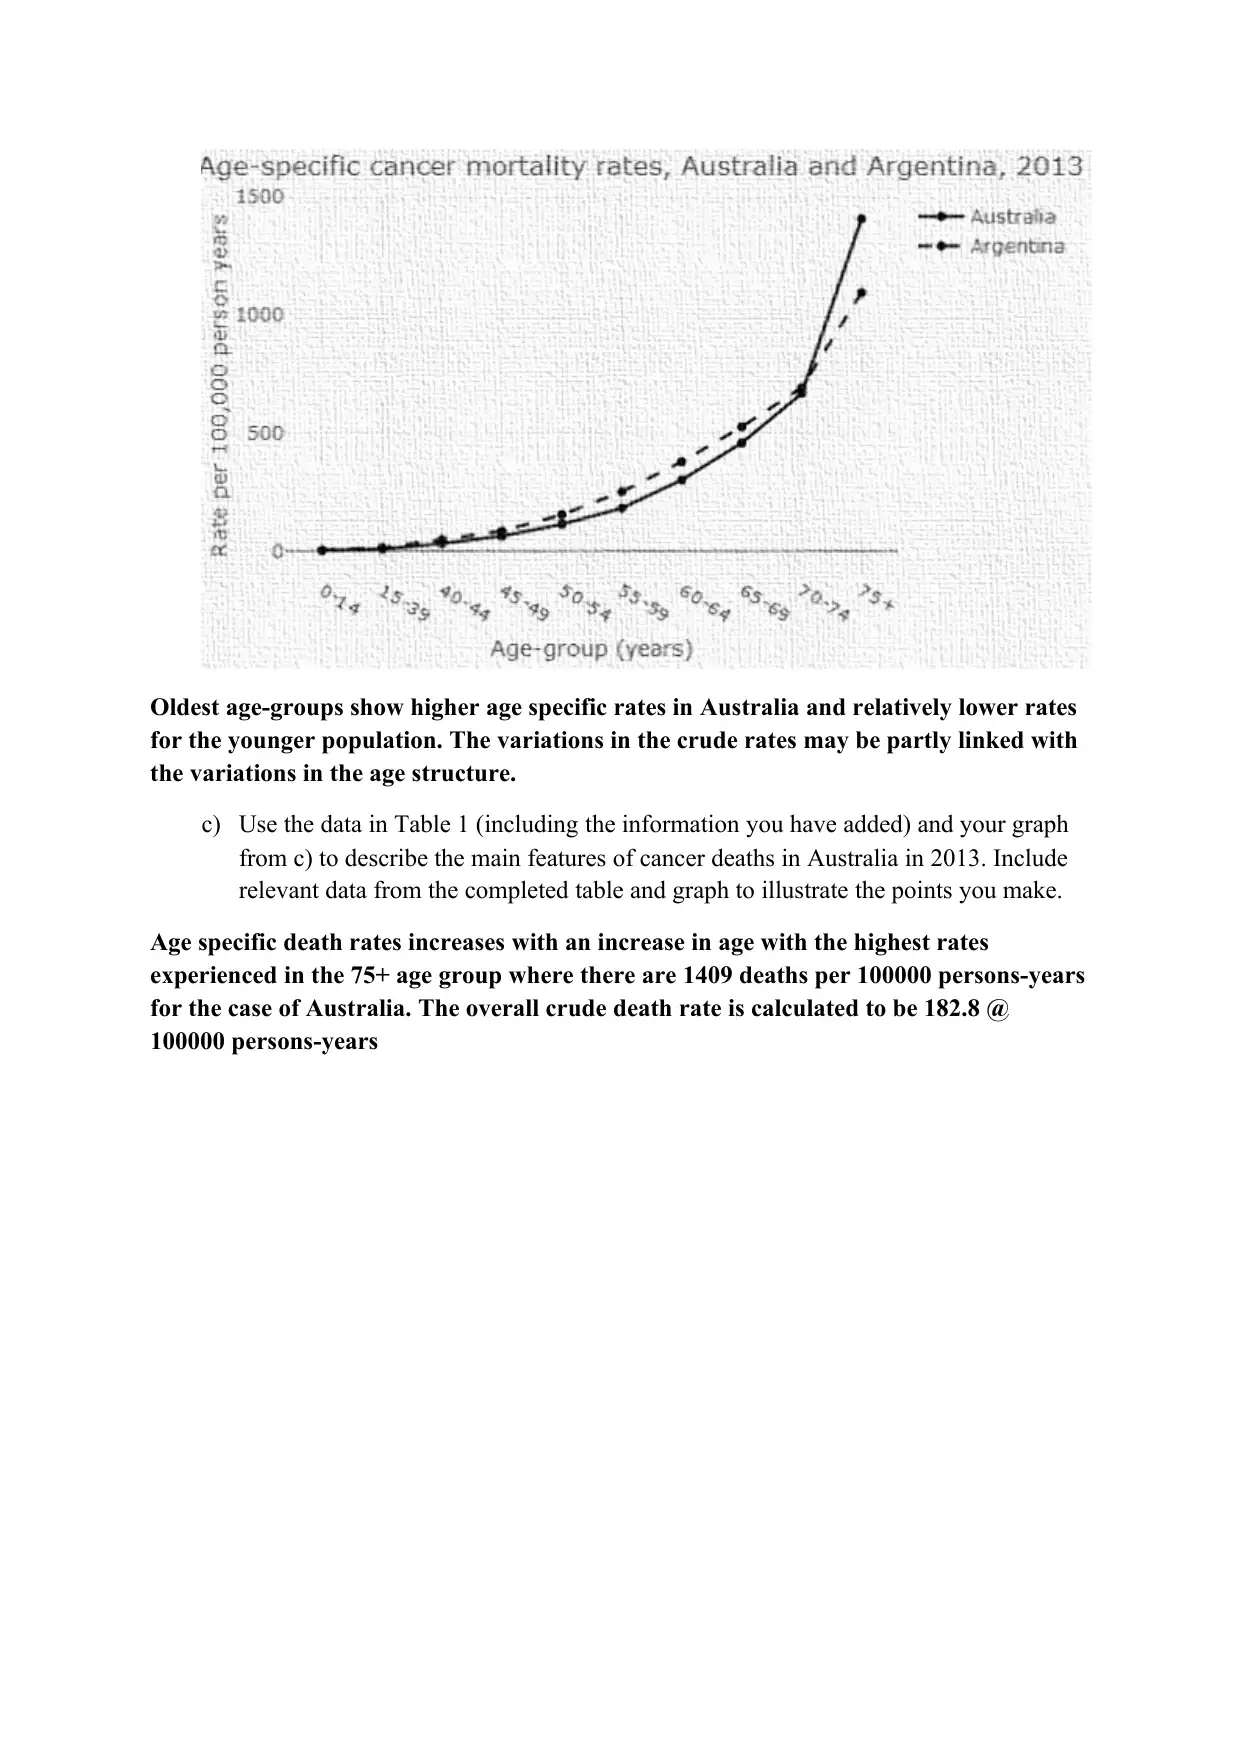
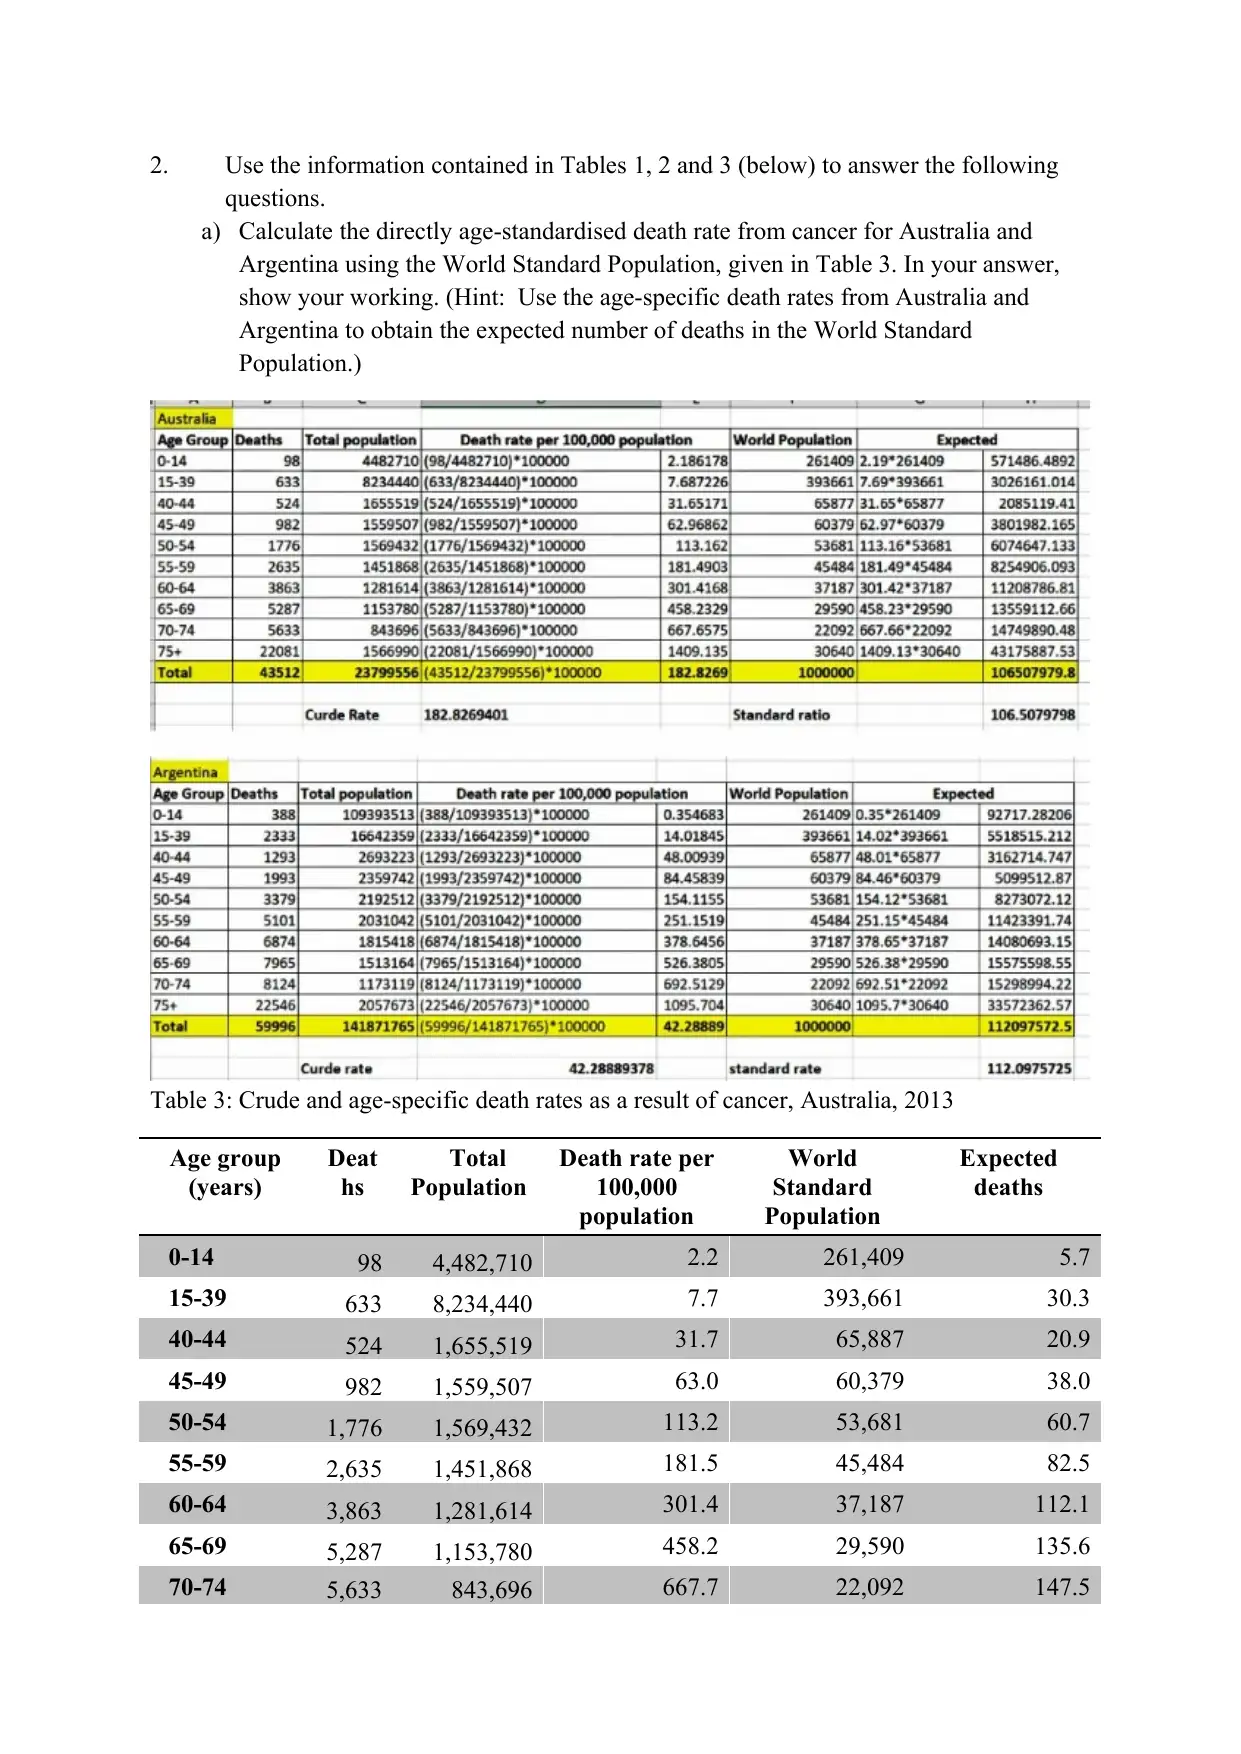
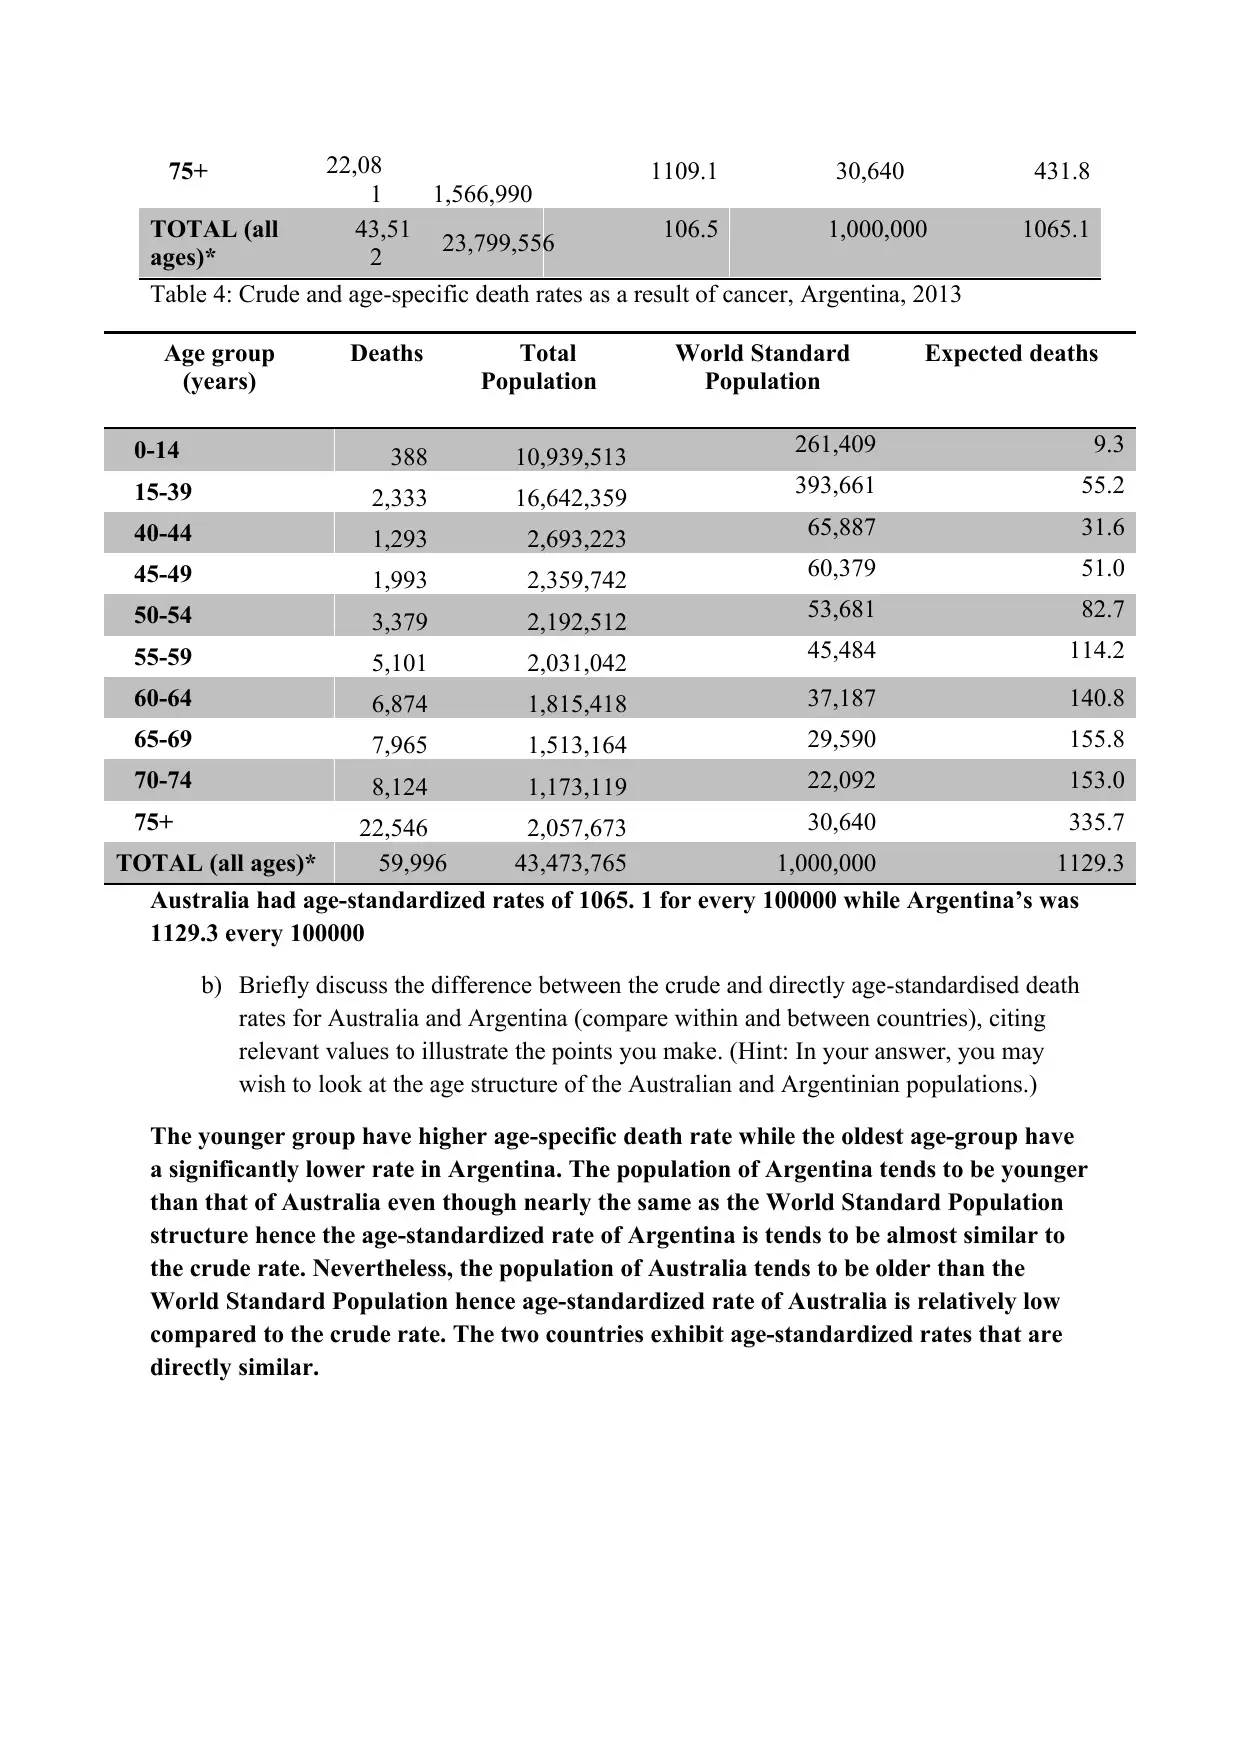
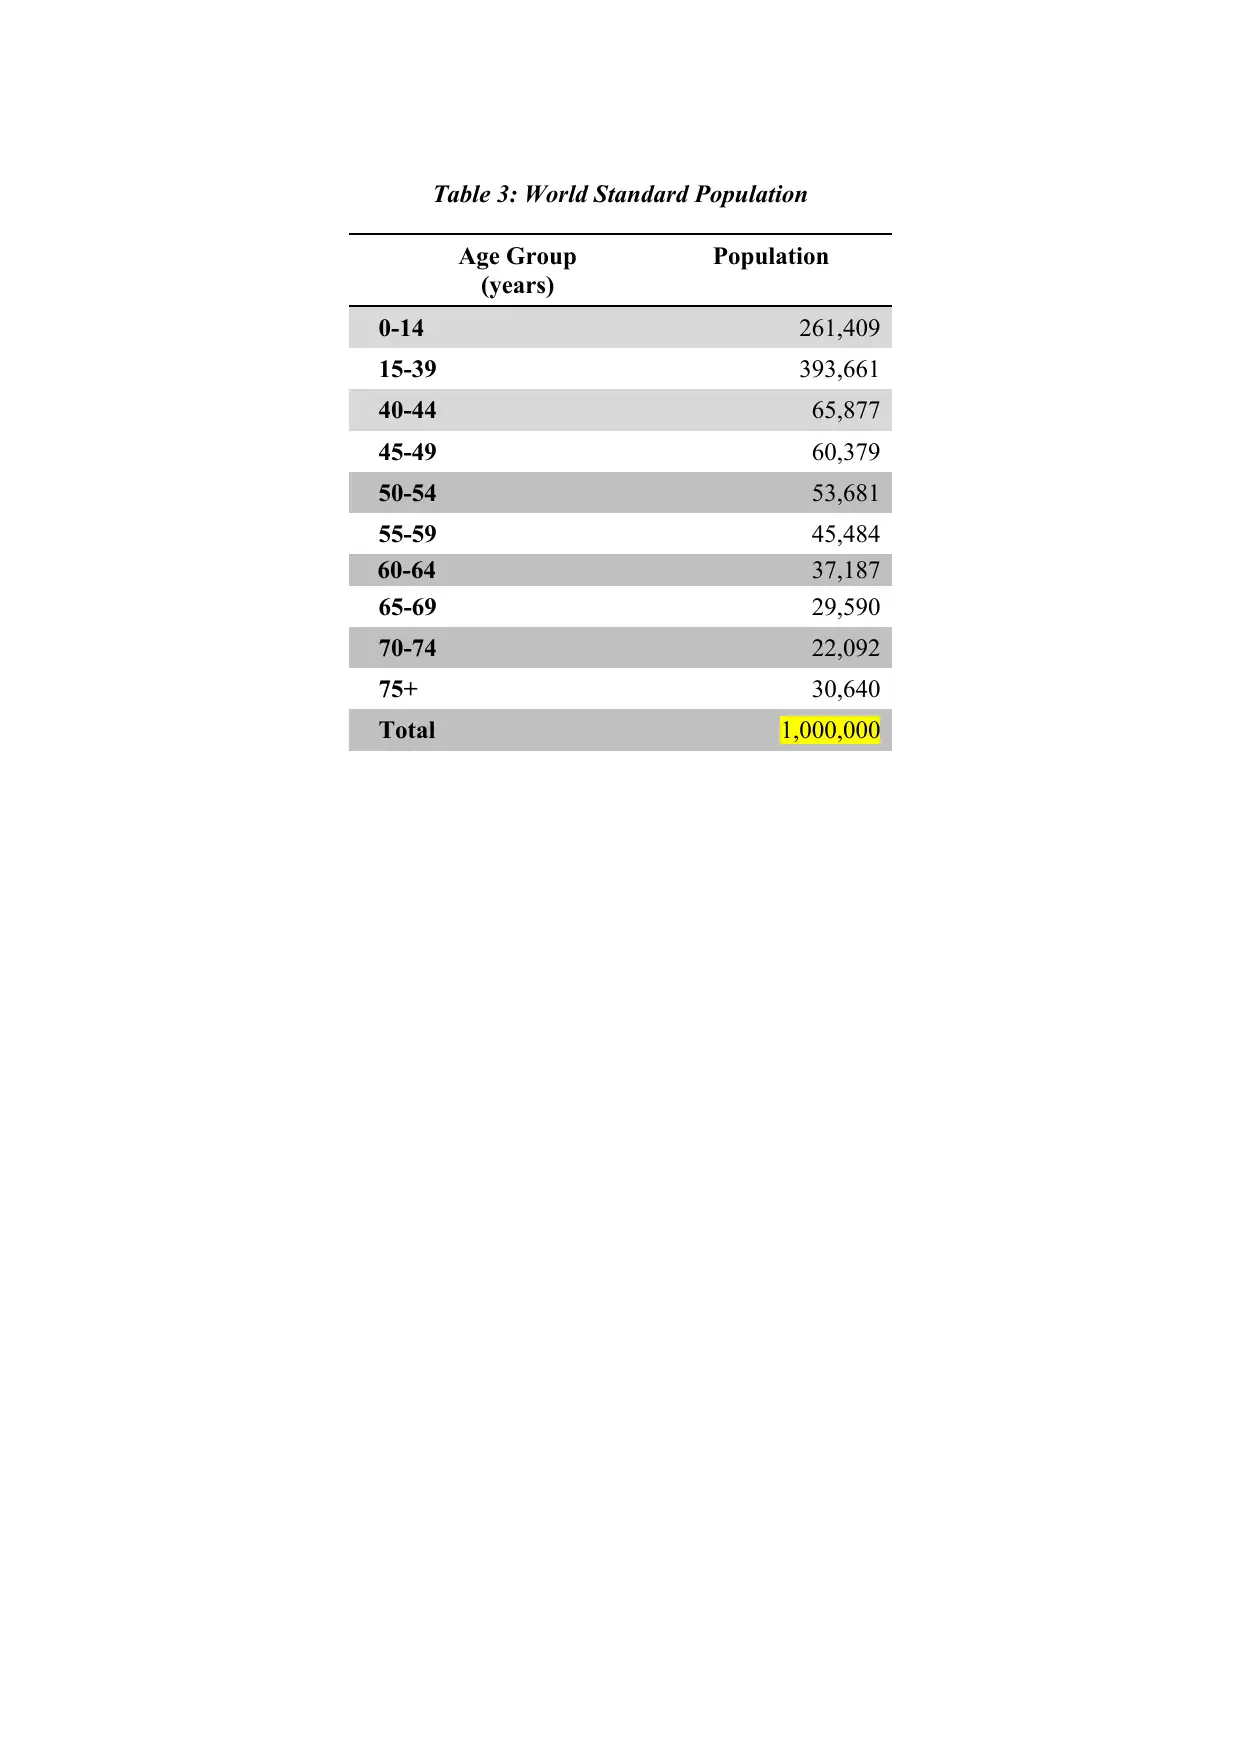
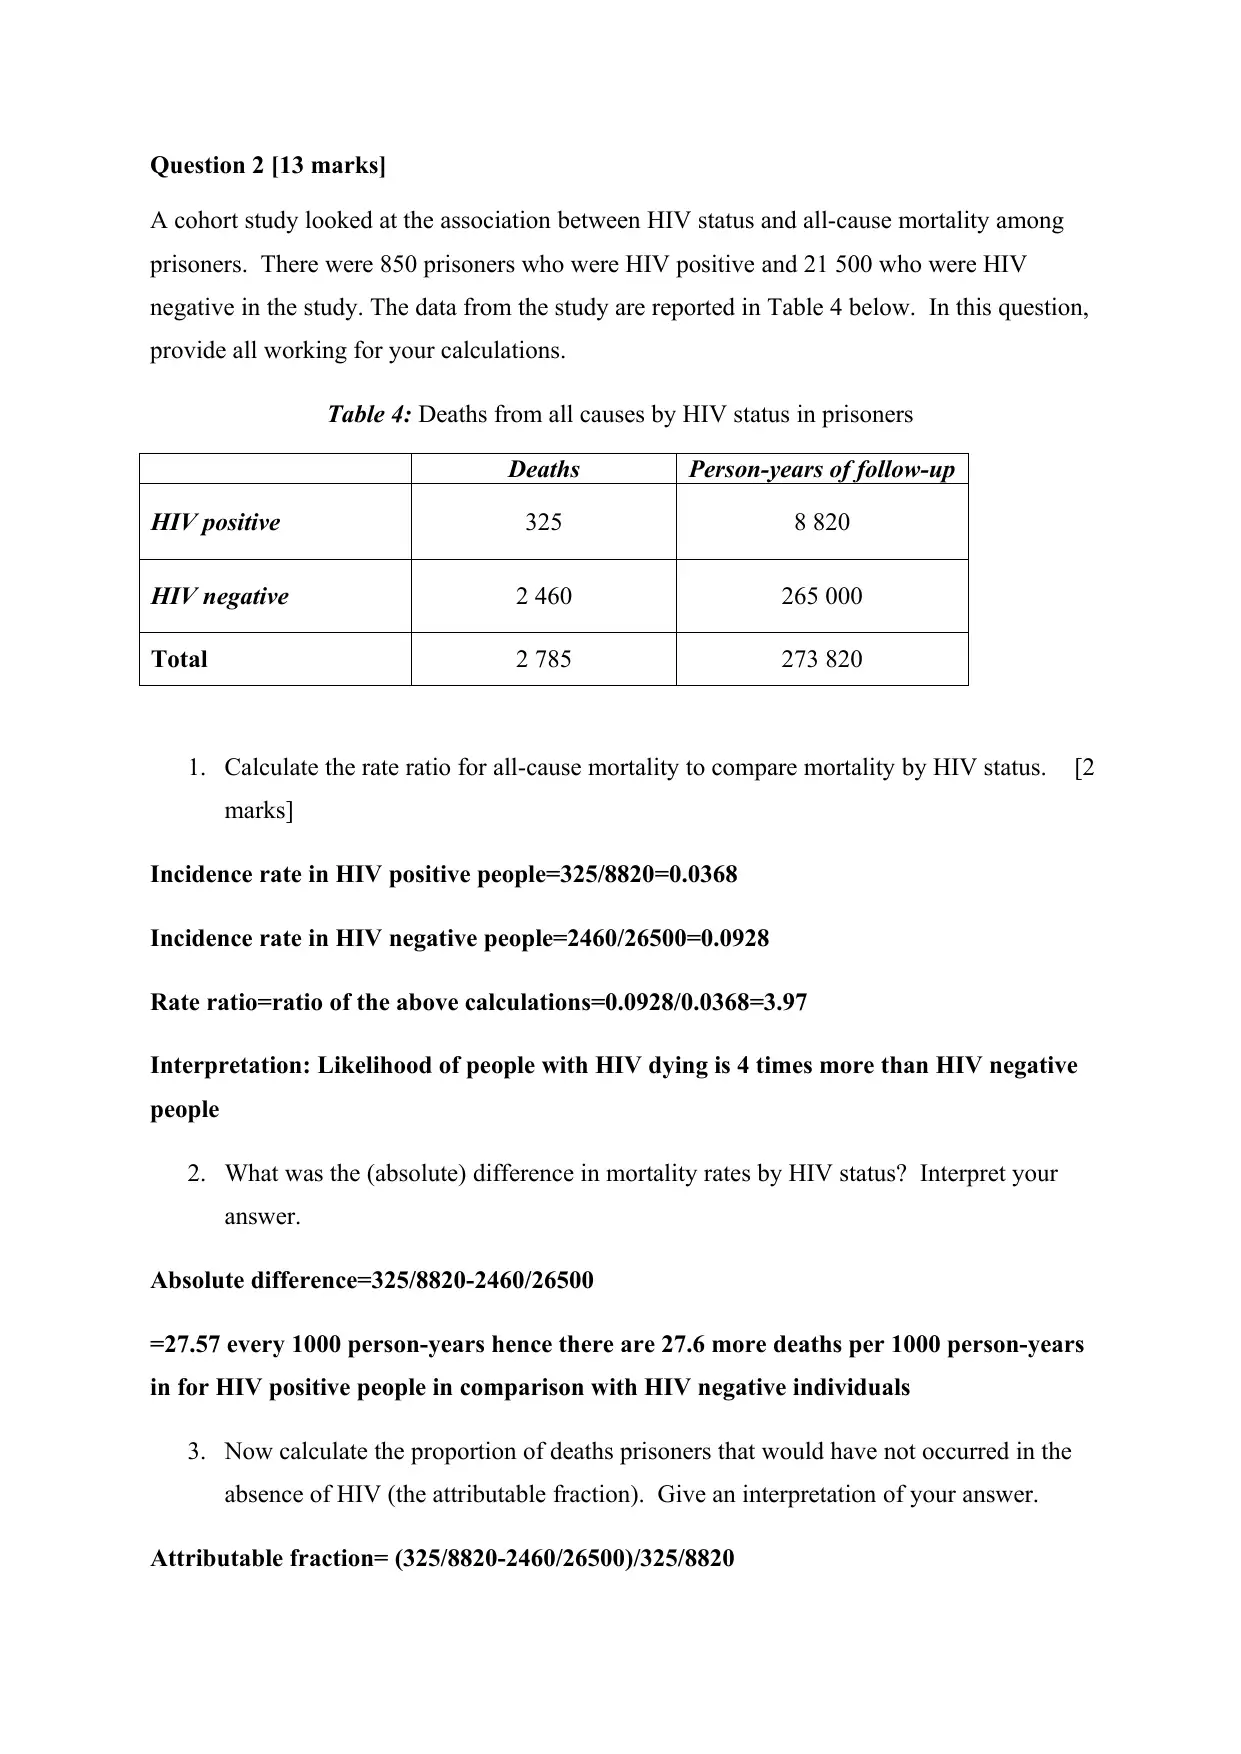
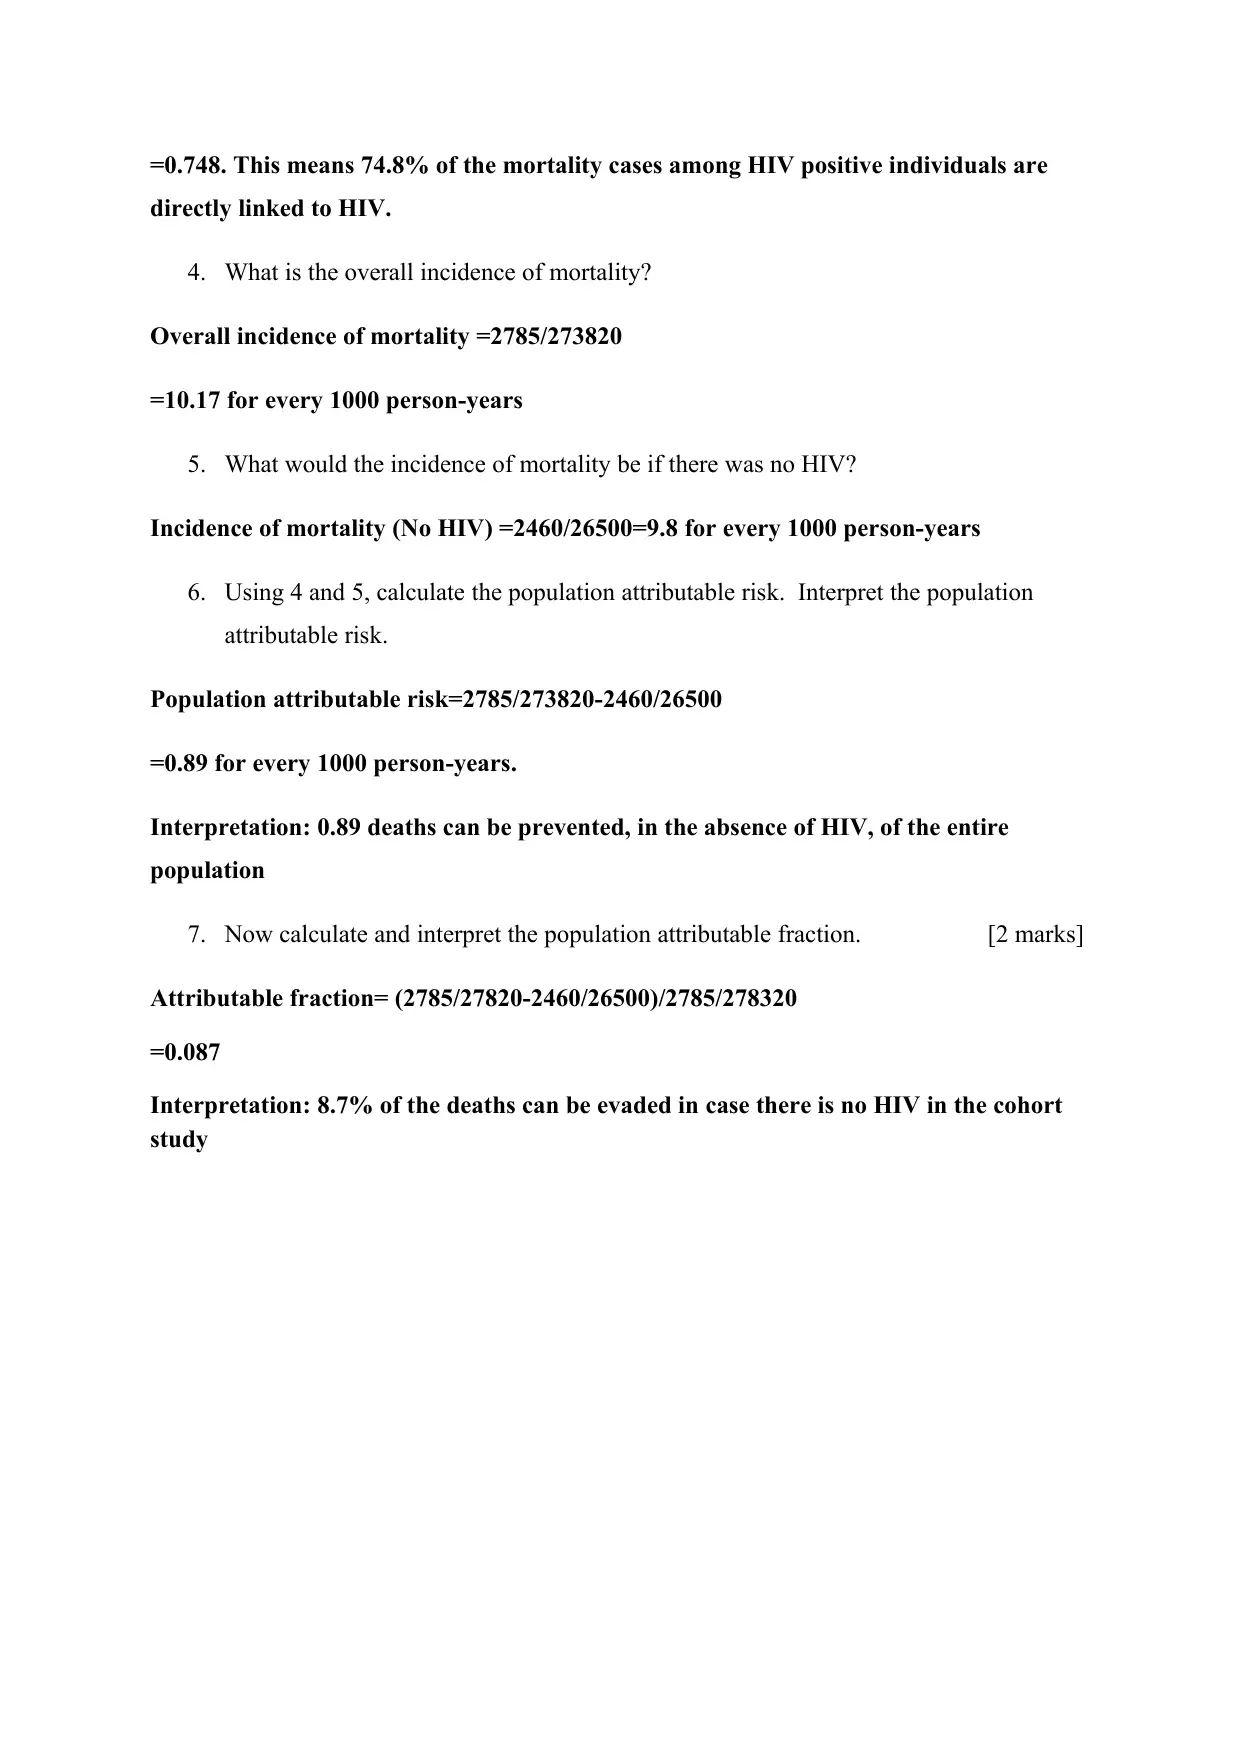
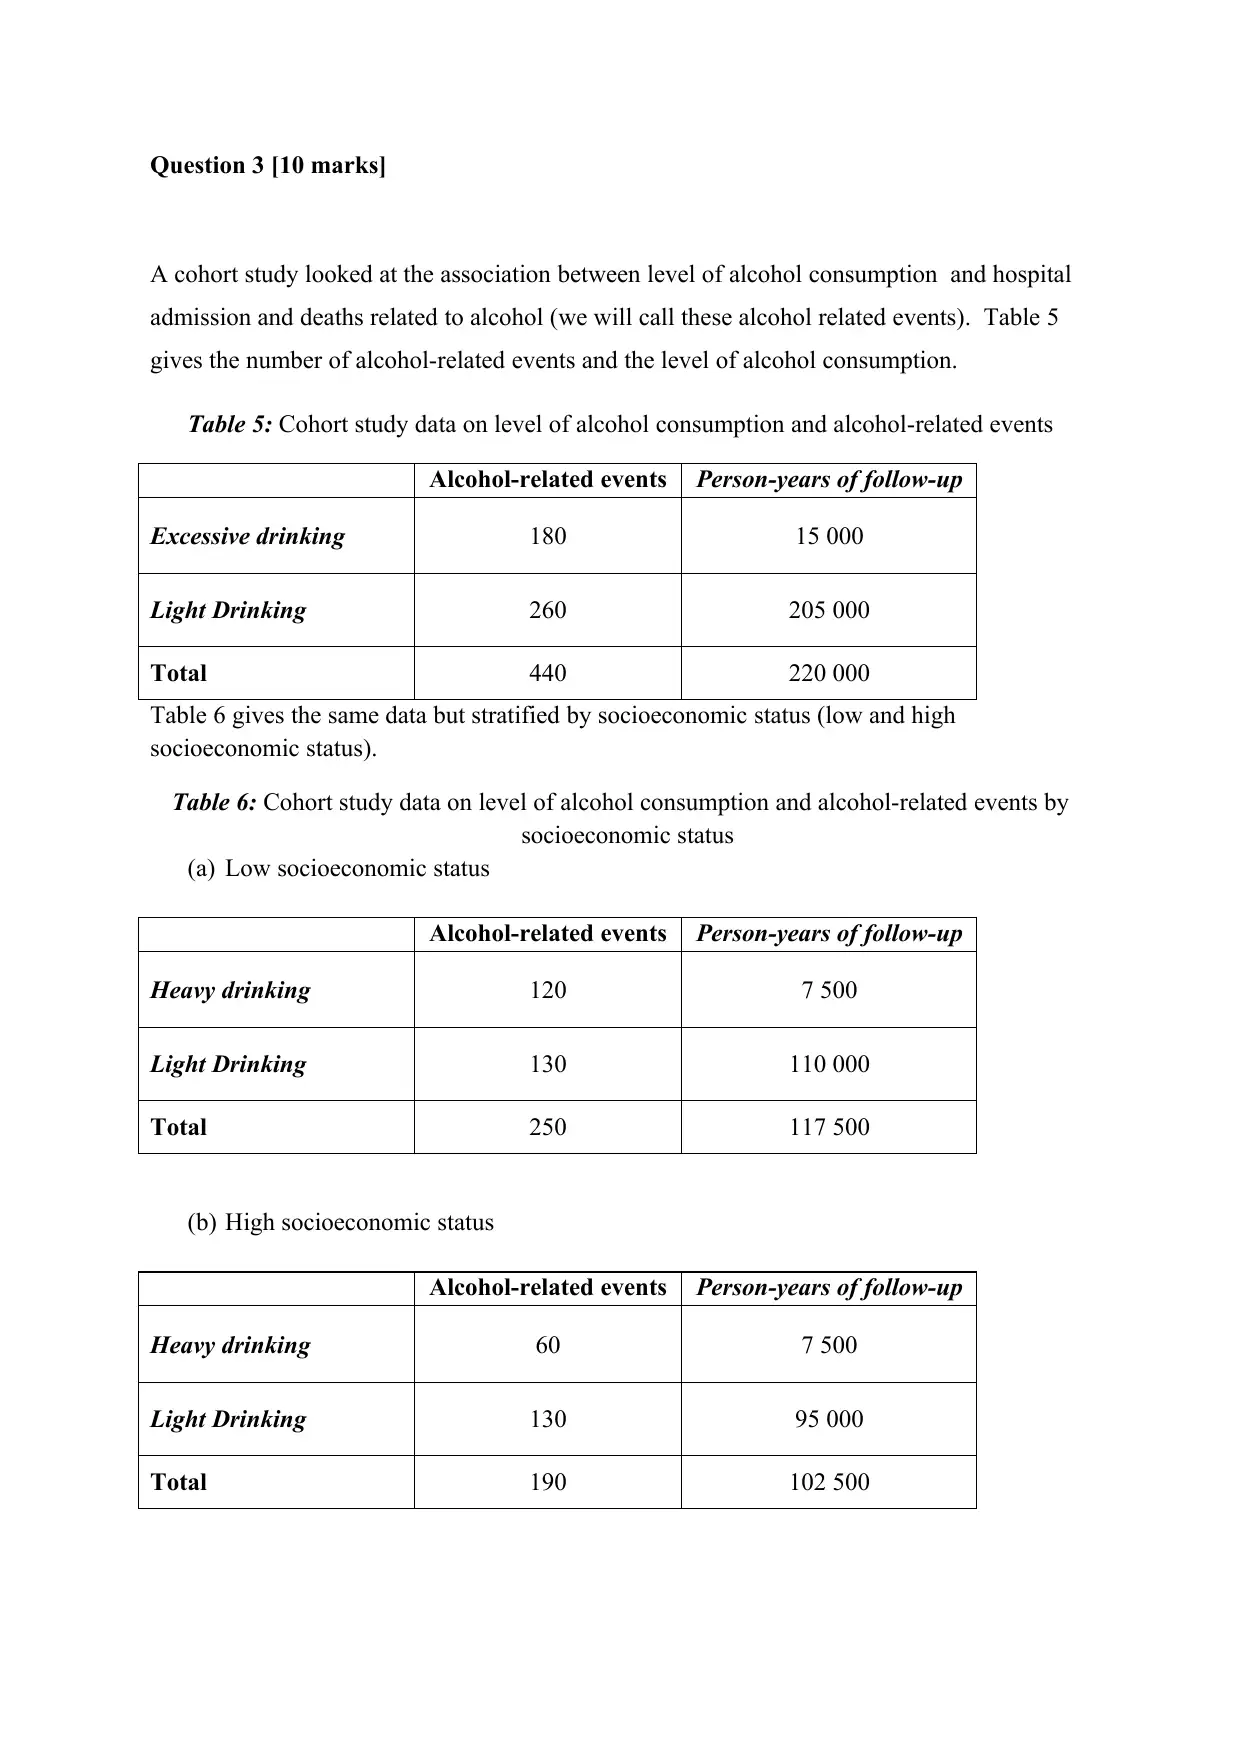
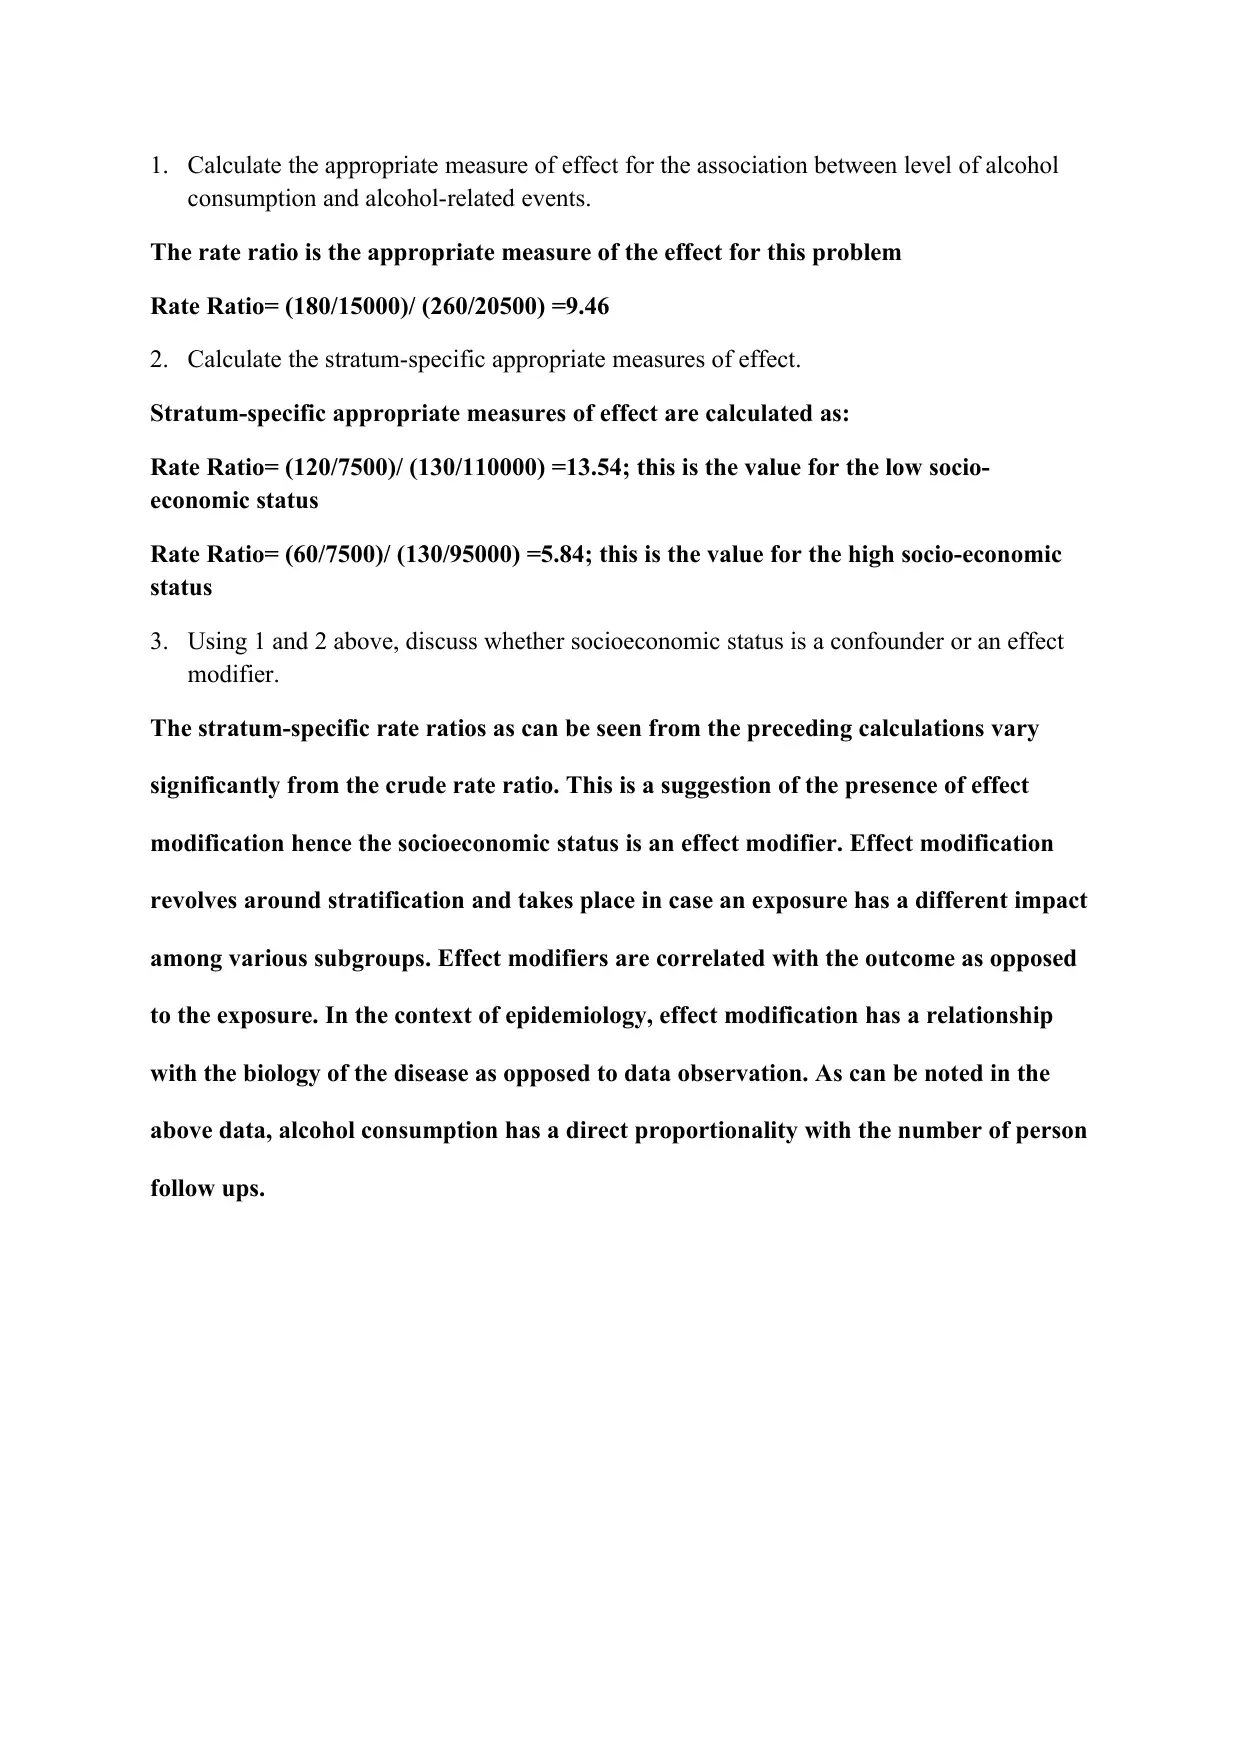
This assignment provides a detailed analysis of cancer death rates in Australia and Argentina in 2013, focusing on crude and age-specific rates. It involves calculating and interpreting these rates, graphing age-specific death rates for comparison, and discussing the main features of cancer deaths in Australia. The assignment also covers the calculation and discussion of directly age-standardized death rates using the World Standard Population. Further, it explores a cohort study on HIV status and all-cause mortality among prisoners, including calculations of rate ratios, absolute differences in mortality rates, attributable fractions, and population attributable risk. The final section examines the association between alcohol consumption and alcohol-related events, assessing the role of socioeconomic status as a confounder or effect modifier. The solutions are prepared in accordance with the University of Technology Sydney, 92296 Epidemiology and Population Health Autumn 2019 Assessment 2 guidelines. Desklib offers a wide range of solved assignments for students.

1 out of 12
Related Documents


Your All-in-One AI-Powered Toolkit for Academic Success.
+13062052269
info@desklib.com
Available 24*7 on WhatsApp / Email
![[object Object]](/_next/static/media/star-bottom.7253800d.svg)
Copyright © 2020–2026 A2Z Services. All Rights Reserved. Developed and managed by ZUCOL.