Data Visualization and Business Intelligence
VerifiedAdded on 2023/04/03
|22
|2231
|57
AI Summary
This study material explores the use of data visualization and business intelligence in crowdfunding and investment in AirBNB properties. It includes an analysis of the most important attributes for crowdfunding projects and the best suburbs and property types for AirBNB investment. The material also provides insights into the market trends and regulations affecting AirBNB rentals.
Contribute Materials
Your contribution can guide someone’s learning journey. Share your
documents today.

University
Semester
Data visualization and business
intelligence
Student ID
Student Name
Submission Date
1
Semester
Data visualization and business
intelligence
Student ID
Student Name
Submission Date
1
Secure Best Marks with AI Grader
Need help grading? Try our AI Grader for instant feedback on your assignments.

Table of Contents
Part 1 - Crowd funding..........................................................................................................................3
1. Data Explore..............................................................................................................................3
2. Determination of Most Important Attributes of the Project.......................................................8
3. Justification of Most Important Attributes of the Project.........................................................14
Part 2 - AirBNB...................................................................................................................................15
1. Questions.................................................................................................................................15
2. Data.........................................................................................................................................16
3. Data Analysis Method.............................................................................................................18
References...........................................................................................................................................22
Appendix.............................................................................................................................................23
2

Part 1 - Crowd funding
This task refers to using BigML and SPSS to analyze the Kick starter data. A website
named kickstarter.com allows the users to create a project to obtain crowdfunding for creative
pursuits like video games, stage shows, files and so on. Penny Robinson is a very talented
young woman. She can paint, write, sing and more. In fact, she can do anything creative. But,
the only problem she has is, she does not have any money. So, she wants to obtain money via
crowdfunding to fund a creative project and she knows the spreadsheet full of data. She wants
to know if you can give her any advice about creating a crowd-funded project based on the
data in the file. Therefore, in this project, we are exploring the provided data analysis and
determine any information that will be useful to Penny, who attempt to determine the most
important attributes of the projects depending on whether a project succeeds. At last, present
the most important attributes and justify by using SPSS and BigML.
1. Data Explore
Here, we will explore the kick-starter data which has the following attributes and it is
illustrated below.
To explore the kick-starter, two business intelligence tool such as SPSS and BigML are
used and it is illustrated in the below section.
In SPSS business intelligence tool,
First, we will open SPSS tool and click on the file>Import>Excel to upload the kick-
starter data, which is illustrated below.
3

The data exploration of Kick starter is successfully completed, which is demonstrated
below.
In BigML tool,
To explore the kick starter data on big ML, follow the below steps.
Go to BigML online.
Click on source to upload the provided data, which is illustrated below.
4
below.
In BigML tool,
To explore the kick starter data on big ML, follow the below steps.
Go to BigML online.
Click on source to upload the provided data, which is illustrated below.
4
Secure Best Marks with AI Grader
Need help grading? Try our AI Grader for instant feedback on your assignments.

The source is successfully added as follows.
Once, the source is successfully added to BigML tool, we will configure the data set
to click the Configure data set for choosing a source file which is illustrated in the following
figure.
5
Once, the source is successfully added to BigML tool, we will configure the data set
to click the Configure data set for choosing a source file which is illustrated in the following
figure.
5
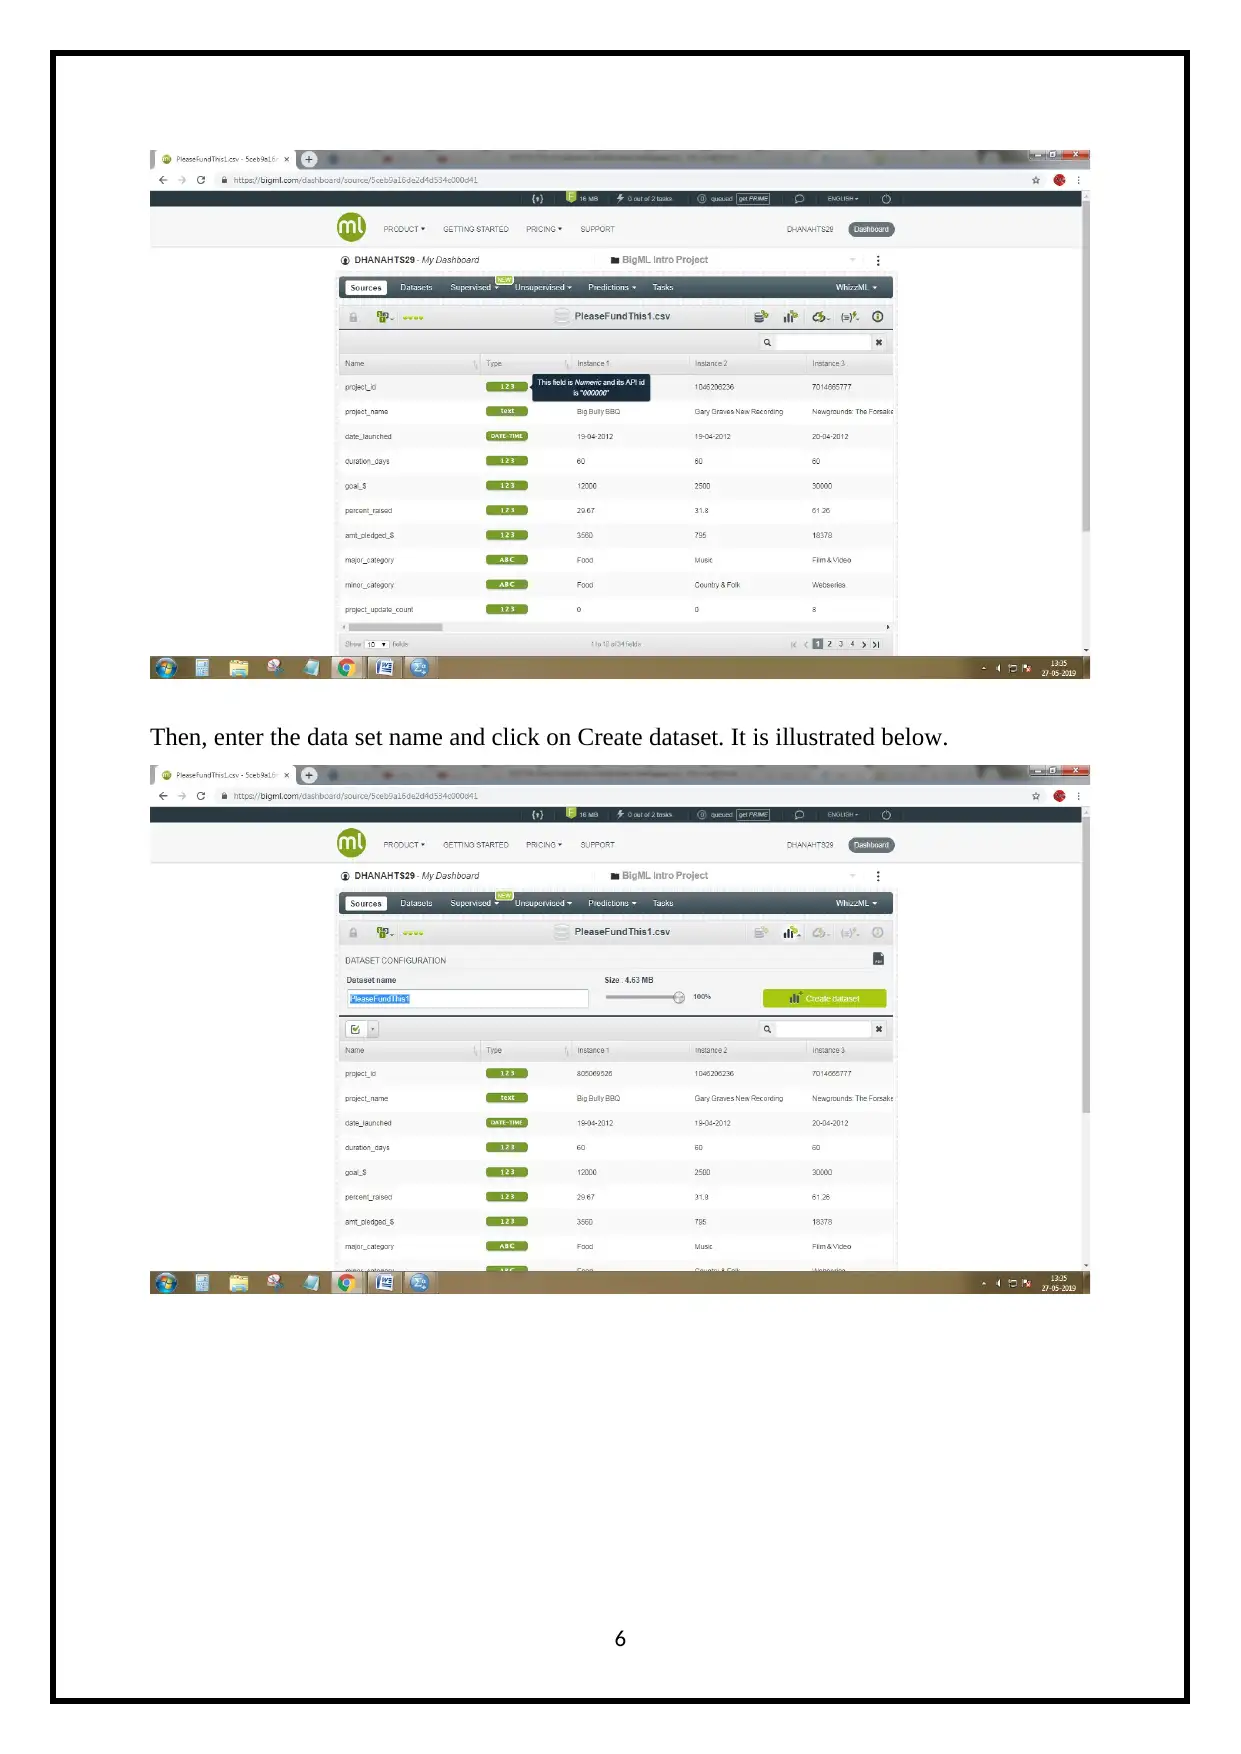
Then, enter the data set name and click on Create dataset. It is illustrated below.
6
6

The process of data set creation is illustrated below.
At last, the data is successfully explored which is illustrated below.
Next, we will determine the most important attributes of the project.
7
At last, the data is successfully explored which is illustrated below.
Next, we will determine the most important attributes of the project.
7
Paraphrase This Document
Need a fresh take? Get an instant paraphrase of this document with our AI Paraphraser

2. Determination of Most Important Attributes of the Project
Here, we will determine the most important attributes of the project, which are used to
resolve Penny’s problem to obtain money via crowdfunding, so that she can fund a creative
project (Ahmed Sherif., 2016).
In SPSS,
Linear regression in SPSS is used to determine the most important attributes of the project.
To do linear regression on SPSS,
Analyze > Regression > Linear.
Next, we will choose the dependent and independent variable such as
highest_pledge_reward_$ and project_sucess.
The output of the linear regression is illustrated below.
The model output is represented below.
Variables Entered/Removeda
Model Variables Entered Variables Removed Method
1 project_successb . Enter
a. Dependent Variable: highest_pledge_reward_$
b. All requested variables entered.
The model summary is represented below.
Model Summaryb
Model R R Square Adjusted R
Square
Std. Error of the
Estimate
1 .064a .004 .004 3060.4280
a. Predictors: (Constant), project_success
b. Dependent Variable: highest_pledge_reward_$
The ANOVA table is represented below.
ANOVAa
Model Sum of
Squares
df Mean Square F Sig.
1 Regression 1093019119.
882
1 1093019119.
882
116.698 .000b
Residual 2664221170
61.036
28445 9366219.619
Total 2675151361 28446
8

80.918
a. Dependent Variable: highest_pledge_reward_$
b. Predictors: (Constant), project_success
The coefficients output is represented below.
Coefficientsa
Model Unstandardized
Coefficients
Standardiz
ed
Coefficien
ts
t Sig
.
95.0% Confidence
Interval for B
B Std.
Error
Beta Lower
Bound
Upper
Bound
1 (Constant) 2413.3
95
25.5
32
94.5
25
.00
0
2363.3
52
2463.4
39
project_succ
ess
-
392.05
6
36.2
92
-.064 -
10.8
03
.00
0
-
463.19
1
-
320.92
1
a. Dependent Variable: highest_pledge_reward_$
The residual statistics is represented below.
Residuals Statisticsa
Minimum Maximum Mean Std.
Deviation
N
Predicted Value 2021.339 2413.395 2219.359 196.0213 28447
Residual -2412.3953 7978.6606 .0000 3060.3742 28447
Std. Predicted
Value
-1.010 .990 .000 1.000 28447
Std. Residual -.788 2.607 .000 1.000 28447
a. Dependent Variable: highest_pledge_reward_$
In BigML,
Click on supervised to choose the ensemble techniques for determining the most
important attributes of the project, which is illustrated in the following figure.
9
a. Dependent Variable: highest_pledge_reward_$
b. Predictors: (Constant), project_success
The coefficients output is represented below.
Coefficientsa
Model Unstandardized
Coefficients
Standardiz
ed
Coefficien
ts
t Sig
.
95.0% Confidence
Interval for B
B Std.
Error
Beta Lower
Bound
Upper
Bound
1 (Constant) 2413.3
95
25.5
32
94.5
25
.00
0
2363.3
52
2463.4
39
project_succ
ess
-
392.05
6
36.2
92
-.064 -
10.8
03
.00
0
-
463.19
1
-
320.92
1
a. Dependent Variable: highest_pledge_reward_$
The residual statistics is represented below.
Residuals Statisticsa
Minimum Maximum Mean Std.
Deviation
N
Predicted Value 2021.339 2413.395 2219.359 196.0213 28447
Residual -2412.3953 7978.6606 .0000 3060.3742 28447
Std. Predicted
Value
-1.010 .990 .000 1.000 28447
Std. Residual -.788 2.607 .000 1.000 28447
a. Dependent Variable: highest_pledge_reward_$
In BigML,
Click on supervised to choose the ensemble techniques for determining the most
important attributes of the project, which is illustrated in the following figure.
9

Later, choose the objective field and type, and then click on create ensemble, which is
illustrated in the following figure.
The ensemble process is illustrated below.
10
illustrated in the following figure.
The ensemble process is illustrated below.
10
Secure Best Marks with AI Grader
Need help grading? Try our AI Grader for instant feedback on your assignments.

Next, we will view the output of the ensemble, as shown in the below figure.
11
11

12

3. Justification of Most Important Attributes of the Project
In SPSS Output, based on linear regression output, the linear regression provides
more than one table. The most important tables are Model summary table, ANOVA table,
and coefficient table. The Model summary is used to provide the R-value, which is
representing the simple correlation .064a that indicates the high degree of correlation. The
ANOVA table is used to provide the reports of how well the regression equation fits the data
and it indicates that the regression models predict the dependent variable significantly well. It
also indicates the statistical significance of the regression model that was run. Here, p < .000
which is less than 0.05. So, it indicates the overall regression model is statistically significant
and it predicts the outcome variable. It is a good fit for the data. The Coefficient table also
provides the statistical significance of the regression model. Thus, the
highest_pledge_reward_$ and project_sucess attributes are most important to obtain money
via crowdfunding, so that a creative project can be funded.
In BigML, it is provide the below output,
Data distribution:
45: 13.33% (8 instances)
80: 13.33% (8 instances)
100: 23.33% (14 instances)
13
Paraphrase This Document
Need a fresh take? Get an instant paraphrase of this document with our AI Paraphraser

450: 15.00% (9 instances)
4000: 15.00% (9 instances)
10000: 20.00% (12 instances)
Predicted distribution:
45: 13.33% (8 instances)
80: 13.33% (8 instances)
100: 23.33% (14 instances)
450: 15.00% (9 instances)
4000: 15.00% (9 instances)
10000: 20.00% (12 instances)
Field importance:
1. lowest_pledge_reward_$: 33.70%
2. project_name: 26.58%
3. date_launched.month: 11.03%
4. amt_pledged_$: 10.08%
5. major_category: 9.06%
6. date_launched.day-of-week: 8.47%
7. total_count_of_pledge_levels: 0.94%
8. project_success: 0.15%
It clearly shows the important fields or attributes. These attributes are used to solve
Penny’s problem of obtaining money via crowdfunding, to fund a creative project.
Part 2 - AirBNB
In this part, we investigate and report the opportunities for investment on AirBNB
marker in the Greater Melbourne area to prepare the in-depth professional report for Rachel.
Because, Rachel Clare is interested to invest and it has approximately $2 million of capital.
This part, we will prepare a professional report to provide the idea for the investment.
1. Questions
1. Is AirBNB a worthwhile market place to invest in?
14
4000: 15.00% (9 instances)
10000: 20.00% (12 instances)
Predicted distribution:
45: 13.33% (8 instances)
80: 13.33% (8 instances)
100: 23.33% (14 instances)
450: 15.00% (9 instances)
4000: 15.00% (9 instances)
10000: 20.00% (12 instances)
Field importance:
1. lowest_pledge_reward_$: 33.70%
2. project_name: 26.58%
3. date_launched.month: 11.03%
4. amt_pledged_$: 10.08%
5. major_category: 9.06%
6. date_launched.day-of-week: 8.47%
7. total_count_of_pledge_levels: 0.94%
8. project_success: 0.15%
It clearly shows the important fields or attributes. These attributes are used to solve
Penny’s problem of obtaining money via crowdfunding, to fund a creative project.
Part 2 - AirBNB
In this part, we investigate and report the opportunities for investment on AirBNB
marker in the Greater Melbourne area to prepare the in-depth professional report for Rachel.
Because, Rachel Clare is interested to invest and it has approximately $2 million of capital.
This part, we will prepare a professional report to provide the idea for the investment.
1. Questions
1. Is AirBNB a worthwhile market place to invest in?
14

No, it is not as AirBNB invest in Property, so without a doubt, it is a great way to
warn extra money (Battersby, 2019). Lately, numerous urban areas over Melbourne
have directed AirBNB rentals as confinements and impediments on the number of
days a property can be leased. Staying aware of market patterns is the way to progress
with regards to land contributing. Late investigations demonstrate that the transient
rental market, which incorporates AirBNB properties among others, is relied on to
become 7.9% every year. AirBNB investment properties are winding up increasingly
engaging vacationers and voyagers, as they offer a few favourable circumstances
when contrasted with customary lodging rentals. As AirBNB develops in prevalence
and draws in an ever increasing number of visitors, purchasing a get-away investment
property appears to be a sensible interest in urban areas where AirBNB is not
vigorously directed.
2. What are the best suburbs in Melbourne to purchase properties for AirBNB to
guarantee the greatest return on investment?
A portion of Melbourne's most high suburbs areas, with blue-ribbon price tags,
are flooded with room or entire property rentals for short-remains through online
convenience player AirBNB.
The best 10 suburbs areas list is loaded up with the standard suspects - CBD, St Kilda,
South Yarra, Southbank, Richmond, Brunswick, Fitzroy, Elwood, Carlton and South
Melbourne - however it is the strength of a portion of the city's most interesting land
that may amaze.
3. What type of properties will generate the greatest return on investment? Apartments
or Houses?
Apartment property is used to provide the greatest return investment.
4. What types of rooms will generate the highest return on investment? Shared / Private /
Whole House
The whole apartment is used to generate the highest return on investment
(Investment Property Tips | Mashvisor Real Estate Blog, 2019).
2. Data
Rachel provides complete listing of all AirBNB properties in Greater Melbourne for
analysis. It is illustrated in the following figure.
15

We use another data set is NYC AirBNB Rental data october2017. It has the
following attributes:
id
host_response_time
host_response_rate
host_is_superhost
host_has_profile_pic
neighbourhood_cleansed
latitude
longitude
is_location_exact
property_type
room_type
accommodates
bathrooms
bedrooms
beds
bed_type
amenities
square_feet
16
following attributes:
id
host_response_time
host_response_rate
host_is_superhost
host_has_profile_pic
neighbourhood_cleansed
latitude
longitude
is_location_exact
property_type
room_type
accommodates
bathrooms
bedrooms
beds
bed_type
amenities
square_feet
16
Secure Best Marks with AI Grader
Need help grading? Try our AI Grader for instant feedback on your assignments.

price
guests_included
minimum_nights
maximum_nights
calendar_updated
availability_30
number_of_reviews
review_scores_rating
instant_bookable
is_business_travel_ready
cancellation_policy
require_guest_profile_picture
reviews_per_month
It is illustrated below.
3. Data Analysis Method
Here, we will use a Business Intelligence tool to analyze AirBNB properties; data. So,
we use SPSS business intelligence tool for this purpose. To do data analysis on SPSS, the
following steps must be followed (The Balance, 2019),
First, open SPSS and upload the listing of all AirBNB properties data by clicking on File >
Import > CSV, which is illustrated below.
17

The complete listing of all AirBNB properties is shown below.
Next, we will choose the analysis method as, “Descriptive statistics”. To do
descriptive statistics click on analyze > descriptive > frequencies. It is illustrated below.
18
Next, we will choose the analysis method as, “Descriptive statistics”. To do
descriptive statistics click on analyze > descriptive > frequencies. It is illustrated below.
18

The output of descriptive statistics is illustrated below.
Statistics
property_type
host_total_listi
ngs_count room_type
N Valid 31858 9247 31858
Missing 0 22611 0
property_type
Frequency Percent Valid Percent
Cumulative
Percent
Valid 22592 70.9 70.9 70.9
Apartment 5081 15.9 15.9 86.9
Bed & Breakfast 229 .7 .7 87.6
Boat 16 .1 .1 87.6
Boutique hotel 11 .0 .0 87.7
Bungalow 74 .2 .2 87.9
Cabin 33 .1 .1 88.0
Camper/RV 8 .0 .0 88.0
Castle 2 .0 .0 88.0
Chalet 3 .0 .0 88.0
Condominium 13 .0 .0 88.1
Dorm 53 .2 .2 88.3
Earth House 5 .0 .0 88.3
19
Paraphrase This Document
Need a fresh take? Get an instant paraphrase of this document with our AI Paraphraser
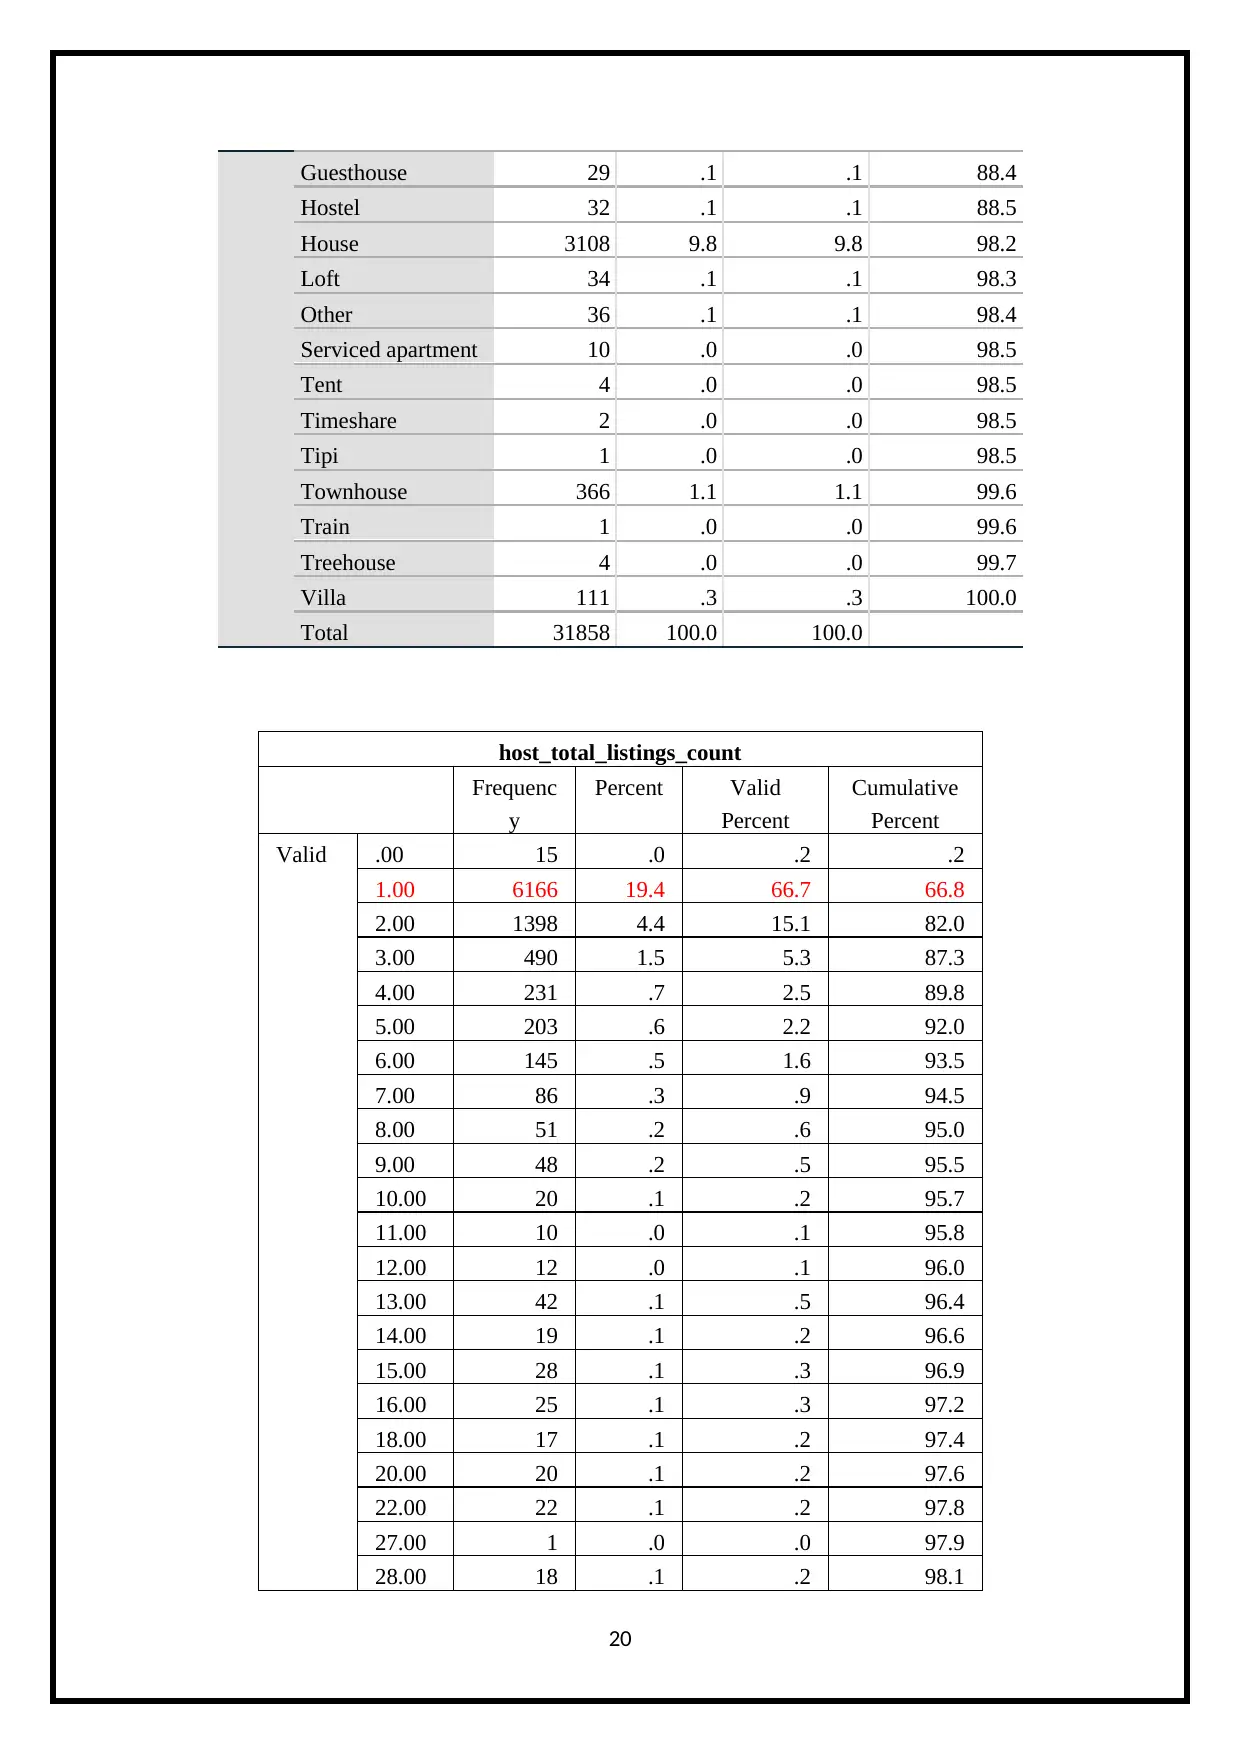
Guesthouse 29 .1 .1 88.4
Hostel 32 .1 .1 88.5
House 3108 9.8 9.8 98.2
Loft 34 .1 .1 98.3
Other 36 .1 .1 98.4
Serviced apartment 10 .0 .0 98.5
Tent 4 .0 .0 98.5
Timeshare 2 .0 .0 98.5
Tipi 1 .0 .0 98.5
Townhouse 366 1.1 1.1 99.6
Train 1 .0 .0 99.6
Treehouse 4 .0 .0 99.7
Villa 111 .3 .3 100.0
Total 31858 100.0 100.0
host_total_listings_count
Frequenc
y
Percent Valid
Percent
Cumulative
Percent
Valid .00 15 .0 .2 .2
1.00 6166 19.4 66.7 66.8
2.00 1398 4.4 15.1 82.0
3.00 490 1.5 5.3 87.3
4.00 231 .7 2.5 89.8
5.00 203 .6 2.2 92.0
6.00 145 .5 1.6 93.5
7.00 86 .3 .9 94.5
8.00 51 .2 .6 95.0
9.00 48 .2 .5 95.5
10.00 20 .1 .2 95.7
11.00 10 .0 .1 95.8
12.00 12 .0 .1 96.0
13.00 42 .1 .5 96.4
14.00 19 .1 .2 96.6
15.00 28 .1 .3 96.9
16.00 25 .1 .3 97.2
18.00 17 .1 .2 97.4
20.00 20 .1 .2 97.6
22.00 22 .1 .2 97.8
27.00 1 .0 .0 97.9
28.00 18 .1 .2 98.1
20

29.00 20 .1 .2 98.3
33.00 2 .0 .0 98.3
44.00 24 .1 .3 98.6
47.00 3 .0 .0 98.6
57.00 1 .0 .0 98.6
67.00 67 .2 .7 99.3
68.00 62 .2 .7 100.0
84.00 1 .0 .0 100.0
Total 9247 29.0 100.0
Missin
g
Syste
m
22611 71.0
Total 31858 100.0
room_type
Frequenc
y
Percent Valid
Percent
Cumulative
Percent
Vali
d
22592 70.9 70.9 70.9
Entire
home/apt
5034 15.8 15.8 86.7
Private room 3939 12.4 12.4 99.1
Shared room 293 .9 .9 100.0
Total 31858 100.0 100.0
Based on SPSS output, the Apartment property is used to provide greatest return
investment and entire apartment is used to generate the highest return on investment, because
the entire apartment of room type has 5034 frequency compared to other room type which is
high and property type as Apartment has 5081 frequency compared to other property type
which is also high. So, Rachel is investing on Rental Apartment which gives the highest
return on investment.
21

References
Ahmed Sherif. (2016). Practical Business Intelligence. Packt Publishing.
Battersby, A. (2019). Airbnb: a numbers guide for Melbournians raking in the dollars.
[online] The Age. Available at: https://www.theage.com.au/national/victoria/airbnb-a-
numbers-guide-for-melbournians-raking-in-the-dollars-20160114-gm5w9b.html [Accessed
27 May 2019].
Investment Property Tips | Mashvisor Real Estate Blog. (2019). Is Airbnb a Good Investment
Considering All of the Regulations? | Mashvisor. [online] Available at:
https://www.mashvisor.com/blog/is-airbnb-a-good-investment-regulations/ [Accessed 27
May 2019].
The Balance. (2019). The 8 Different Types of Real Estate Investments for New Investors.
[online] Available at: https://www.thebalance.com/different-types-of-real-estate-investments-
you-can-make-357986 [Accessed 27 May 2019].
Appendix
Another Data set Link --- https://www.kaggle.com/ivanovskia1/nyc-airbnb-rental-
data-october-2017/downloads/nyc-airbnb-rental-data-october-2017.zip/1
22
1 out of 22


Your All-in-One AI-Powered Toolkit for Academic Success.
+13062052269
info@desklib.com
Available 24*7 on WhatsApp / Email
![[object Object]](/_next/static/media/star-bottom.7253800d.svg)
Unlock your academic potential
© 2024 | Zucol Services PVT LTD | All rights reserved.