Using Data to Build Business Practice: Data Analysis Report, BSS004-1
VerifiedAdded on 2023/01/11
|20
|3255
|59
Report
AI Summary
This report analyzes data from the travel industry, focusing on the use of data to inform business decisions. The report explores data from both United Kingdom and overseas residents, using Excel for descriptive statistics and data visualization. The analysis includes exploration of general data, UK residents' data, and overseas residents' data, with subsets analyzed to compare variables. Pivot charts were used to generate meaningful charts and tables. The findings include insights into spending habits, travel purposes, and the relationship between sex and travel patterns. The report provides recommendations and conclusions based on the analysis, highlighting the importance of data-driven decision-making in the travel industry. The use of data to build business practice is well explained in the assignment.
USE OF DATA TO BUILD BUSINESS PRACTICE
The document describes how data can be used to make decisions and the importance of data
analysis in a travel business
By Student’s name
Course name
Lecturer’s name
Institution name
Date
The document describes how data can be used to make decisions and the importance of data
analysis in a travel business
By Student’s name
Course name
Lecturer’s name
Institution name
Date
Paraphrase This Document
Need a fresh take? Get an instant paraphrase of this document with our AI Paraphraser
Table of Contents
Introduction...............................................................................................................................................2
Exploration of data....................................................................................................................................2
General data;.........................................................................................................................................2
United Kingdom residents’ data;.........................................................................................................3
Overseas residents;................................................................................................................................4
Analysis in the subsets...............................................................................................................................5
Subset 1: United Kingdom residents....................................................................................................6
Subset 2: Overseas residents.................................................................................................................9
Recommendations...................................................................................................................................12
Conclusions..............................................................................................................................................13
References................................................................................................................................................14
Table of figures
Figure 1: Summary statistics on general data..............................................................................................3
Figure 2: Summary statistics from the UK Dataset......................................................................................4
Figure 3: Summary statistics from overseas residents.................................................................................5
Figure 4: Chart on totals..............................................................................................................................6
Figure 5: Chart on counts of package per age group....................................................................................6
Figure 6: Chart on spend and sex.................................................................................................................7
Figure 7: Chart on spend and purpose of visit.............................................................................................7
Figure 8: Chart on visit counts per sex........................................................................................................8
Figure 9: Chart on duration of stay in each sex level...................................................................................8
Figure 10: Package counts in each sex level................................................................................................9
Figure 11: Chart on duration counts in sex levels........................................................................................9
Figure 12: Package counts in sex levels.....................................................................................................10
Figure 13: Chart on total visits in sex levels..............................................................................................10
Figure 14: Total spend in sex levels..........................................................................................................11
Figure 15: Chart on total spend on each purpose.......................................................................................11
Figure 16: Package counts in age groups...................................................................................................12
Figure 17: Chart on totals..........................................................................................................................12
⊘ This is a preview!⊘
Do you want full access?
Subscribe today to unlock all pages.
Trusted by 1+ million students worldwide

Introduction
Every organization requires to predict its direction of flow and being in a position to accurately
know its positioning. It is for this reason that data analysis is important. Data collected by an
organization should be in a position to be used for decision making. In this paper, the travel
industry seeks to get some information and be in a position to chart the next move. This
information collected from both United Kingdom (UK) and Non-United Kingdom residents. The
data is coded into an Excel file which makes the framework of every conclusion that is submitted
in this paper.
Exploration of data
The data explored for descriptive statistics. There are a number of factors in this data. Some of
the most important measures to compute would be such as mode and mean mostly(Meyer and
Avery, 2009).
General data;
The most preferred means of transport was 1 (Mode 1). A lot of travelers preferred it to other
means. Most travelers also spent a duration of 2 days. The modal sex reported to travel was sex
1. The country destination that topped the list of most travelers was country 20. Most travelers
were overseas residents. Most of the travelers during trips are mainly on purpose 1 of visit. The
maximum amount reported to be used on spends was 215,872,953.955 while the minimum was
0.00. The mean amount used on spends was 2,622,175.577, for visits 3,919.998 and for nights
41,801.556.
The minimum duration of stay was 0 while the maximum duration was 9. The maximum visit
was 227,298.584 while the minimum visit was 54.825. The average nights were 41,801.556. The
Paraphrase This Document
Need a fresh take? Get an instant paraphrase of this document with our AI Paraphraser
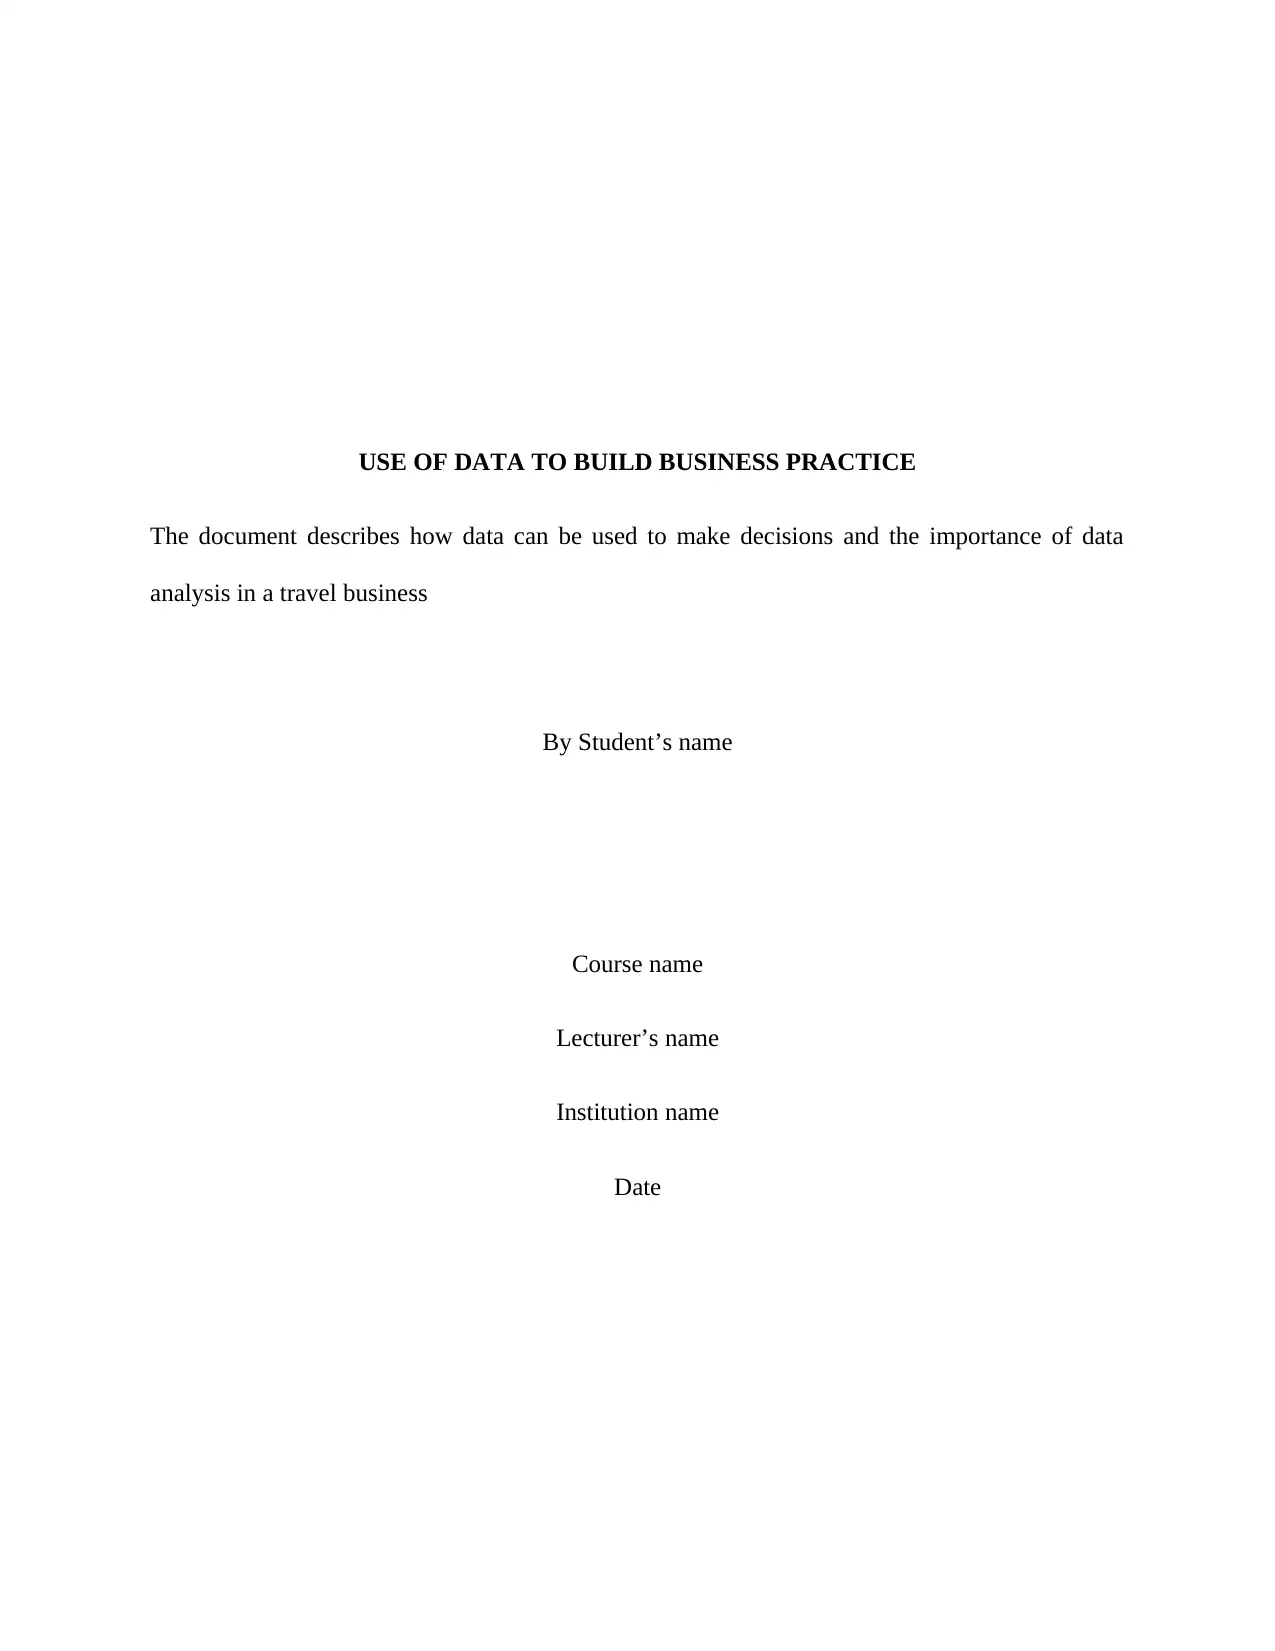
modal age group was age group 4. Data on the file had some #NA! and #NAME? characters
which were replaced with blanks explaining why some charts had ‘blank’ subdivision. It is
important for data to be in an easily encoded format for quick analysis(Karr, 2009). Due to the
nature and size of this dataset, pivot charts were most efficient in getting visual
representation(Hellerstein, 1985).
Figure 1: Summary statistics on general data
United Kingdom residents’ data;
It is very critical to obtain general statistics on the data before embarking on complex
analysis(Van Den Broeck et al., 2005). Excel has several formulas to compute these statistics
which are simple to compute(Guerrero, 2010). The modal duration of stay for the United
Kingdom residents was 2 with the maximum being 9 and the minimum being 0. The maximum
spend in this subset was 188,076,140.000 while the minimum was 0.000. The average spend was
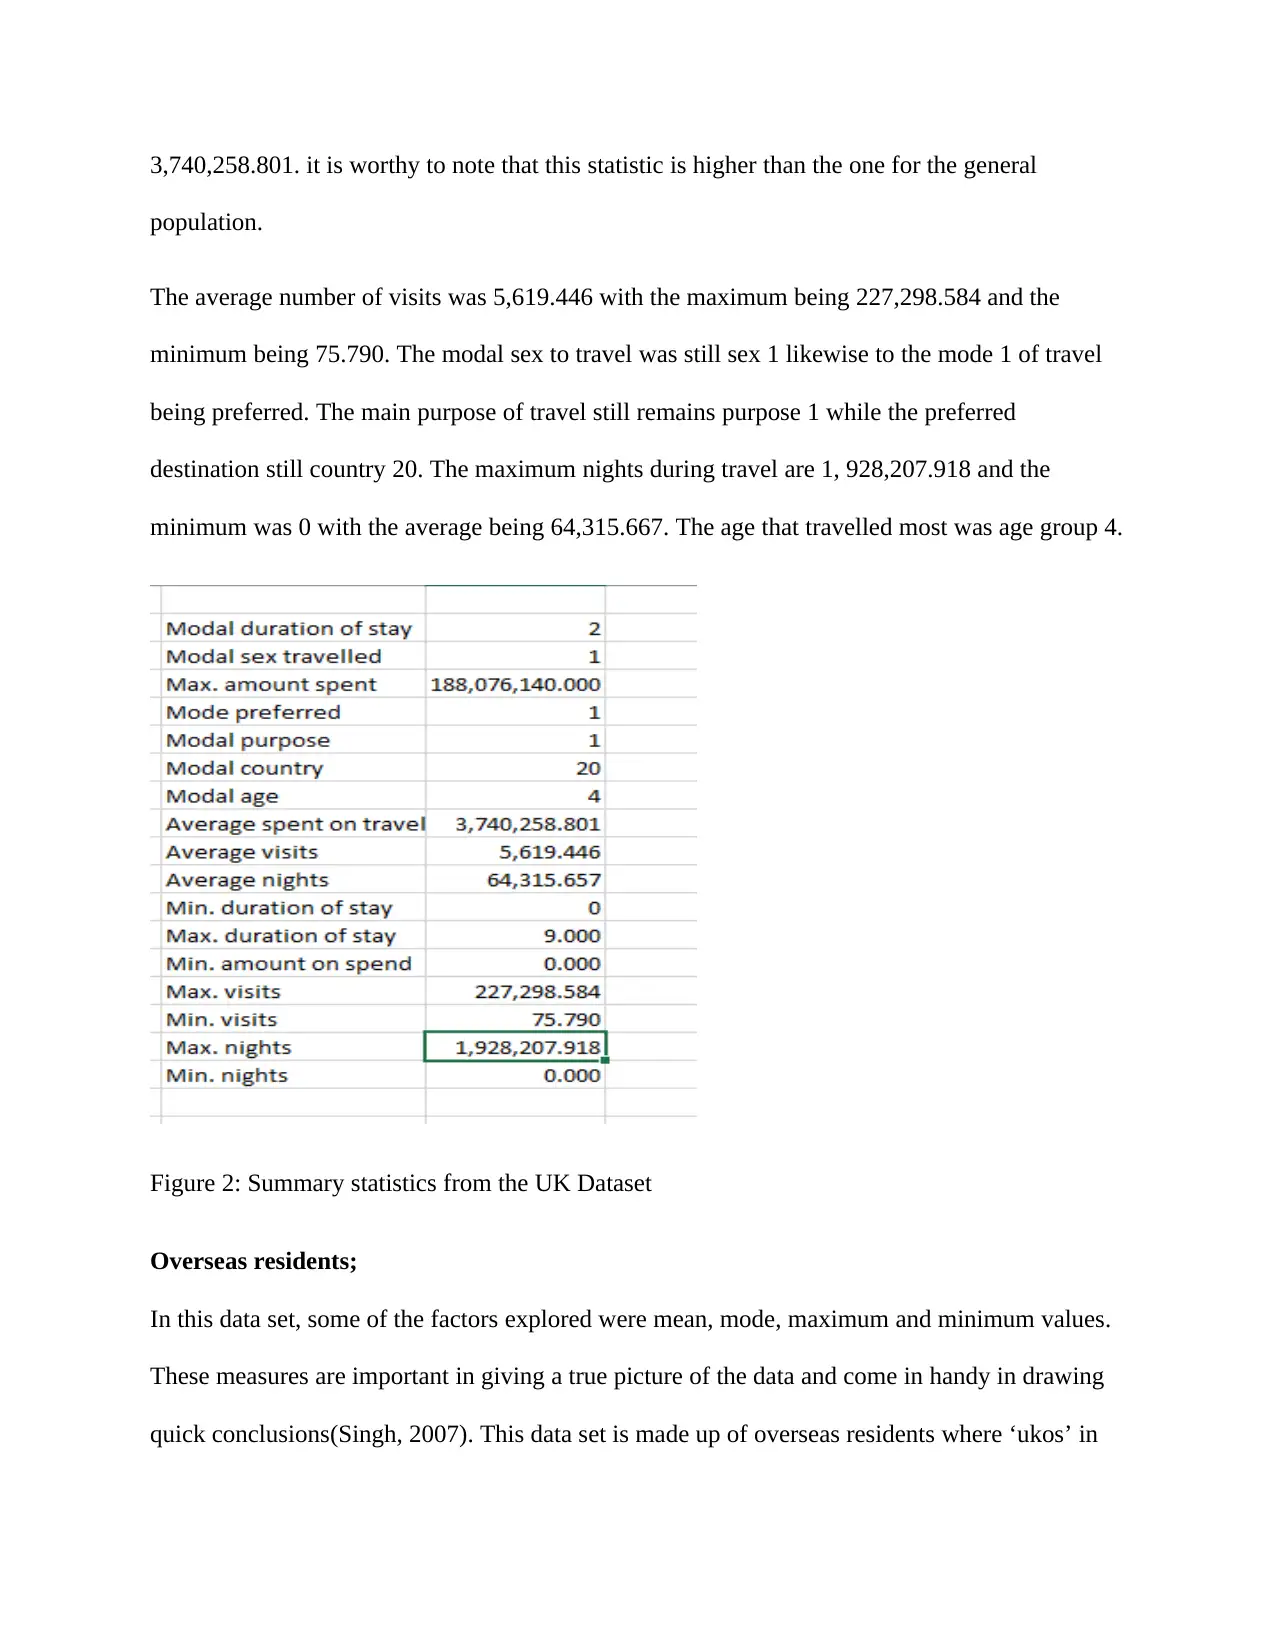
3,740,258.801. it is worthy to note that this statistic is higher than the one for the general
population.
The average number of visits was 5,619.446 with the maximum being 227,298.584 and the
minimum being 75.790. The modal sex to travel was still sex 1 likewise to the mode 1 of travel
being preferred. The main purpose of travel still remains purpose 1 while the preferred
destination still country 20. The maximum nights during travel are 1, 928,207.918 and the
minimum was 0 with the average being 64,315.667. The age that travelled most was age group 4.
Figure 2: Summary statistics from the UK Dataset
Overseas residents;
In this data set, some of the factors explored were mean, mode, maximum and minimum values.
These measures are important in giving a true picture of the data and come in handy in drawing
quick conclusions(Singh, 2007). This data set is made up of overseas residents where ‘ukos’ in
⊘ This is a preview!⊘
Do you want full access?
Subscribe today to unlock all pages.
Trusted by 1+ million students worldwide
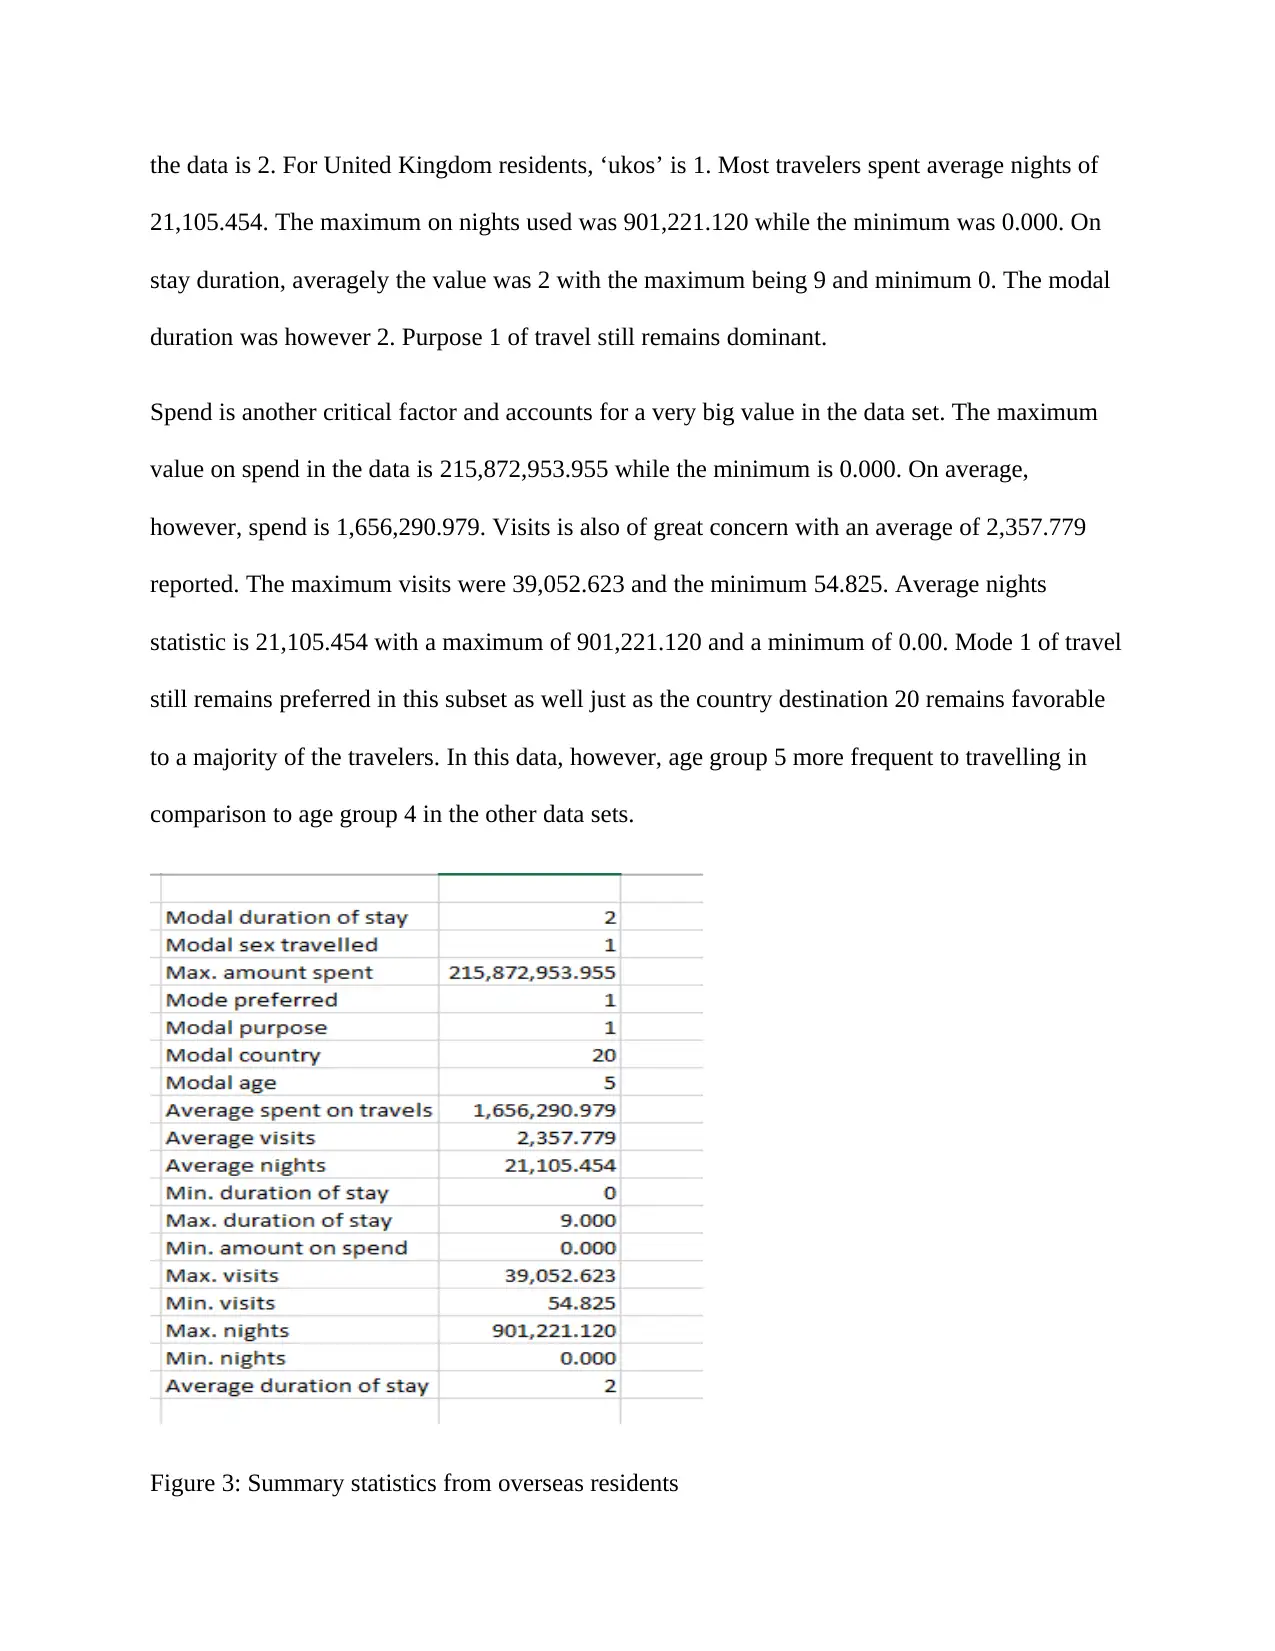
the data is 2. For United Kingdom residents, ‘ukos’ is 1. Most travelers spent average nights of
21,105.454. The maximum on nights used was 901,221.120 while the minimum was 0.000. On
stay duration, averagely the value was 2 with the maximum being 9 and minimum 0. The modal
duration was however 2. Purpose 1 of travel still remains dominant.
Spend is another critical factor and accounts for a very big value in the data set. The maximum
value on spend in the data is 215,872,953.955 while the minimum is 0.000. On average,
however, spend is 1,656,290.979. Visits is also of great concern with an average of 2,357.779
reported. The maximum visits were 39,052.623 and the minimum 54.825. Average nights
statistic is 21,105.454 with a maximum of 901,221.120 and a minimum of 0.00. Mode 1 of travel
still remains preferred in this subset as well just as the country destination 20 remains favorable
to a majority of the travelers. In this data, however, age group 5 more frequent to travelling in
comparison to age group 4 in the other data sets.
Figure 3: Summary statistics from overseas residents
Paraphrase This Document
Need a fresh take? Get an instant paraphrase of this document with our AI Paraphraser
Analysis in the subsets
Further on, detailed analysis done on comparing different variables. Use of the usual charts in
Excel was not helpful in getting meaningful tables for analysis(Singh, 2007). For that reason, use
of Pivot charts became handy in generating of charts(Palocsay, Markham and Markham, 2010).
Another reason as to why Pivot tables favored was because the variables were in more than one
level(Miller, 2014). Purpose for instance had two levels. Age was categorized into groups which
were then coded to 7.
Subset 1: United Kingdom residents
Total
0
2000000000
4000000000
6000000000
8000000000
10000000000
12000000000
14000000000
16000000000
18000000000
Chart on totals
Sum of spend
Sum of visits
Sum of nights
Sum
Figure 4: Chart on totals
The totals on spend, nights and visits obtained and observed in a chart as shown above. From the
chart, it is evident that spend accounts for a very large percentage. It can be seen that its bar
overshadows the bars on visits and nights which are almost negligible.
1
1 2 1
2 2 1
3 2 1
4 2 1
5 2 1
6 2 1
7 2 1
9 2
0
100
200
300
400
500
600
700
Chart on package counts per age group
Total
Packages in each age group
Axis Title
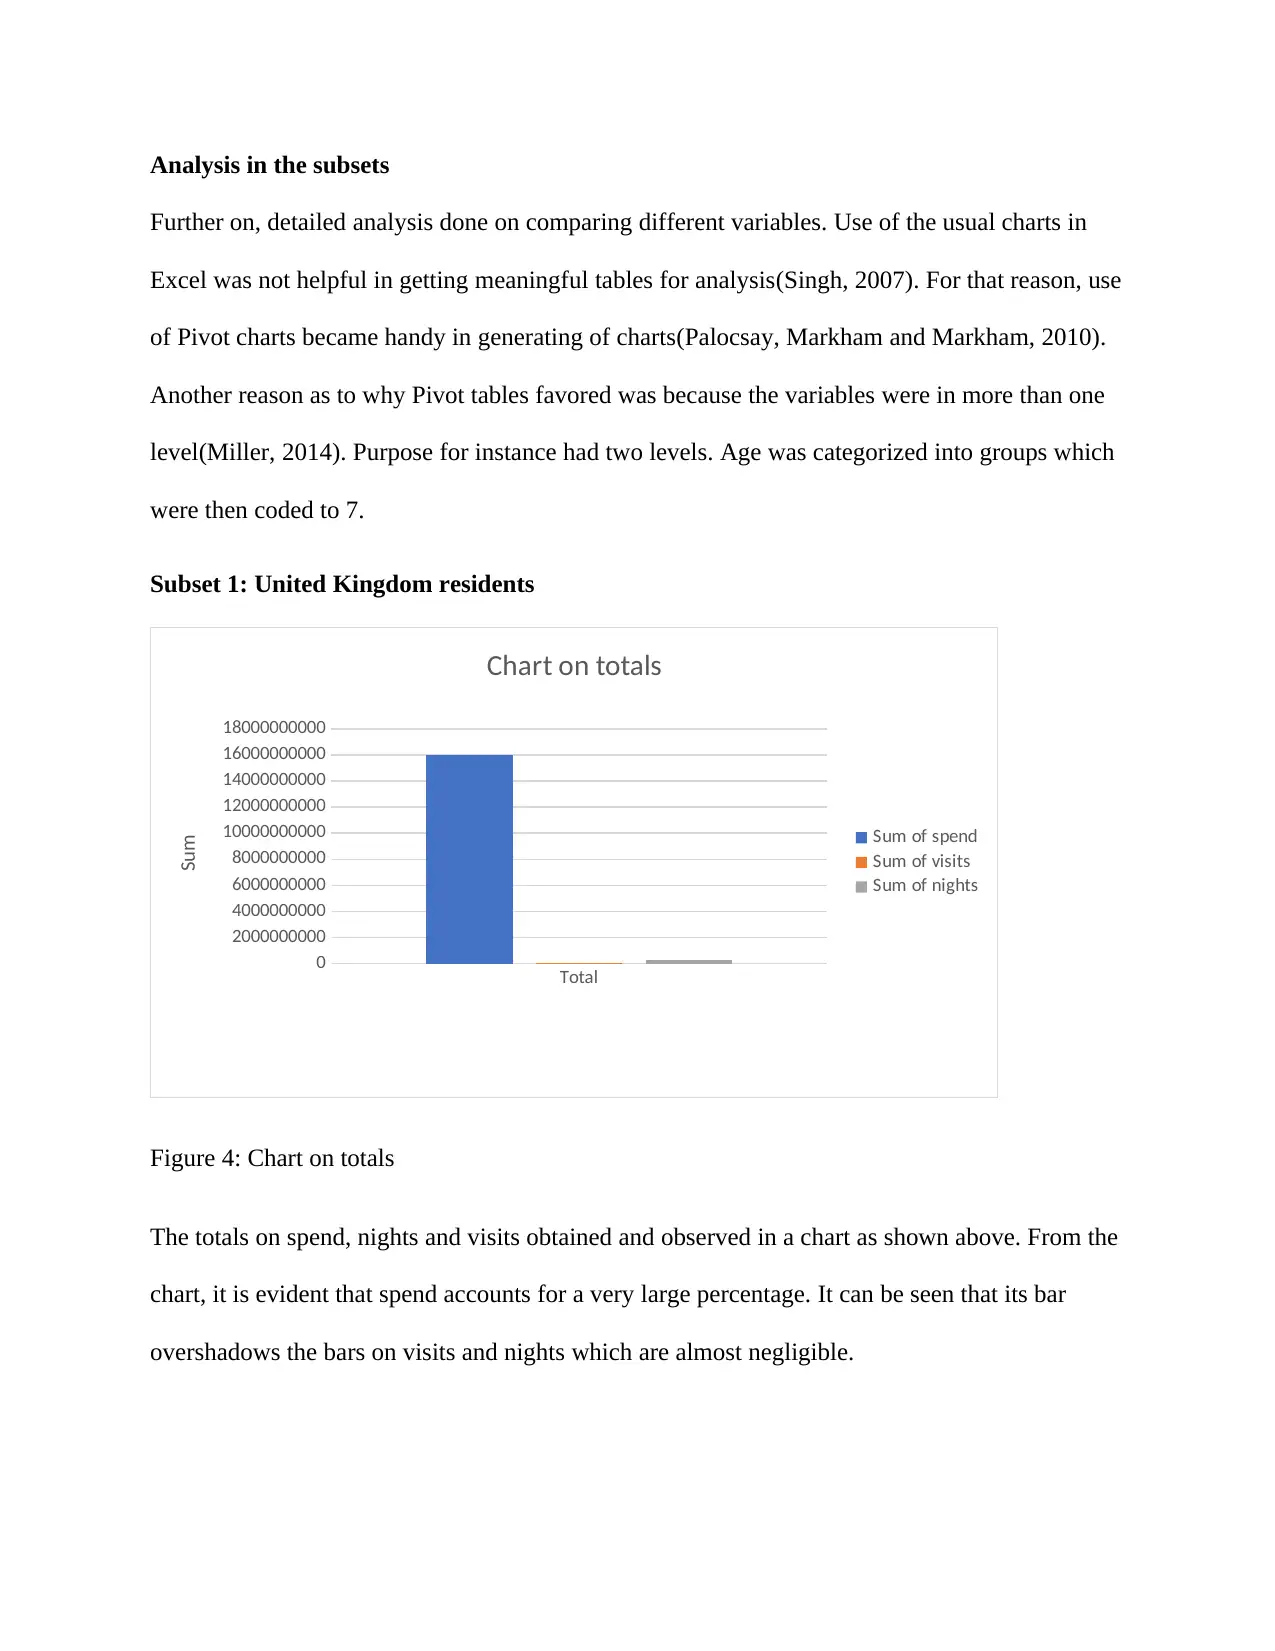
Figure 5: Chart on counts of package per age group
In the chart above, it can be seen that the counts for package 1 overshadow counts of package 2
in all the age groups 1, 2 till 9. In age group 4, the count for package 1 is highest but is however
close to age group 3. The count of both packages is lowest in age group 9. The counts for
package 2 are however closely clustered at around the same place with an exception at age group
9.
(blank) 1 2 9
0
1000000000
2000000000
3000000000
4000000000
5000000000
6000000000
7000000000
8000000000
9000000000
Chart on amount spent and respective sex
Total
Linear (Total)
Sex
Spend sum
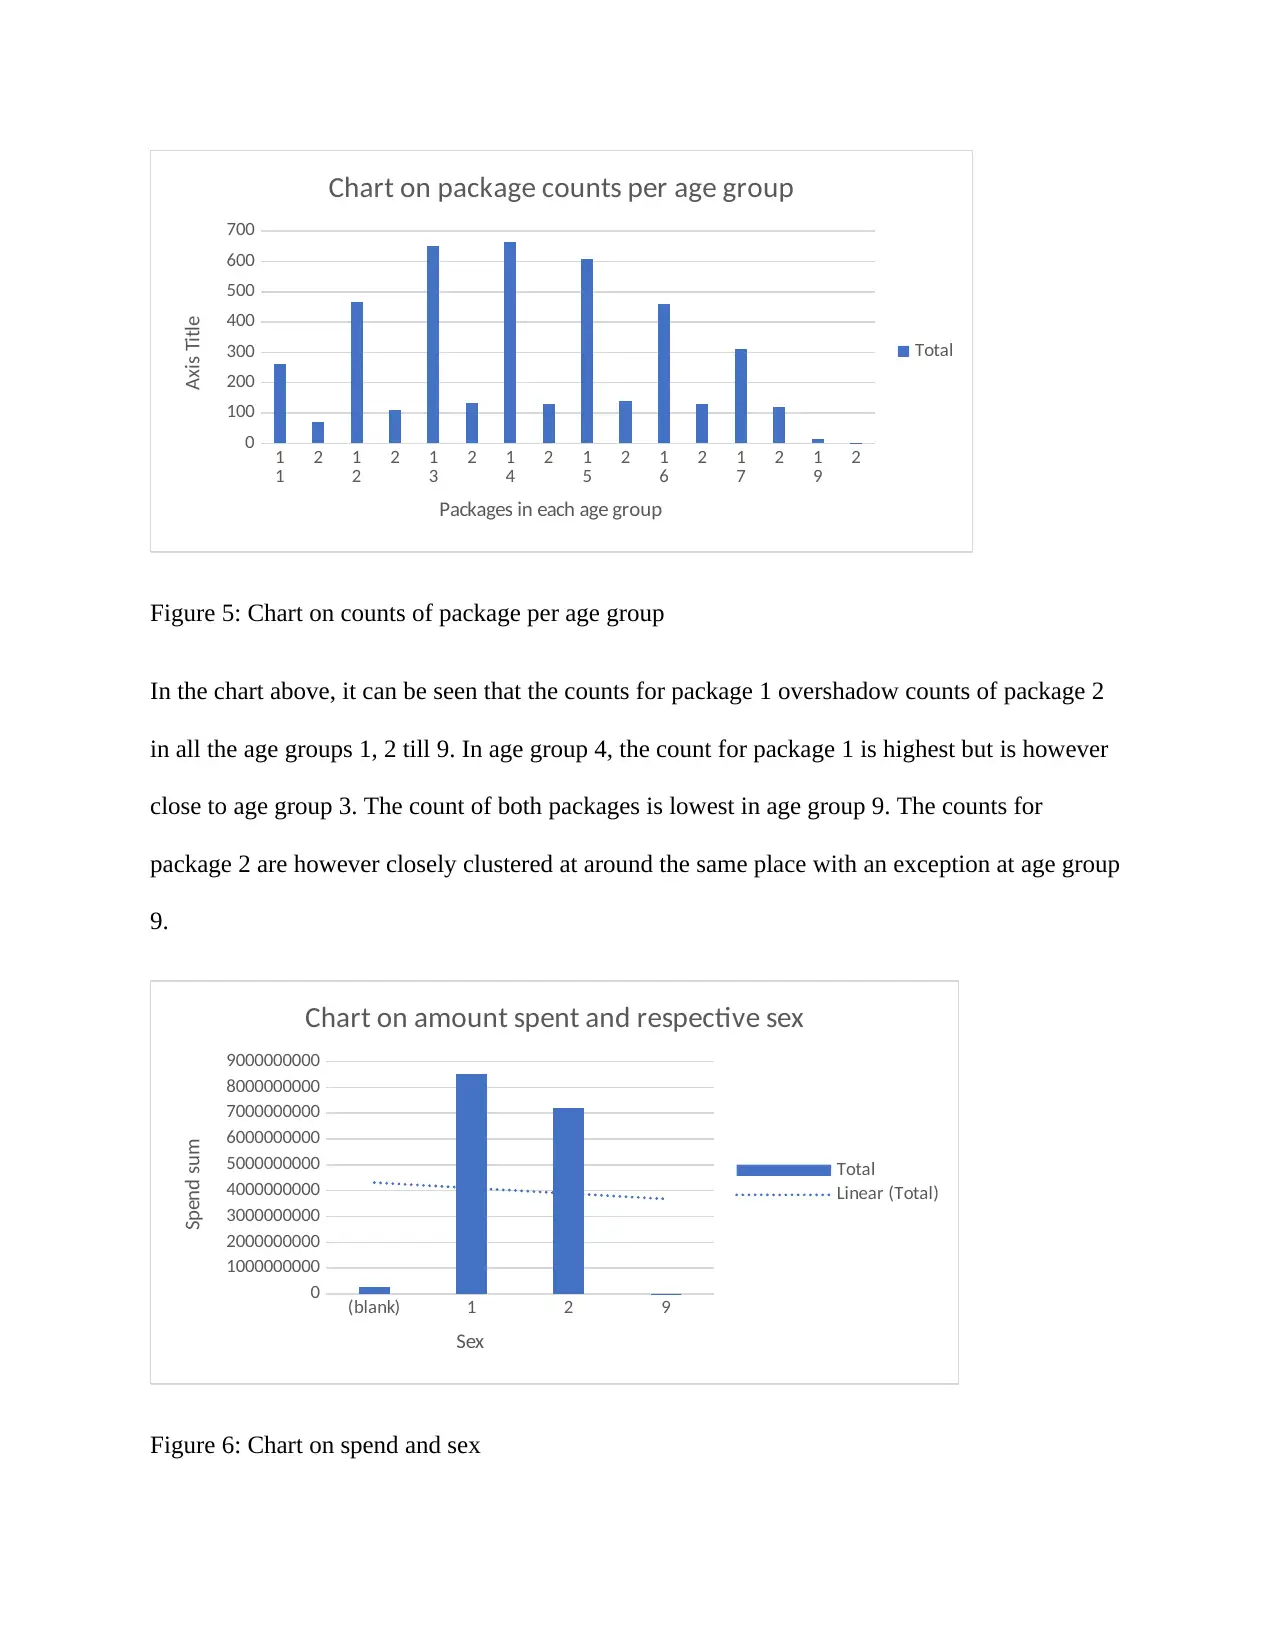
Figure 6: Chart on spend and sex
1 2 1
2 2 1
3 2 1
4 2 1
5 2 1
6 2 1
7 2 1
9 2
0
100
200
300
400
500
600
700
Chart on package counts per age group
Total
Packages in each age group
Axis Title
Figure 5: Chart on counts of package per age group
In the chart above, it can be seen that the counts for package 1 overshadow counts of package 2
in all the age groups 1, 2 till 9. In age group 4, the count for package 1 is highest but is however
close to age group 3. The count of both packages is lowest in age group 9. The counts for
package 2 are however closely clustered at around the same place with an exception at age group
9.
(blank) 1 2 9
0
1000000000
2000000000
3000000000
4000000000
5000000000
6000000000
7000000000
8000000000
9000000000
Chart on amount spent and respective sex
Total
Linear (Total)
Sex
Spend sum
Figure 6: Chart on spend and sex
⊘ This is a preview!⊘
Do you want full access?
Subscribe today to unlock all pages.
Trusted by 1+ million students worldwide
The chart above takes into account how much spend used when compared to sex in all its levels.
It is clearly visible that sex 1 has a higher spend compared to sex 2. The trendline also depicts
that negative linear relationship where sex 2 has a lower spend than sex 1.
1 2 3 4 5
0
2000000000
4000000000
6000000000
8000000000
10000000000
12000000000
14000000000
Chart on purpose and spend
Total
Purpose
Total spend
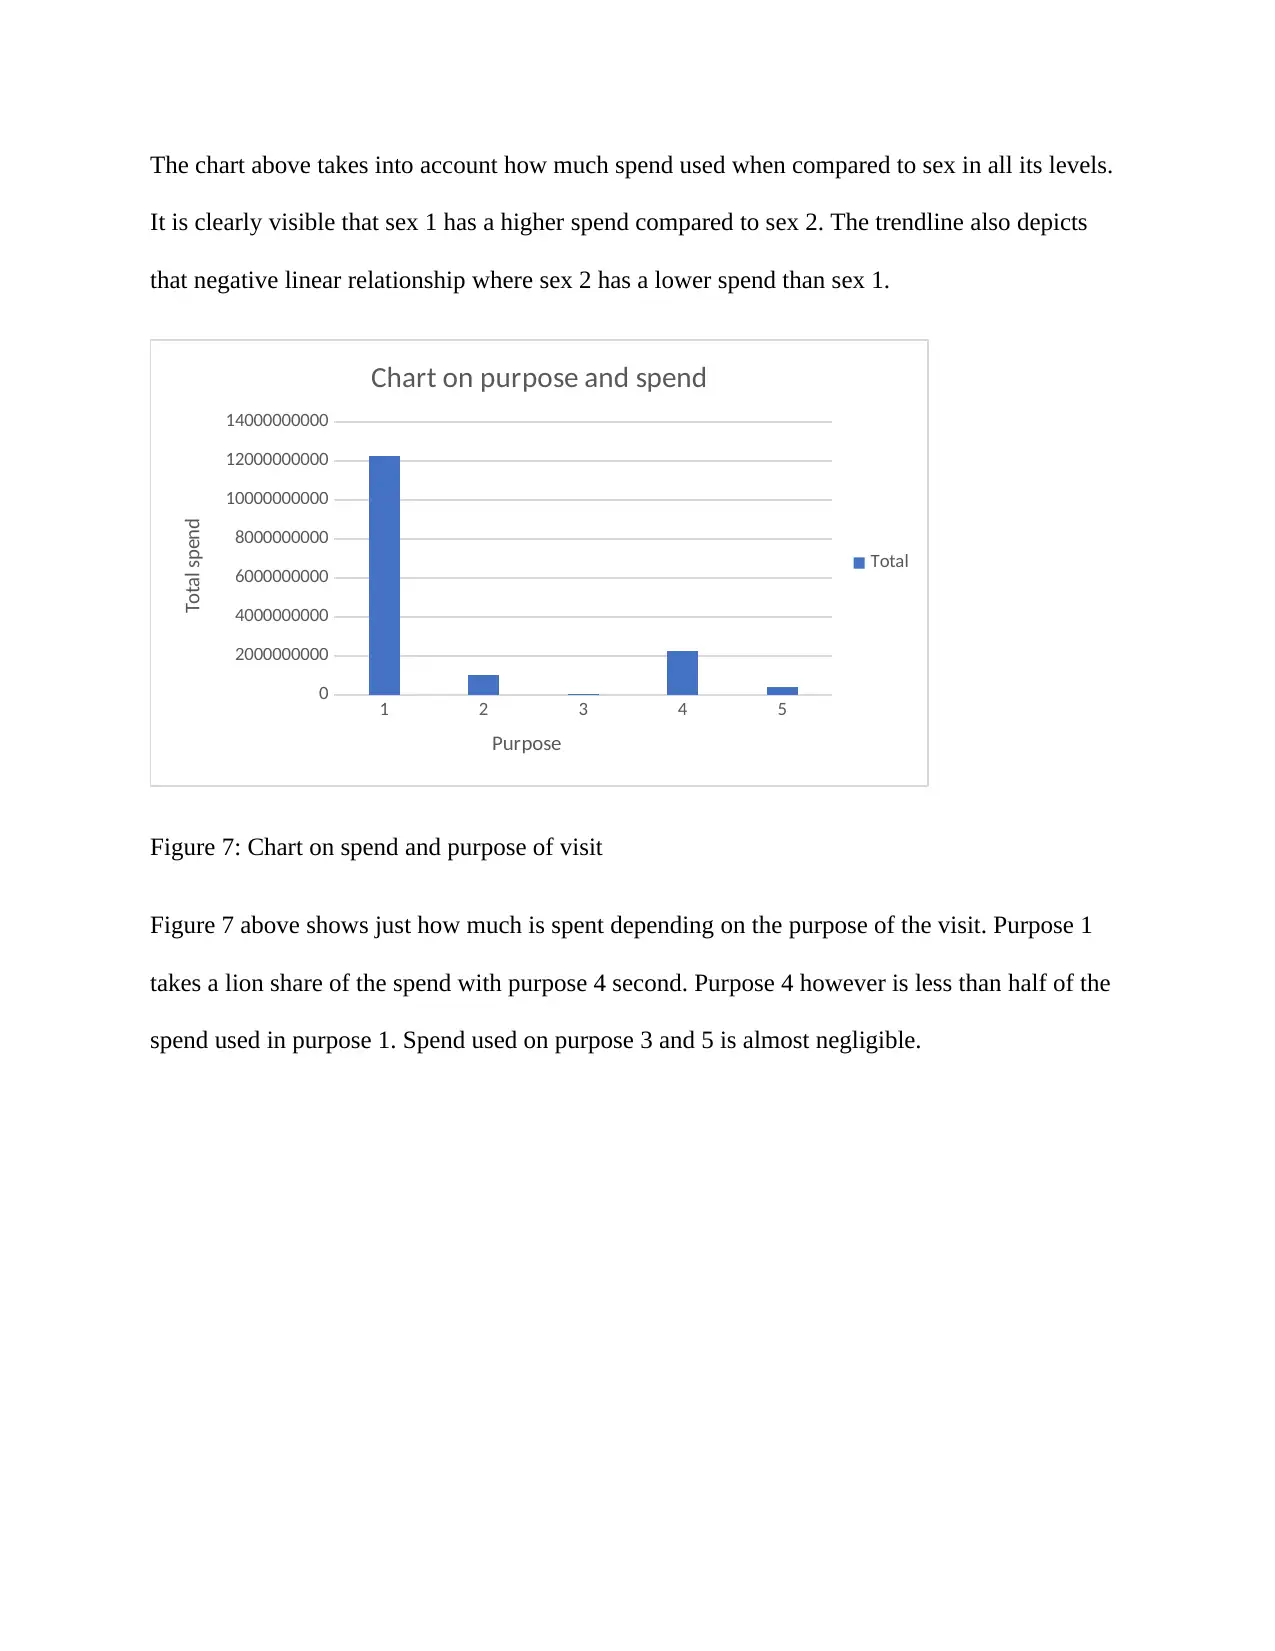
Figure 7: Chart on spend and purpose of visit
Figure 7 above shows just how much is spent depending on the purpose of the visit. Purpose 1
takes a lion share of the spend with purpose 4 second. Purpose 4 however is less than half of the
spend used in purpose 1. Spend used on purpose 3 and 5 is almost negligible.
It is clearly visible that sex 1 has a higher spend compared to sex 2. The trendline also depicts
that negative linear relationship where sex 2 has a lower spend than sex 1.
1 2 3 4 5
0
2000000000
4000000000
6000000000
8000000000
10000000000
12000000000
14000000000
Chart on purpose and spend
Total
Purpose
Total spend
Figure 7: Chart on spend and purpose of visit
Figure 7 above shows just how much is spent depending on the purpose of the visit. Purpose 1
takes a lion share of the spend with purpose 4 second. Purpose 4 however is less than half of the
spend used in purpose 1. Spend used on purpose 3 and 5 is almost negligible.
Paraphrase This Document
Need a fresh take? Get an instant paraphrase of this document with our AI Paraphraser
(blank) 1 2 9
0
500
1000
1500
2000
2500
Sex and visits counts
Total
Sex
Counts
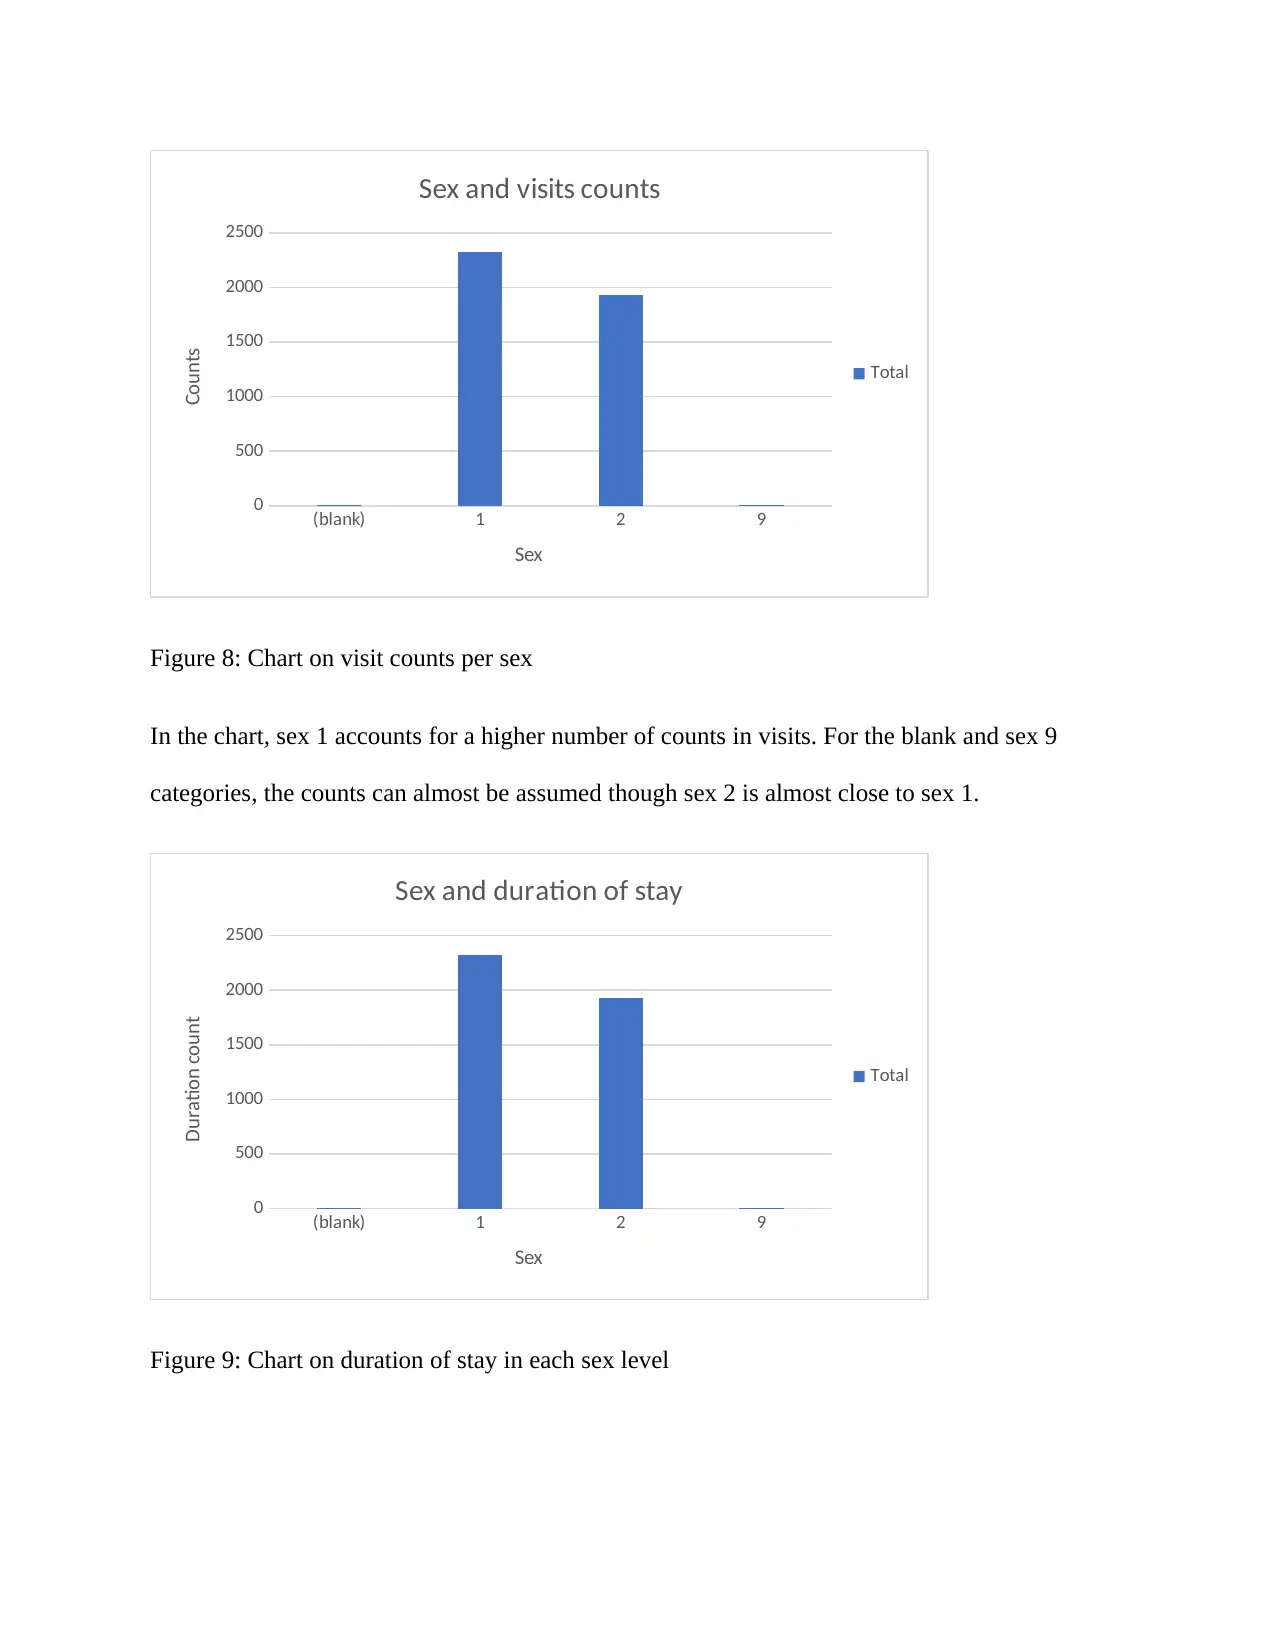
Figure 8: Chart on visit counts per sex
In the chart, sex 1 accounts for a higher number of counts in visits. For the blank and sex 9
categories, the counts can almost be assumed though sex 2 is almost close to sex 1.
(blank) 1 2 9
0
500
1000
1500
2000
2500
Sex and duration of stay
Total
Sex
Duration count
Figure 9: Chart on duration of stay in each sex level
0
500
1000
1500
2000
2500
Sex and visits counts
Total
Sex
Counts
Figure 8: Chart on visit counts per sex
In the chart, sex 1 accounts for a higher number of counts in visits. For the blank and sex 9
categories, the counts can almost be assumed though sex 2 is almost close to sex 1.
(blank) 1 2 9
0
500
1000
1500
2000
2500
Sex and duration of stay
Total
Sex
Duration count
Figure 9: Chart on duration of stay in each sex level
The chart above is similar to the previous chart. Sex 1 has a longer duration of stay compared to
sex 2. The blank and sex 9 have an extremely low count.
1
(blank) 2 1
1 2 1
2 2 1
9 2
0
500
1000
1500
2000
2500
Sex and package count
Total
Package counts in sex
Package counts
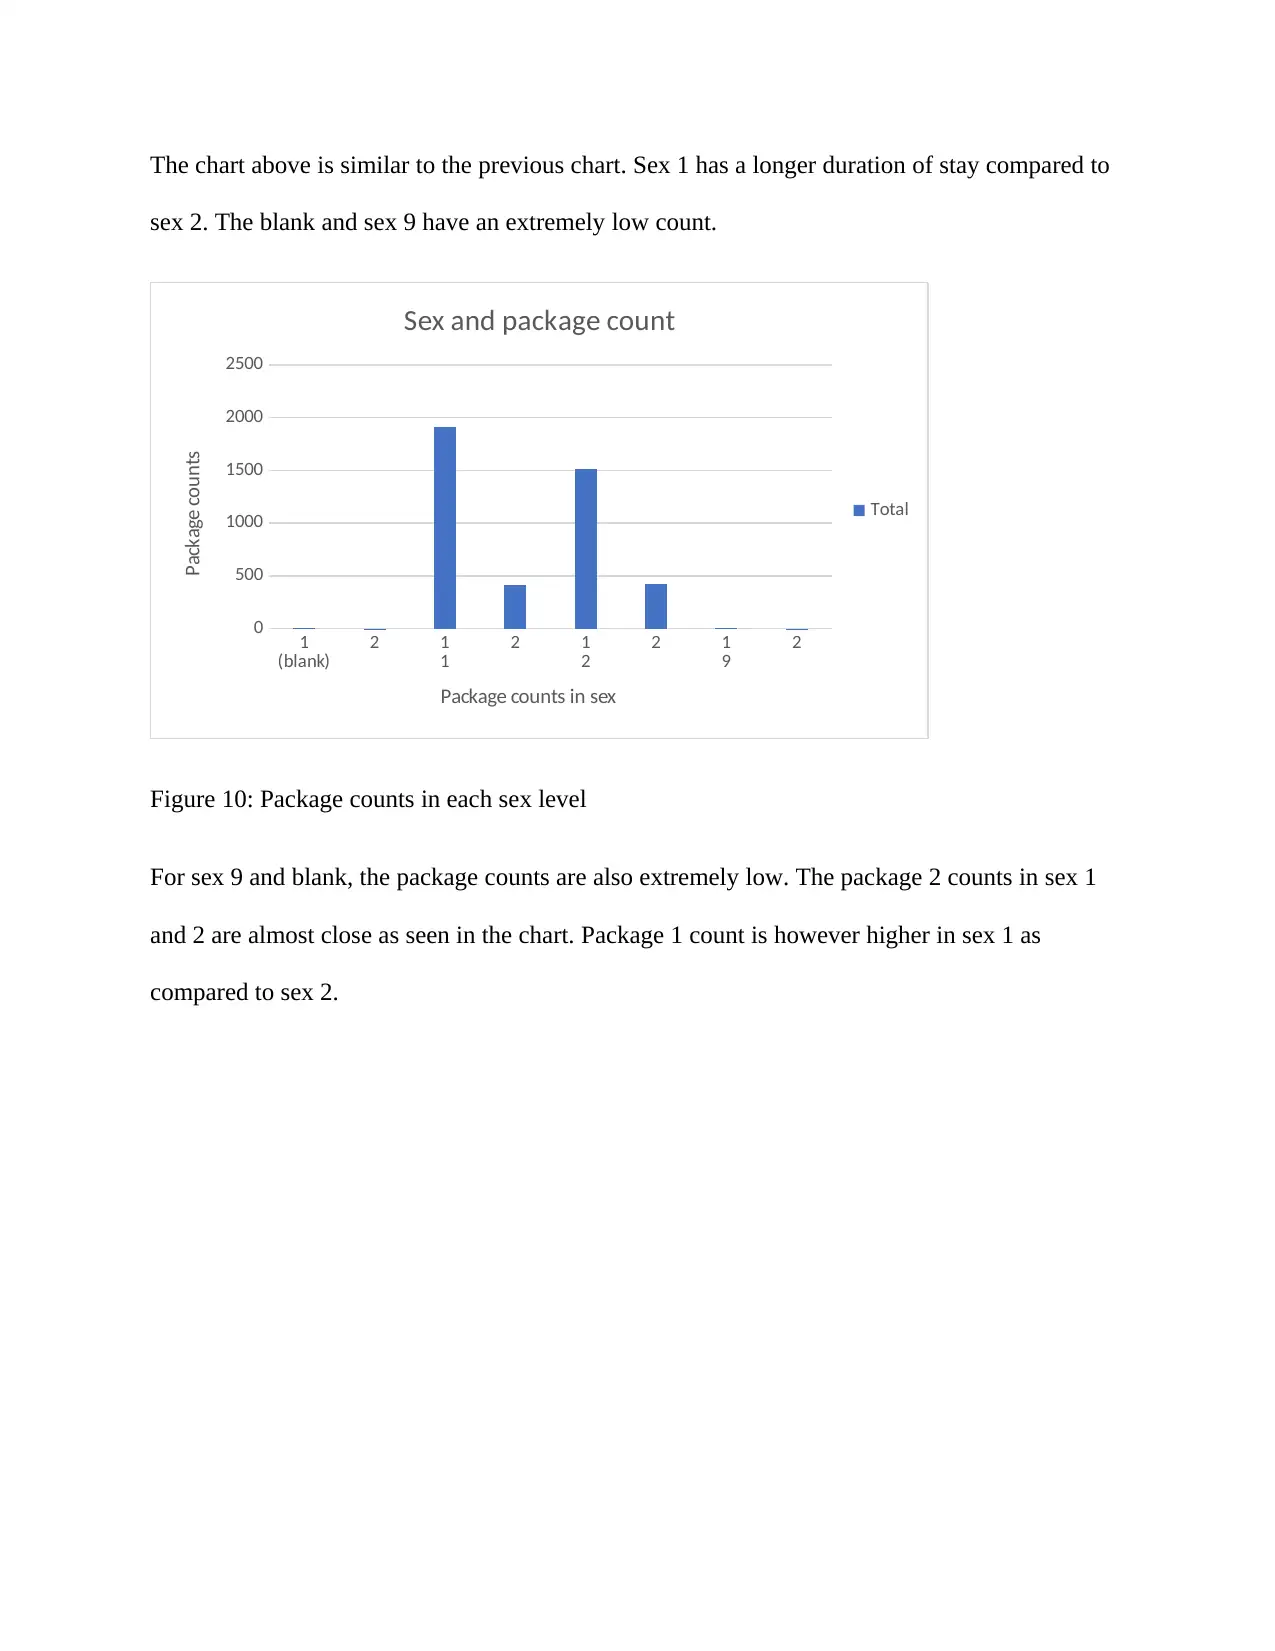
Figure 10: Package counts in each sex level
For sex 9 and blank, the package counts are also extremely low. The package 2 counts in sex 1
and 2 are almost close as seen in the chart. Package 1 count is however higher in sex 1 as
compared to sex 2.
sex 2. The blank and sex 9 have an extremely low count.
1
(blank) 2 1
1 2 1
2 2 1
9 2
0
500
1000
1500
2000
2500
Sex and package count
Total
Package counts in sex
Package counts
Figure 10: Package counts in each sex level
For sex 9 and blank, the package counts are also extremely low. The package 2 counts in sex 1
and 2 are almost close as seen in the chart. Package 1 count is however higher in sex 1 as
compared to sex 2.
⊘ This is a preview!⊘
Do you want full access?
Subscribe today to unlock all pages.
Trusted by 1+ million students worldwide
1 out of 20
Related Documents


Your All-in-One AI-Powered Toolkit for Academic Success.
+13062052269
info@desklib.com
Available 24*7 on WhatsApp / Email
![[object Object]](/_next/static/media/star-bottom.7253800d.svg)
Unlock your academic potential
Copyright © 2020–2026 A2Z Services. All Rights Reserved. Developed and managed by ZUCOL.