SPH 535 Exam 3: Quantitative & Qualitative Analysis in Public Health
VerifiedAdded on 2023/04/23
|17
|4892
|251
Homework Assignment
AI Summary
This document presents a student's completed examination for SPH 535, "Using and Creating Evidence in Public Health Practice," covering the Fall-Winter terms of the 2018-2019 academic year. The exam comprises three parts: Part A features multiple-choice questions on topics such as measurement scales, statistical concepts (standard error, Central Limit Theorem), and study design. Part B focuses on quantitative analyses, including hypothesis testing and statistical methods applied to an anorexia study dataset. Part C involves qualitative analyses, exploring approaches like thematic analysis and phenomenological analysis of textual evidence. The student's responses include annotated multiple-choice answers, Excel outputs for quantitative analyses, and answers to qualitative questions. The assignment demonstrates the student's understanding of applying statistical and qualitative methods in public health contexts. The student applied concepts of random assignment, hypothesis testing, and regression analysis. The student also considered the advantages and disadvantages of different study designs.
Student name:
ID number:
SPH 535
Using and Creating Evidence in Public Health Practice
Fall – Winter Terms (September 2018 – April 2019)
Examination #3
_____________________________________________________________________________
Ground Rules
This is a take-home, open book examination. Use any class materials (notes, readings)
and/or materials from other coursework, or articles and resources that you have acquired
on your own to write a thoughtful and complete answer to the questions
All submitted exams must be typed. Please follow the same guidelines as provided for
written assignments.
Work individually (i.e., no group discussion is allowed)
Use reference citations (either from assigned readings or other sources) whenever
appropriate. If you do, make sure to include a reference list at the end of your examination
A discussion forum has been created on eClass for you to pose any questions you may have
as you complete the exam
_____________________________________________________________________________
Evaluation
This examination will be scored out of 50 marks, using the following criteria:
Part A (Multiple Choice Questions) = 15 marks (total; 1 mark available for each of 15 questions)
Part B (Quantitative Analyses) = 20 marks (total)
Part C (Qualitative Analyses) = 15 marks (total)
_____________________________________________________________________________
Submit this document, containing annotated multiple choice answers for Part A, and your
answers to Parts B and C through the eClass dropbox labeled for this examination.
Submissions through eClass will close at 11:55 pm Mountain Standard Time on March 3, 2019.
Late exams will not be accepted.
-1-
Paraphrase This Document
Need a fresh take? Get an instant paraphrase of this document with our AI Paraphraser
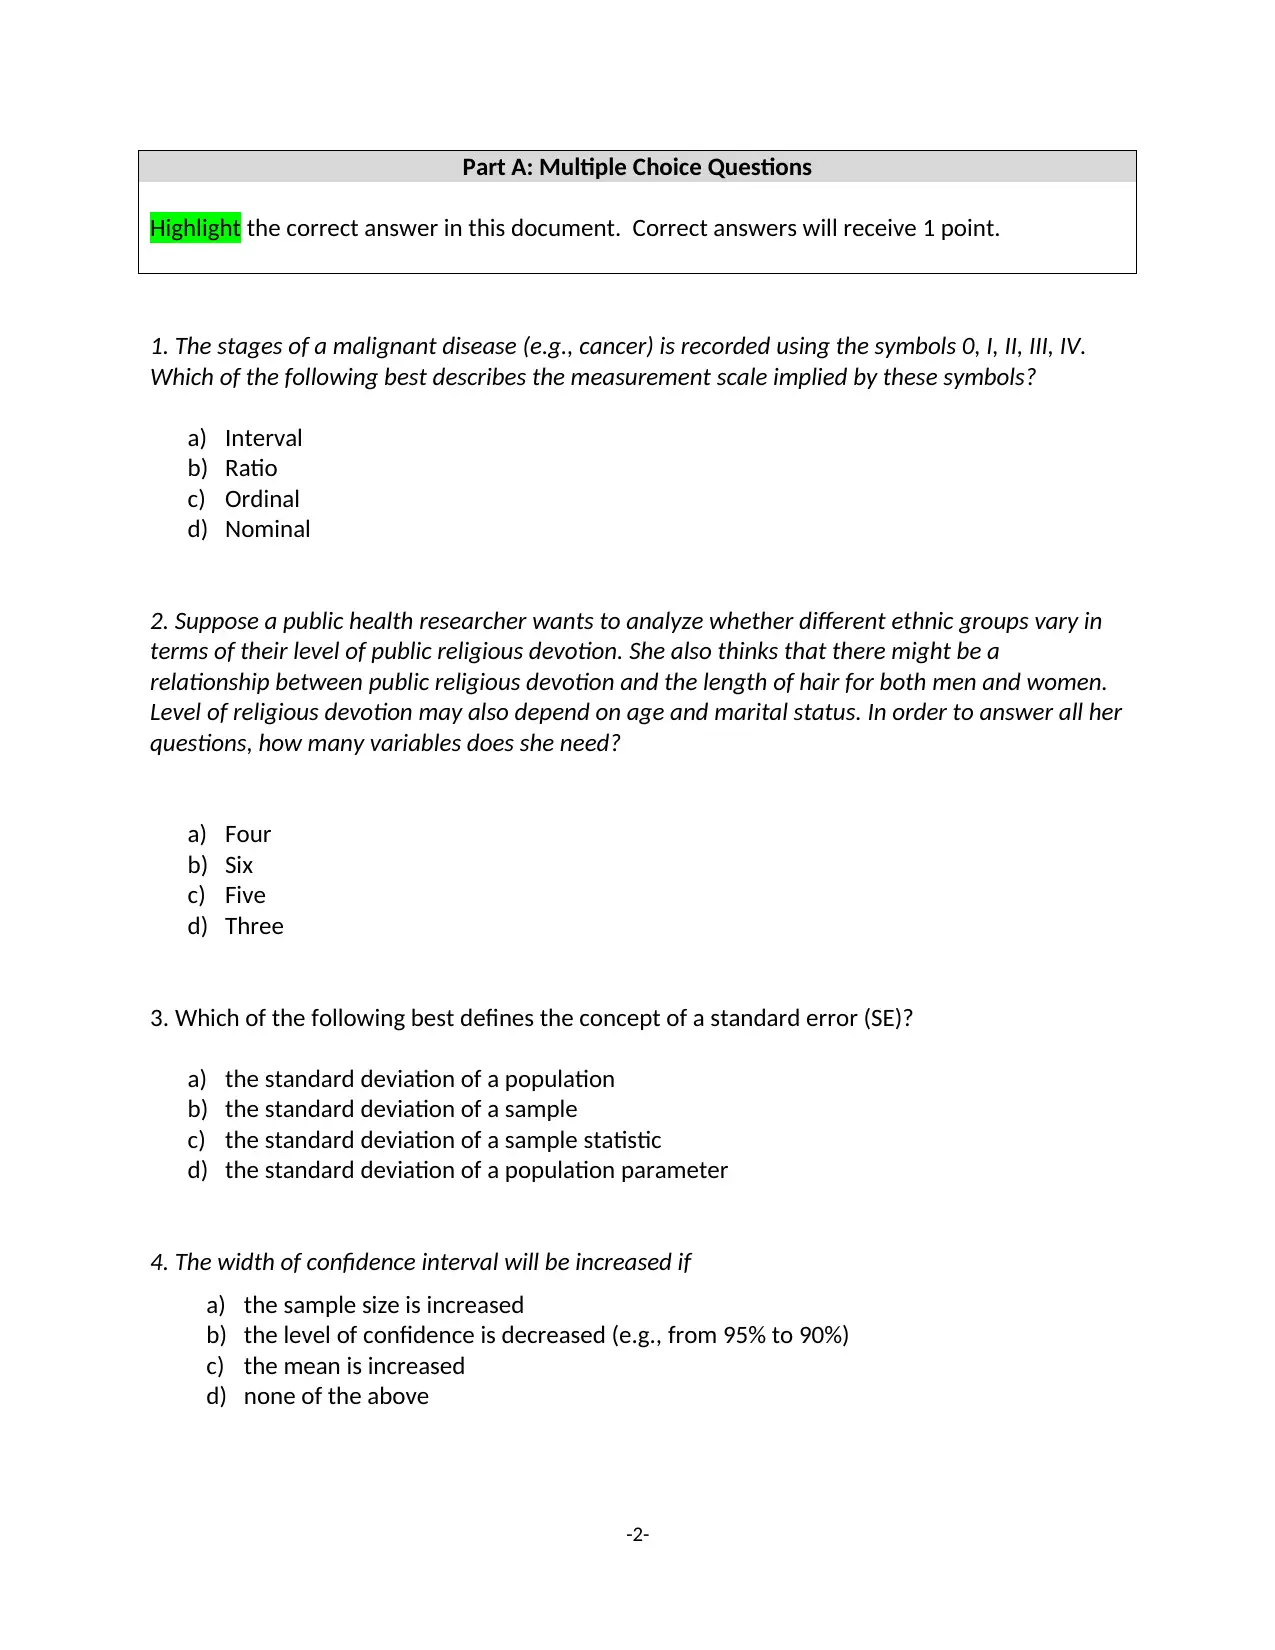
Part A: Multiple Choice Questions
Highlight the correct answer in this document. Correct answers will receive 1 point.
1. The stages of a malignant disease (e.g., cancer) is recorded using the symbols 0, I, II, III, IV.
Which of the following best describes the measurement scale implied by these symbols?
a) Interval
b) Ratio
c) Ordinal
d) Nominal
2. Suppose a public health researcher wants to analyze whether different ethnic groups vary in
terms of their level of public religious devotion. She also thinks that there might be a
relationship between public religious devotion and the length of hair for both men and women.
Level of religious devotion may also depend on age and marital status. In order to answer all her
questions, how many variables does she need?
a) Four
b) Six
c) Five
d) Three
3. Which of the following best defines the concept of a standard error (SE)?
a) the standard deviation of a population
b) the standard deviation of a sample
c) the standard deviation of a sample statistic
d) the standard deviation of a population parameter
4. The width of confidence interval will be increased if
a) the sample size is increased
b) the level of confidence is decreased (e.g., from 95% to 90%)
c) the mean is increased
d) none of the above
-2-
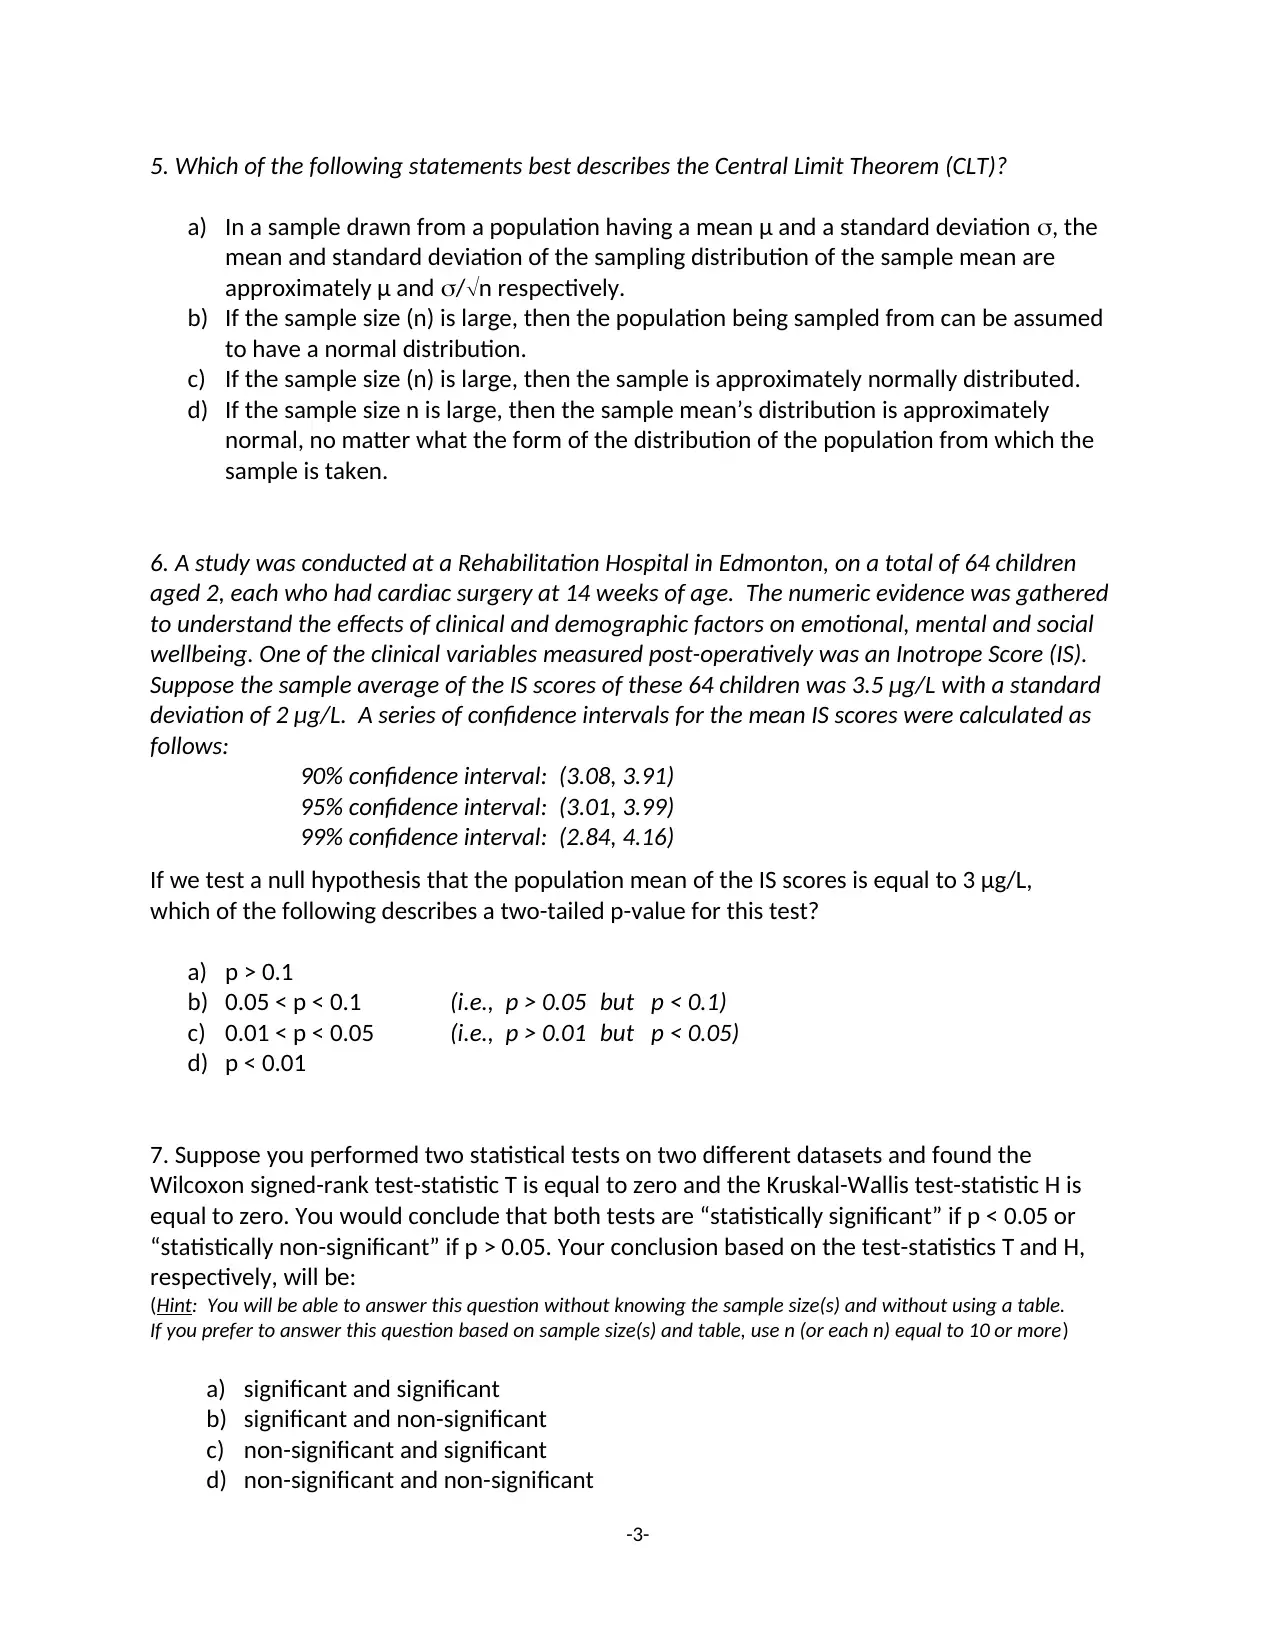
5. Which of the following statements best describes the Central Limit Theorem (CLT)?
a) In a sample drawn from a population having a mean μ and a standard deviation , the
mean and standard deviation of the sampling distribution of the sample mean are
approximately μ and /n respectively.
b) If the sample size (n) is large, then the population being sampled from can be assumed
to have a normal distribution.
c) If the sample size (n) is large, then the sample is approximately normally distributed.
d) If the sample size n is large, then the sample mean’s distribution is approximately
normal, no matter what the form of the distribution of the population from which the
sample is taken.
6. A study was conducted at a Rehabilitation Hospital in Edmonton, on a total of 64 children
aged 2, each who had cardiac surgery at 14 weeks of age. The numeric evidence was gathered
to understand the effects of clinical and demographic factors on emotional, mental and social
wellbeing. One of the clinical variables measured post-operatively was an Inotrope Score (IS).
Suppose the sample average of the IS scores of these 64 children was 3.5 μg/L with a standard
deviation of 2 μg/L. A series of confidence intervals for the mean IS scores were calculated as
follows:
90% confidence interval: (3.08, 3.91)
95% confidence interval: (3.01, 3.99)
99% confidence interval: (2.84, 4.16)
If we test a null hypothesis that the population mean of the IS scores is equal to 3 μg/L,
which of the following describes a two-tailed p-value for this test?
a) p > 0.1
b) 0.05 < p < 0.1 (i.e., p > 0.05 but p < 0.1)
c) 0.01 < p < 0.05 (i.e., p > 0.01 but p < 0.05)
d) p < 0.01
7. Suppose you performed two statistical tests on two different datasets and found the
Wilcoxon signed-rank test-statistic T is equal to zero and the Kruskal-Wallis test-statistic H is
equal to zero. You would conclude that both tests are “statistically significant” if p < 0.05 or
“statistically non-significant” if p > 0.05. Your conclusion based on the test-statistics T and H,
respectively, will be:
(Hint: You will be able to answer this question without knowing the sample size(s) and without using a table.
If you prefer to answer this question based on sample size(s) and table, use n (or each n) equal to 10 or more)
a) significant and significant
b) significant and non-significant
c) non-significant and significant
d) non-significant and non-significant
-3-
⊘ This is a preview!⊘
Do you want full access?
Subscribe today to unlock all pages.
Trusted by 1+ million students worldwide
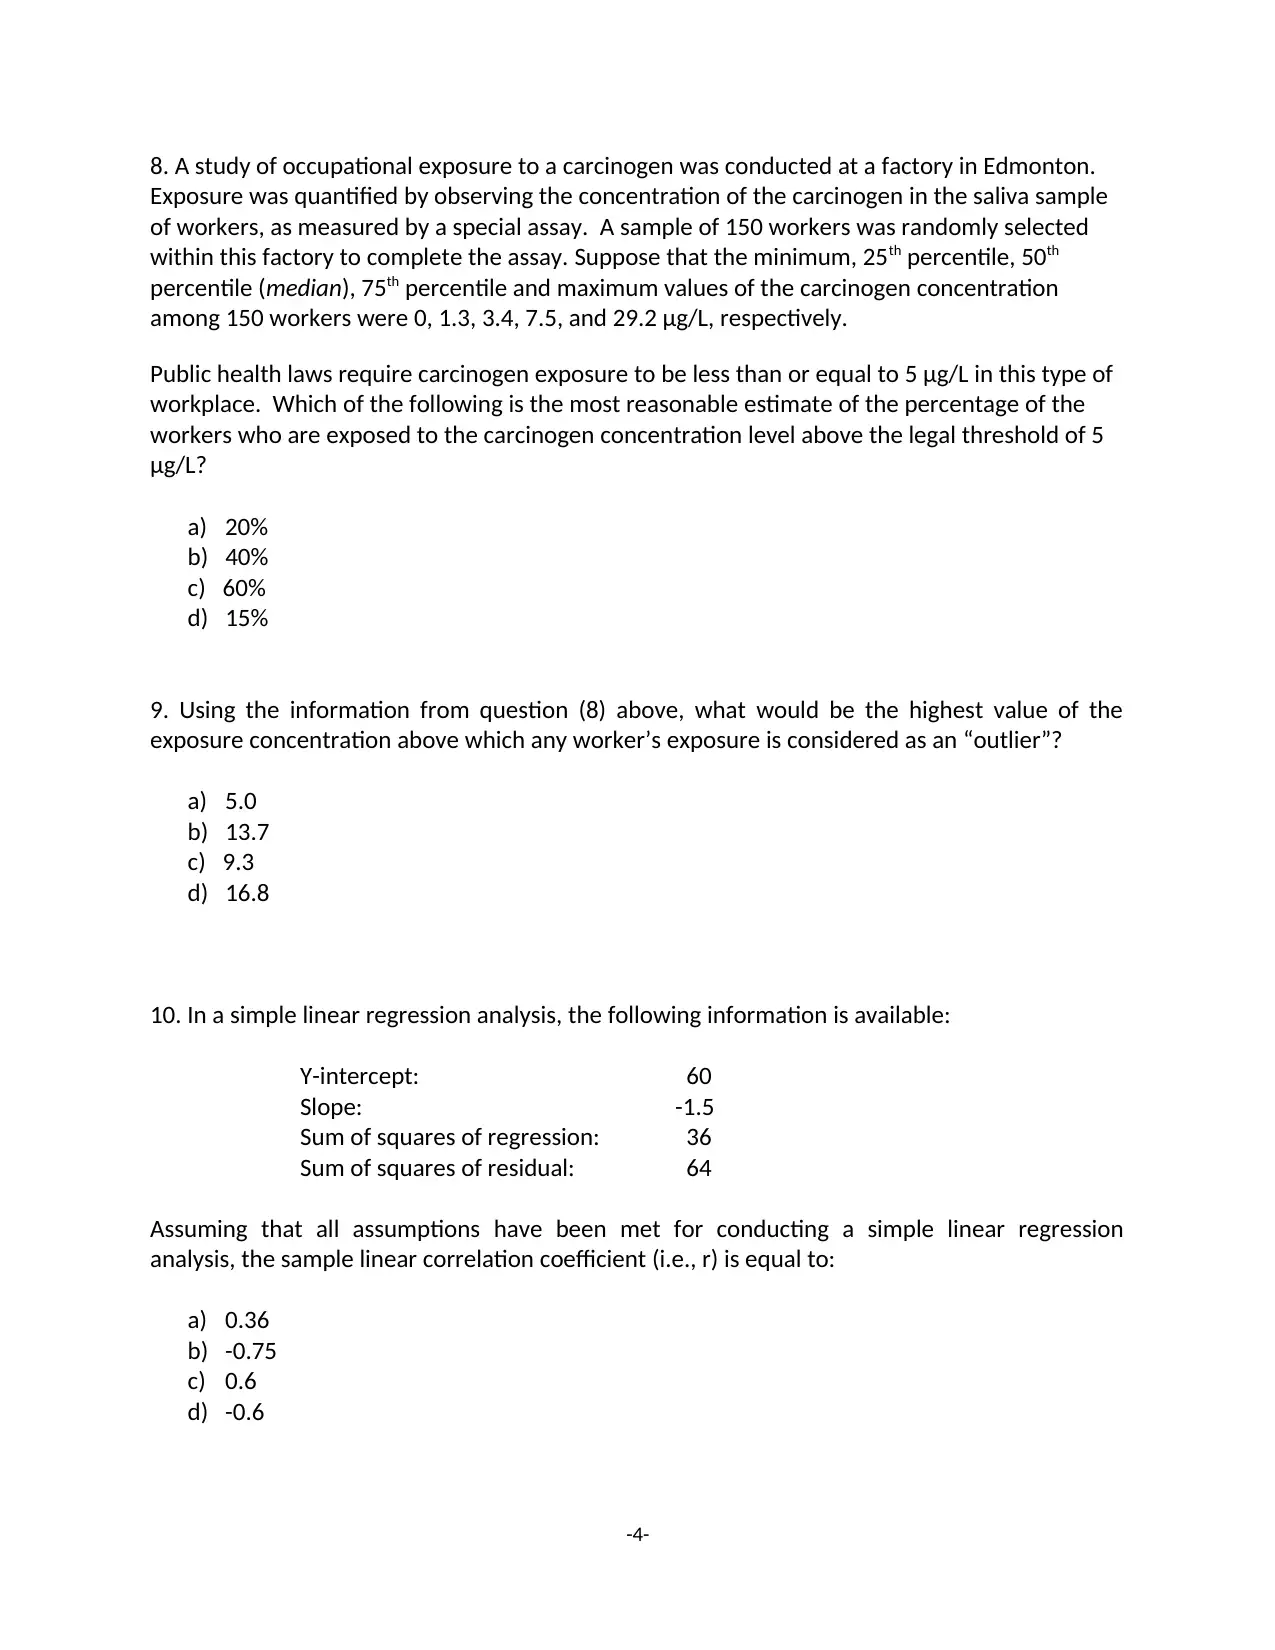
8. A study of occupational exposure to a carcinogen was conducted at a factory in Edmonton.
Exposure was quantified by observing the concentration of the carcinogen in the saliva sample
of workers, as measured by a special assay. A sample of 150 workers was randomly selected
within this factory to complete the assay. Suppose that the minimum, 25th percentile, 50th
percentile (median), 75th percentile and maximum values of the carcinogen concentration
among 150 workers were 0, 1.3, 3.4, 7.5, and 29.2 μg/L, respectively.
Public health laws require carcinogen exposure to be less than or equal to 5 μg/L in this type of
workplace. Which of the following is the most reasonable estimate of the percentage of the
workers who are exposed to the carcinogen concentration level above the legal threshold of 5
μg/L?
a) 20%
b) 40%
c) 60%
d) 15%
9. Using the information from question (8) above, what would be the highest value of the
exposure concentration above which any worker’s exposure is considered as an “outlier”?
a) 5.0
b) 13.7
c) 9.3
d) 16.8
10. In a simple linear regression analysis, the following information is available:
Y-intercept: 60
Slope: -1.5
Sum of squares of regression: 36
Sum of squares of residual: 64
Assuming that all assumptions have been met for conducting a simple linear regression
analysis, the sample linear correlation coefficient (i.e., r) is equal to:
a) 0.36
b) -0.75
c) 0.6
d) -0.6
-4-
Paraphrase This Document
Need a fresh take? Get an instant paraphrase of this document with our AI Paraphraser
11. The Kruskal-Wallis (K-W) test was used to test whether vitamin B-12 levels (measured as
ng/L) differ among four age groups (Younger: 19-45 years, Middle: 50-60, Seniors: 65-75 years,
and Elderly: 85+ years). Ten people were sampled randomly from each sub-population and B-12
levels were measured. If the K-W test statistic (H) was 8.2, the p-value to test an alternative
hypothesis that there is a difference in B-12 levels between the four sub-population medians is:
(Note: No calculations are required to answer this question).
a) p > 0.1
b) 0.05 < p < 0.1
c) 0.01 < p < 0.05
d) p < 0.01
12. A community group advocating to ban e-cigarettes has assembled all of the relevant policy
documents produced on this issue from the Government of Alberta and the City of Edmonton.
They are interested in tabulating how frequently these policy documents endorse or oppose e-
cigarette sales. Which of the following best describes the approach they should take to
analyzing these texts?
a) Inductive content analysis
b) Deductive phenomenological analysis
c) Deductive content analysis
d) Inductive thematic analysis
13. A diabetes self-management program that has been implemented to improve patients’
ability to control their diet has observed that many patients start the program but most stop
before the end of the 10 sessions required to teach patients how to make long-lasting dietary
changes. The program manager believes that quality of interactions between program staff and
patients is the source of the early drop-out phenomenon, but wants to collect textual evidence
to test her belief. Which of the following qualitative approaches is best suited for this task?
a) A phenomenological approach designed to analyze textual evidence to describe the
personal meaning of the program from the patients’ perspectives
b) A grounded theory approach, designed to analyze textual evidence to explain the social
significance of how the program is delivered
c) An ethnographic approach, designed to analyze textual evidence to describe what ‘rules’
need to be followed in order to adhere to the program
d) A thematic analysis approach, which codes textual evidence and organizes the codes
into thematic categories
-5-
14. Which of the following scenarios is most appropriate for conducting an inductive thematic
analysis of textual evidence?
a) When those interested in this evidence already have a well-formed theory about the
construct(s) they are interested in
b) When the primary objective for collecting the evidence is to understand how language is
used to create identities and power relations
c) When the primary objective for collecting the evidence is to create a theory explaining
the social process being described in the texts
d) None of the above
15. Suppose that you are reviewing and appraising a phenomenological analysis of interview
evidence. Which of the following aspects of this analytic approach best describes the task of
reviewing similar text segments across study participants to develop a first-person description?
a) Identification of meaning units
b) Sorting of meaning units to describe distinct aspects of lived experience
c) Describing essential features of the experience
d) None of the above
-6-
⊘ This is a preview!⊘
Do you want full access?
Subscribe today to unlock all pages.
Trusted by 1+ million students worldwide
Part B: Quantitative Analyses
General guidelines
Use the Anorexic data set (uploaded to eClass) to answer questions 1 to 5 below
Your answer should be included in this document (i.e., don’t submit a separate file; just add
content to this document)
For questions 2 to 4 below, use Excel to perform your analyses
Copy relevant Excel output required to answer each question and paste it into your word
file (i.e., don’t submit an Excel file)
Include relevant information from the Excel output in your brief paragraph summarizing the
results and conclusion
Please do not include the statistical decision (e.g., reject [or fail to reject] the null
hypothesis) in your brief paragraph
If you cite any references, include them at the end of this document
Note: each question (1-5 below) will be graded separately from the other questions.
Scenario
Fifty young girls suffering from anorexia were randomly assigned to receive one of three
therapies: cognitive behavioral therapy, family therapy, or a control/standard therapy.
The weights of the 50 girls (measured in pounds) before and after their treatment
periods are provided in the Excel file.
Questions
1. From a study design perspective, describe the advantage(s) of randomly assigning patients
to these treatments, as opposed to conducting an observational study that compared
anorexics who received each treatment. [1 mark available] (Note: No calculations are
required to answer this question)
Random assignment in research produces reliable output (Babbie, 2010; Marshall &
Rossman, 2011). By randomly assigning the girls to different treatments, the differences
that are observed at the end of the study are purely due to the difference in the
treatments and not systematic. Systematic differences result from bias in the assignment
(Berinsky, 2008; Lisa, 2017). In this case it would be conducting research on a sample
whose assignment procedure is unknown.
-7-
Paraphrase This Document
Need a fresh take? Get an instant paraphrase of this document with our AI Paraphraser
2. How effective was randomization to the three groups in this study? Write the null and
alternative hypotheses you tested, and a brief paragraph summarizing the results and
conclusion. [4 marks available]
Considering the data on the “weight before” for the three groups, we have the following
hypotheses:
HYPOTHESIS 1
H0: The cognitive behavioral therapy and family therapy groups are not significantly
different.
H1: The cognitive behavioral therapy and family therapy groups are significantly different.
HYPOTHESIS 2
H0: The cognitive behavioral therapy and control therapy groups are not significantly
different.
H1: The cognitive behavioral therapy and control therapy groups are significantly
different.
HYPOTHESIS 3
H0: The family therapy and control therapy groups are not significantly different.
H1: The family therapy and control therapy groups are significantly different.
From the results: Hypothesis Test 1, the p-value for the t-test = 0.59 (2dp) > α = 0.05,
Hypothesis Test 2, the p-value for the t-test = 0.83 (2dp) > α = 0.05 and Hypothesis Test 3,
the p-value for the t-test = 0.50 (2dp) > α = 0.05. We thus conclude that: The cognitive
behavioral therapy and family therapy groups are not significantly different from each
other, the cognitive behavioral therapy and control therapy groups are not significantly
different from each other and the family therapy and control therapy groups are not
significantly different from each other. Hence, the randomization of the three groups was
effective to a very limited extent.
3. Is exposure to Family Therapy an effective intervention approach to gain weight among
anorexics? Write the null and alternative hypotheses you tested, and a brief paragraph
summarizing the results and conclusion, including a relevant 95% confidence interval. [6
marks available]
-8-
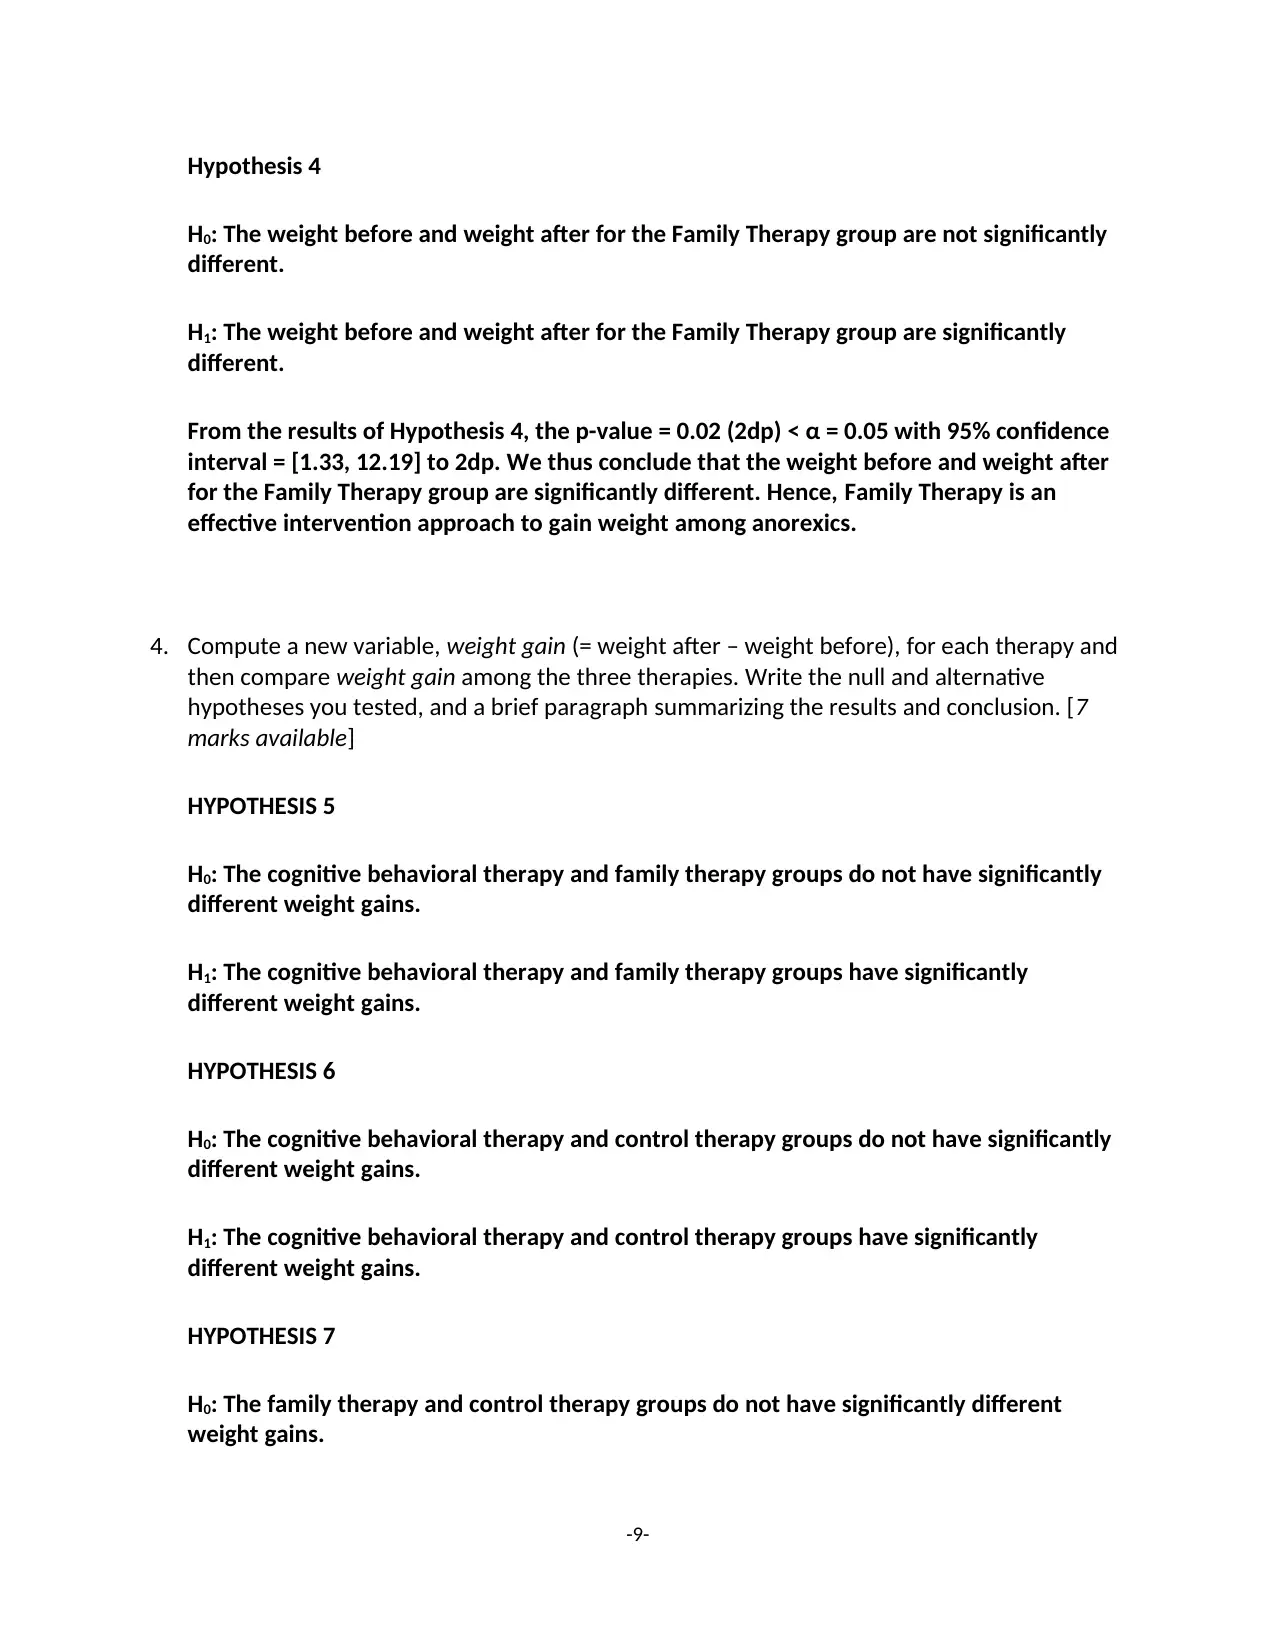
Hypothesis 4
H0: The weight before and weight after for the Family Therapy group are not significantly
different.
H1: The weight before and weight after for the Family Therapy group are significantly
different.
From the results of Hypothesis 4, the p-value = 0.02 (2dp) < α = 0.05 with 95% confidence
interval = [1.33, 12.19] to 2dp. We thus conclude that the weight before and weight after
for the Family Therapy group are significantly different. Hence, Family Therapy is an
effective intervention approach to gain weight among anorexics.
4. Compute a new variable, weight gain (= weight after – weight before), for each therapy and
then compare weight gain among the three therapies. Write the null and alternative
hypotheses you tested, and a brief paragraph summarizing the results and conclusion. [7
marks available]
HYPOTHESIS 5
H0: The cognitive behavioral therapy and family therapy groups do not have significantly
different weight gains.
H1: The cognitive behavioral therapy and family therapy groups have significantly
different weight gains.
HYPOTHESIS 6
H0: The cognitive behavioral therapy and control therapy groups do not have significantly
different weight gains.
H1: The cognitive behavioral therapy and control therapy groups have significantly
different weight gains.
HYPOTHESIS 7
H0: The family therapy and control therapy groups do not have significantly different
weight gains.
-9-
⊘ This is a preview!⊘
Do you want full access?
Subscribe today to unlock all pages.
Trusted by 1+ million students worldwide
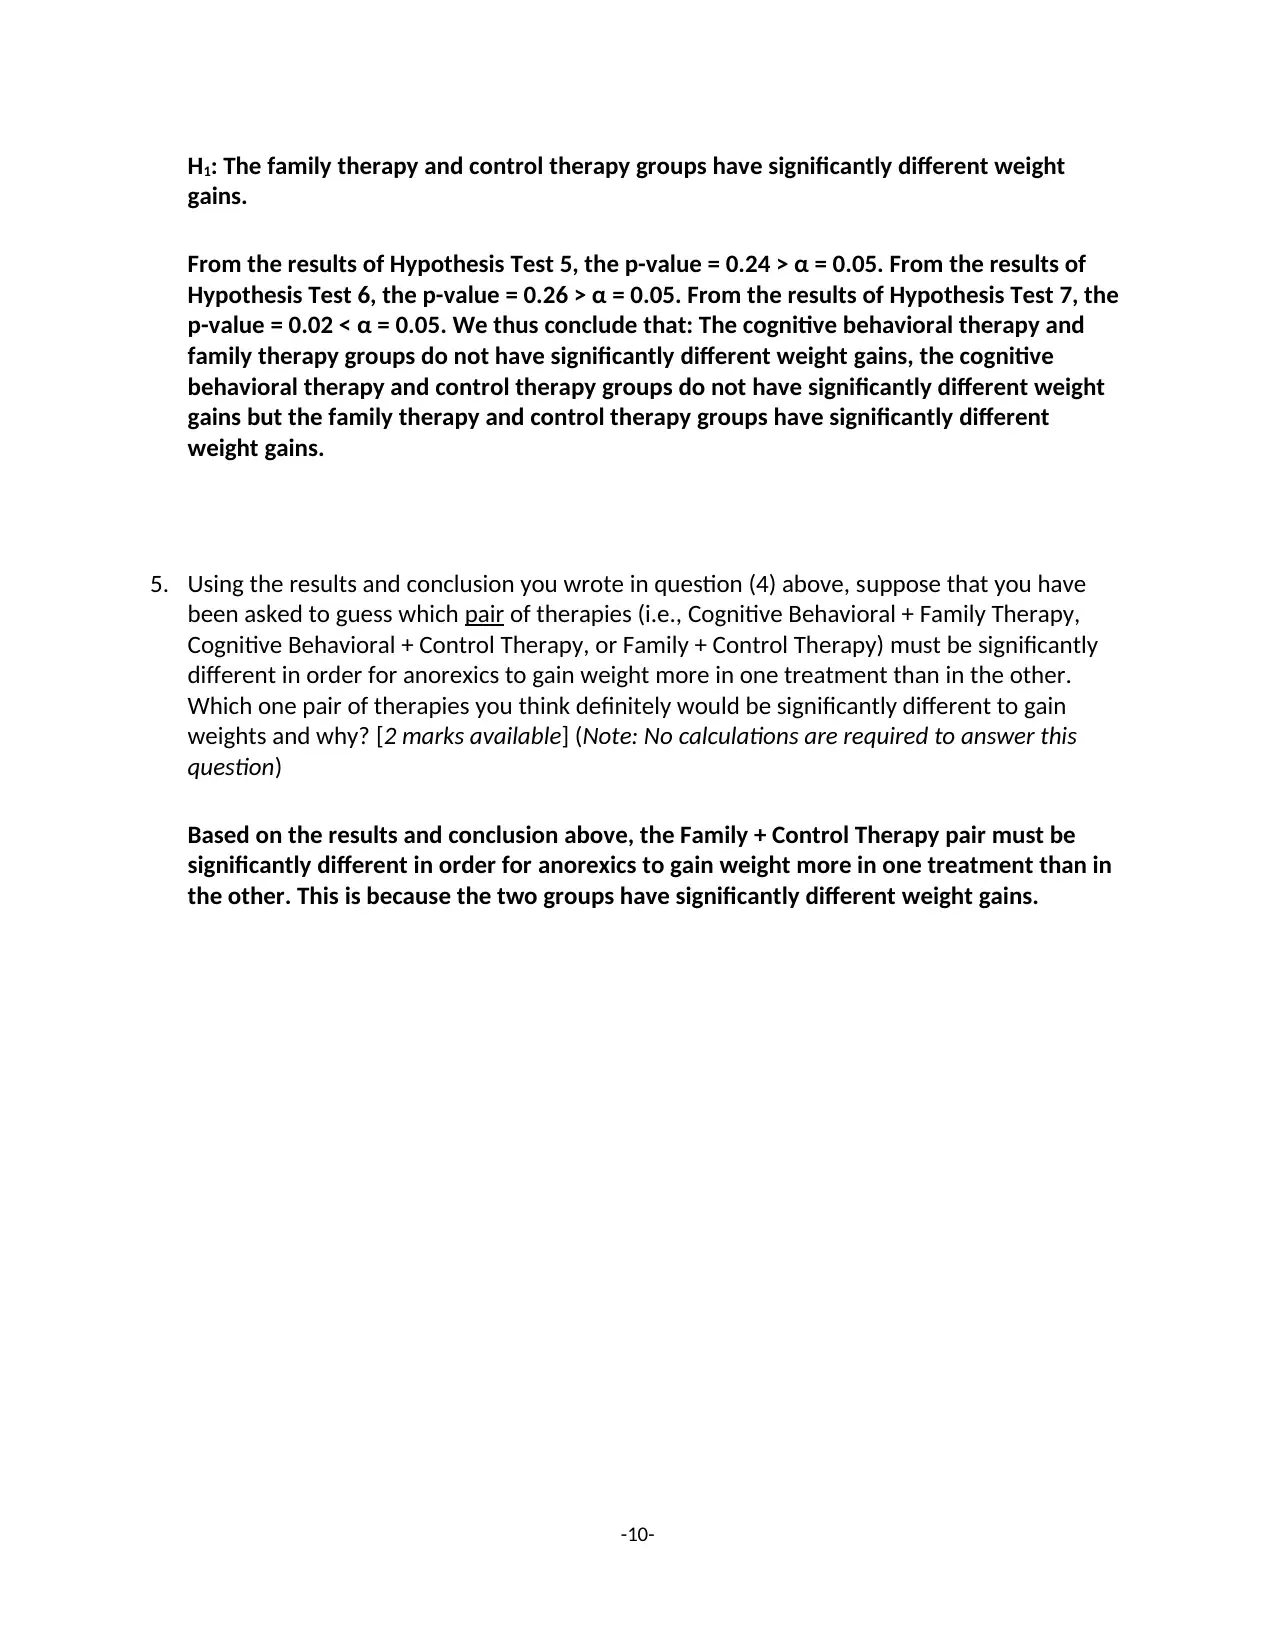
H1: The family therapy and control therapy groups have significantly different weight
gains.
From the results of Hypothesis Test 5, the p-value = 0.24 > α = 0.05. From the results of
Hypothesis Test 6, the p-value = 0.26 > α = 0.05. From the results of Hypothesis Test 7, the
p-value = 0.02 < α = 0.05. We thus conclude that: The cognitive behavioral therapy and
family therapy groups do not have significantly different weight gains, the cognitive
behavioral therapy and control therapy groups do not have significantly different weight
gains but the family therapy and control therapy groups have significantly different
weight gains.
5. Using the results and conclusion you wrote in question (4) above, suppose that you have
been asked to guess which pair of therapies (i.e., Cognitive Behavioral + Family Therapy,
Cognitive Behavioral + Control Therapy, or Family + Control Therapy) must be significantly
different in order for anorexics to gain weight more in one treatment than in the other.
Which one pair of therapies you think definitely would be significantly different to gain
weights and why? [2 marks available] (Note: No calculations are required to answer this
question)
Based on the results and conclusion above, the Family + Control Therapy pair must be
significantly different in order for anorexics to gain weight more in one treatment than in
the other. This is because the two groups have significantly different weight gains.
-10-
Paraphrase This Document
Need a fresh take? Get an instant paraphrase of this document with our AI Paraphraser
Part C: Qualitative Analyses
General guidelines
Your answer should be included in this document (i.e., don’t submit a separate file; just add
content to this document)
If you cite any references, include them at the end of this document
Note: each question (1 – 3 below) will be graded separately from the other questions.
Provide a complete answer for each question.
Scenario
This scenario builds on lecture material presented in Topic 17, which provided an extended
example of deductive content analysis in relation to Canadian media coverage of harm
reduction (e.g., needle exchange, supervised injection services) for people who use drugs.
The textual evidence below was obtained from a purposive sample of high-level provincial
decision makers who were interviewed to obtain their perspectives on harm reduction
services and policies.
Textual Evidence
Excerpt 1
Interviewer: What would you say your personal definition or understanding of harm reduction
is?
Participant: I think it’s kind of a combination of a number of things. I think it’s recognizing that
harm is throughout society and that we are all susceptible to that. I think that being non-
judgmental, its meeting people where they’re at and providing them with what they need in
the moment, regardless of what my agenda may or may not be. By providing people, building
trust, building relationships and listening. And then working to make sure there’s proper policy
and protocol in place. That’s there’s proper programming in place that allow people to meet
their needs. I see it as more of a broad social determinant of health kind of perspective. If I’m
homeless and you’re telling me not to use drugs, or if I’m a sex worker and you’re telling me to
use condom, well you really don’t know the circumstances of my life. It’s getting to know what
the needs of those people are and try to work with them in a way that’s meaningful for them.
Excerpt 2
Participant: If all you’re looking at is the spread of disease, you miss all the other stuff about
relationships, you miss stuff about recovery, and … um… and the social justice and human rights
aspect of harm reduction. Because really it becomes about is it going to prevent disease or not.
And so much of harm reduction really isn’t about disease prevention, it’s about basic human
rights of people who use drugs.
-11-
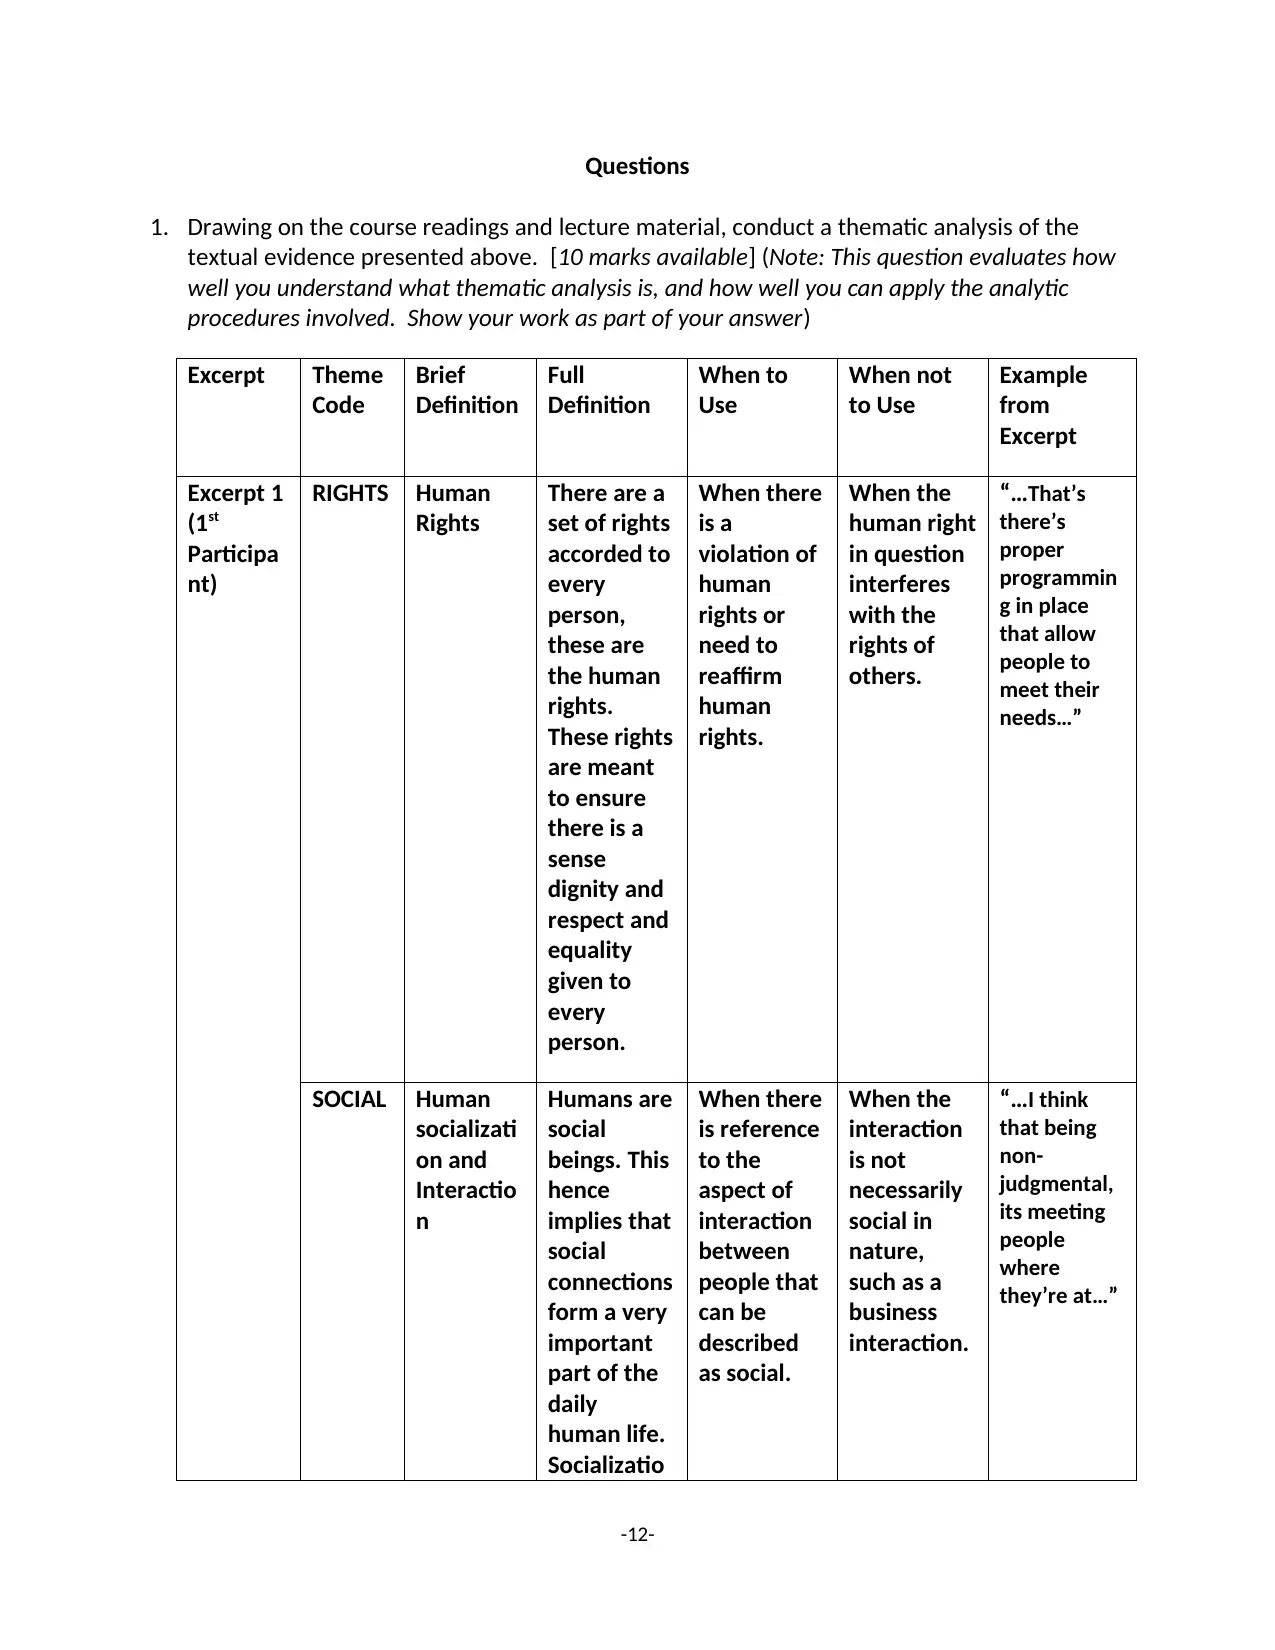
Questions
1. Drawing on the course readings and lecture material, conduct a thematic analysis of the
textual evidence presented above. [10 marks available] (Note: This question evaluates how
well you understand what thematic analysis is, and how well you can apply the analytic
procedures involved. Show your work as part of your answer)
Excerpt Theme
Code
Brief
Definition
Full
Definition
When to
Use
When not
to Use
Example
from
Excerpt
Excerpt 1
(1st
Participa
nt)
RIGHTS Human
Rights
There are a
set of rights
accorded to
every
person,
these are
the human
rights.
These rights
are meant
to ensure
there is a
sense
dignity and
respect and
equality
given to
every
person.
When there
is a
violation of
human
rights or
need to
reaffirm
human
rights.
When the
human right
in question
interferes
with the
rights of
others.
“…That’s
there’s
proper
programmin
g in place
that allow
people to
meet their
needs…”
SOCIAL Human
socializati
on and
Interactio
n
Humans are
social
beings. This
hence
implies that
social
connections
form a very
important
part of the
daily
human life.
Socializatio
When there
is reference
to the
aspect of
interaction
between
people that
can be
described
as social.
When the
interaction
is not
necessarily
social in
nature,
such as a
business
interaction.
“…I think
that being
non-
judgmental,
its meeting
people
where
they’re at…”
-12-
⊘ This is a preview!⊘
Do you want full access?
Subscribe today to unlock all pages.
Trusted by 1+ million students worldwide
1 out of 17
Related Documents


Your All-in-One AI-Powered Toolkit for Academic Success.
+13062052269
info@desklib.com
Available 24*7 on WhatsApp / Email
![[object Object]](/_next/static/media/star-bottom.7253800d.svg)
Unlock your academic potential
Copyright © 2020–2025 A2Z Services. All Rights Reserved. Developed and managed by ZUCOL.