Using Data to Build Business Practice
VerifiedAdded on 2023/01/11
|21
|3437
|93
AI Summary
This document discusses the importance of using data to improve business practices. It explores the occasions where external assistance may be needed for information and strategic advice. It also examines the main objectives of businesses and their growth over the past three years. Additionally, it provides insights into the approximate turnover of businesses in the last financial year.
Contribute Materials
Your contribution can guide someone’s learning journey. Share your
documents today.
Using Data to Build
Business Practice
Business Practice
Secure Best Marks with AI Grader
Need help grading? Try our AI Grader for instant feedback on your assignments.
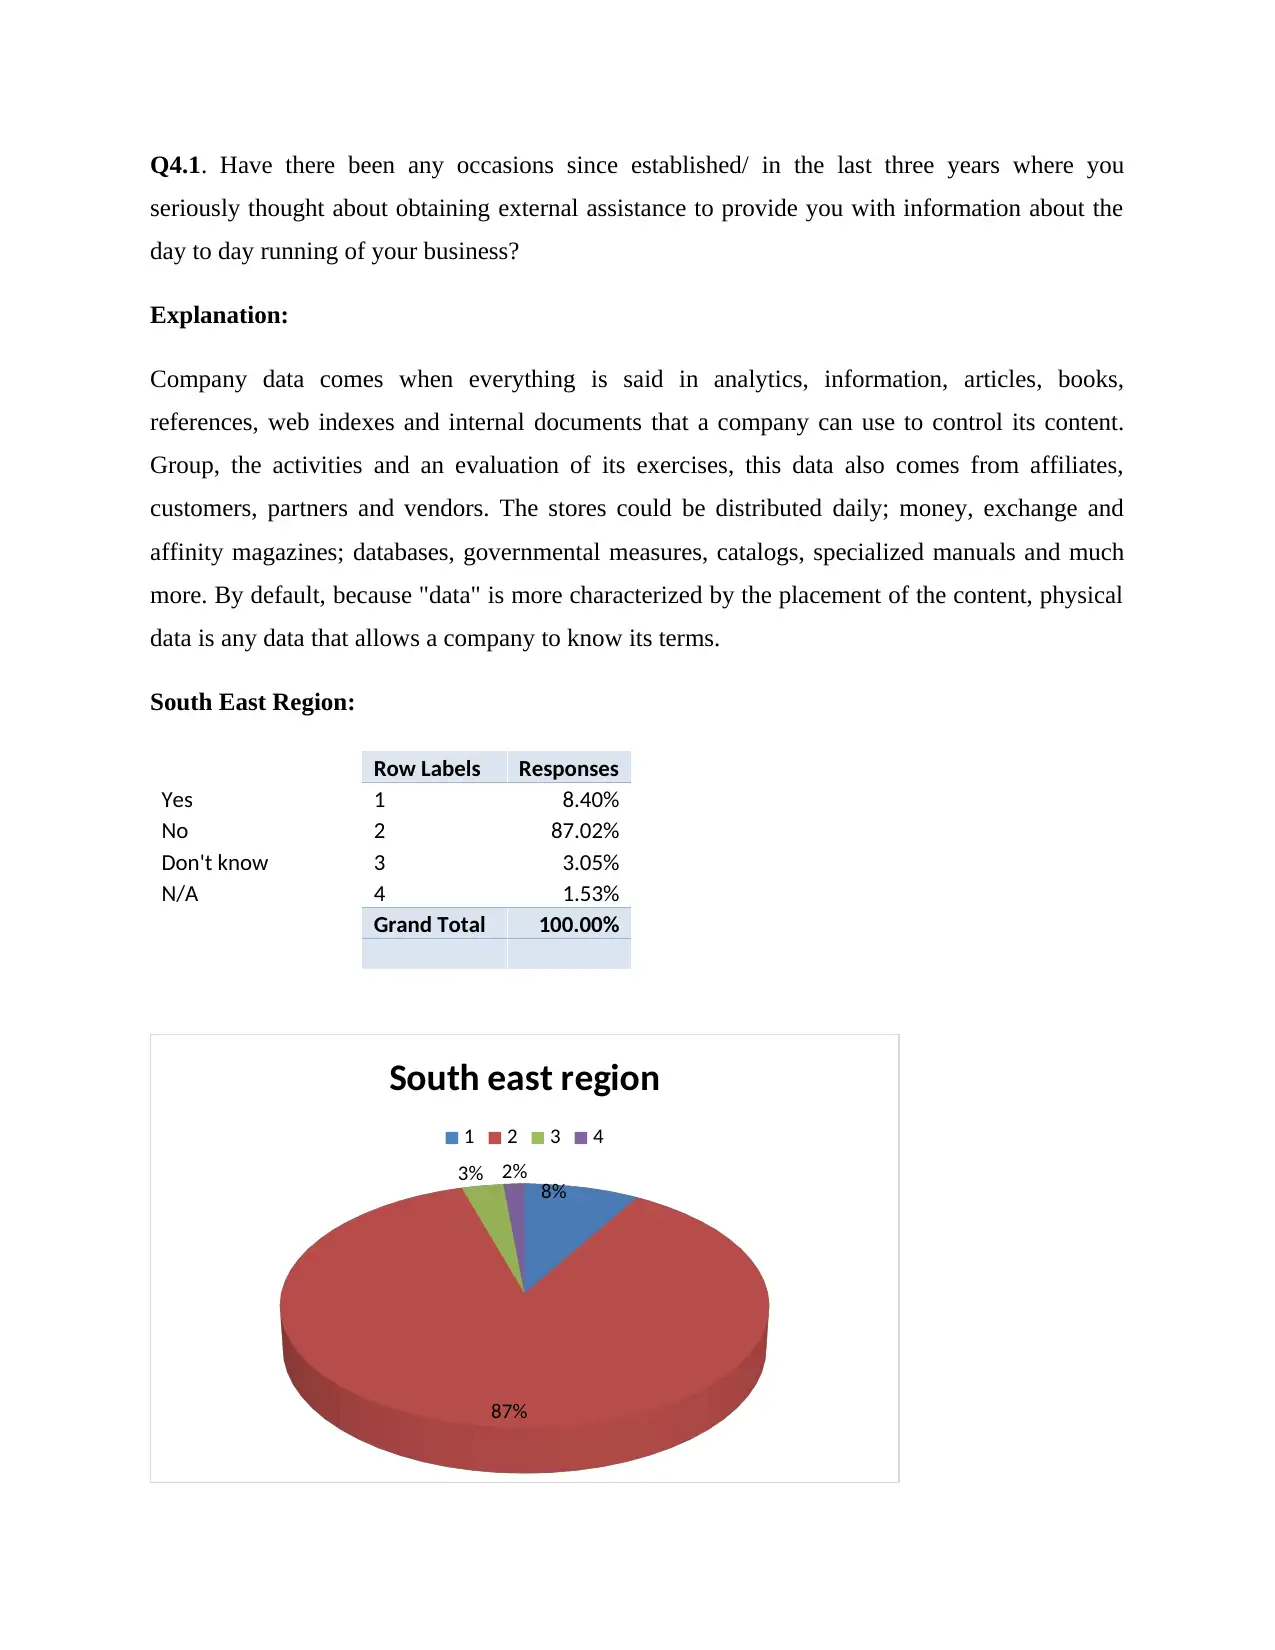
Q4.1. Have there been any occasions since established/ in the last three years where you
seriously thought about obtaining external assistance to provide you with information about the
day to day running of your business?
Explanation:
Company data comes when everything is said in analytics, information, articles, books,
references, web indexes and internal documents that a company can use to control its content.
Group, the activities and an evaluation of its exercises, this data also comes from affiliates,
customers, partners and vendors. The stores could be distributed daily; money, exchange and
affinity magazines; databases, governmental measures, catalogs, specialized manuals and much
more. By default, because "data" is more characterized by the placement of the content, physical
data is any data that allows a company to know its terms.
South East Region:
Row Labels Responses
Yes 1 8.40%
No 2 87.02%
Don't know 3 3.05%
N/A 4 1.53%
Grand Total 100.00%
8%
87%
3% 2%
South east region
1 2 3 4
The question is about using external support or third party to gather operational information of
the company. The above result shows that 87.02% industrialists have not been seriously thought
about obtaining external assistance to provide them with information about the day to day
running of their business. Only 8.40% industrialists prefer to gather information from outside or
from agencies. Only few industrialists don’t want to share their responses.
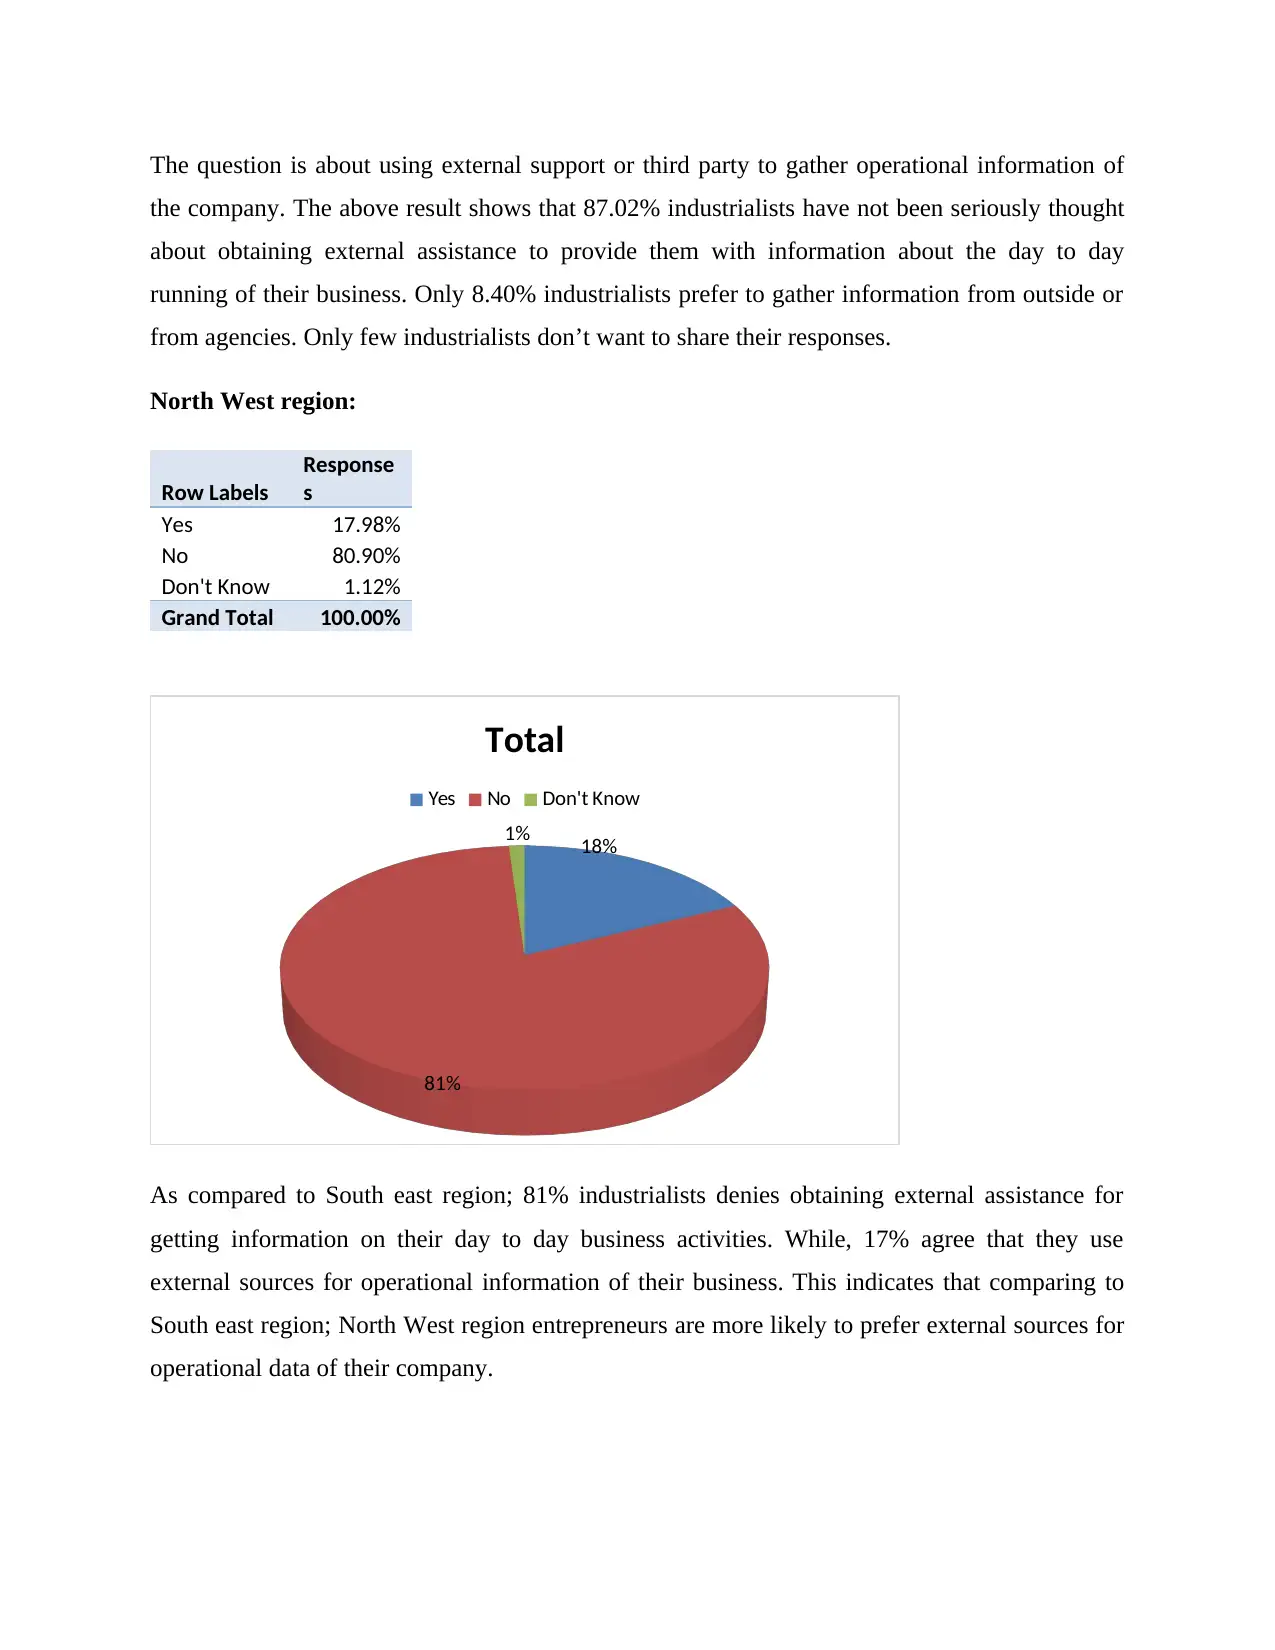
North West region:
Row Labels
Response
s
Yes 17.98%
No 80.90%
Don't Know 1.12%
Grand Total 100.00%
18%
81%
1%
Total
Yes No Don't Know
As compared to South east region; 81% industrialists denies obtaining external assistance for
getting information on their day to day business activities. While, 17% agree that they use
external sources for operational information of their business. This indicates that comparing to
South east region; North West region entrepreneurs are more likely to prefer external sources for
operational data of their company.
the company. The above result shows that 87.02% industrialists have not been seriously thought
about obtaining external assistance to provide them with information about the day to day
running of their business. Only 8.40% industrialists prefer to gather information from outside or
from agencies. Only few industrialists don’t want to share their responses.
North West region:
Row Labels
Response
s
Yes 17.98%
No 80.90%
Don't Know 1.12%
Grand Total 100.00%
18%
81%
1%
Total
Yes No Don't Know
As compared to South east region; 81% industrialists denies obtaining external assistance for
getting information on their day to day business activities. While, 17% agree that they use
external sources for operational information of their business. This indicates that comparing to
South east region; North West region entrepreneurs are more likely to prefer external sources for
operational data of their company.
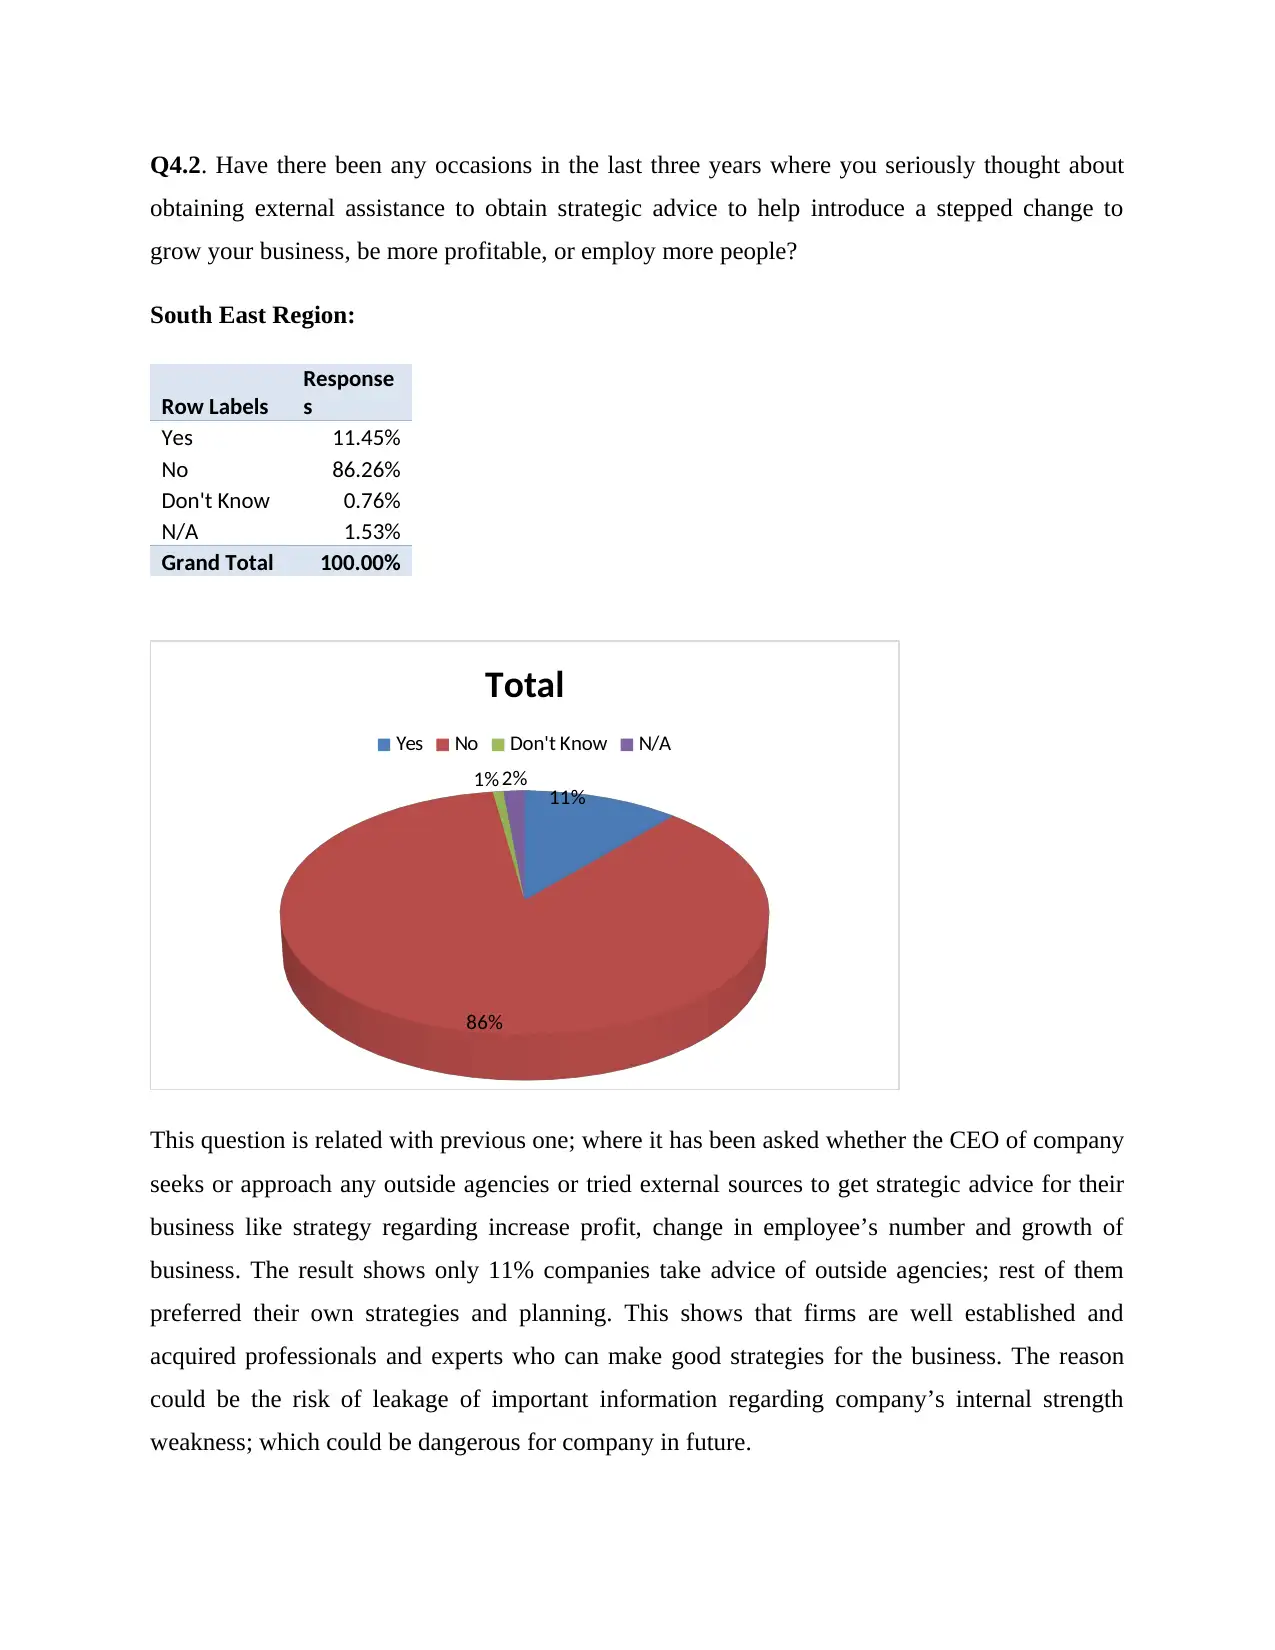
Q4.2. Have there been any occasions in the last three years where you seriously thought about
obtaining external assistance to obtain strategic advice to help introduce a stepped change to
grow your business, be more profitable, or employ more people?
South East Region:
Row Labels
Response
s
Yes 11.45%
No 86.26%
Don't Know 0.76%
N/A 1.53%
Grand Total 100.00%
11%
86%
1% 2%
Total
Yes No Don't Know N/A
This question is related with previous one; where it has been asked whether the CEO of company
seeks or approach any outside agencies or tried external sources to get strategic advice for their
business like strategy regarding increase profit, change in employee’s number and growth of
business. The result shows only 11% companies take advice of outside agencies; rest of them
preferred their own strategies and planning. This shows that firms are well established and
acquired professionals and experts who can make good strategies for the business. The reason
could be the risk of leakage of important information regarding company’s internal strength
weakness; which could be dangerous for company in future.
Secure Best Marks with AI Grader
Need help grading? Try our AI Grader for instant feedback on your assignments.
North West region:
Row Labels
Response
s
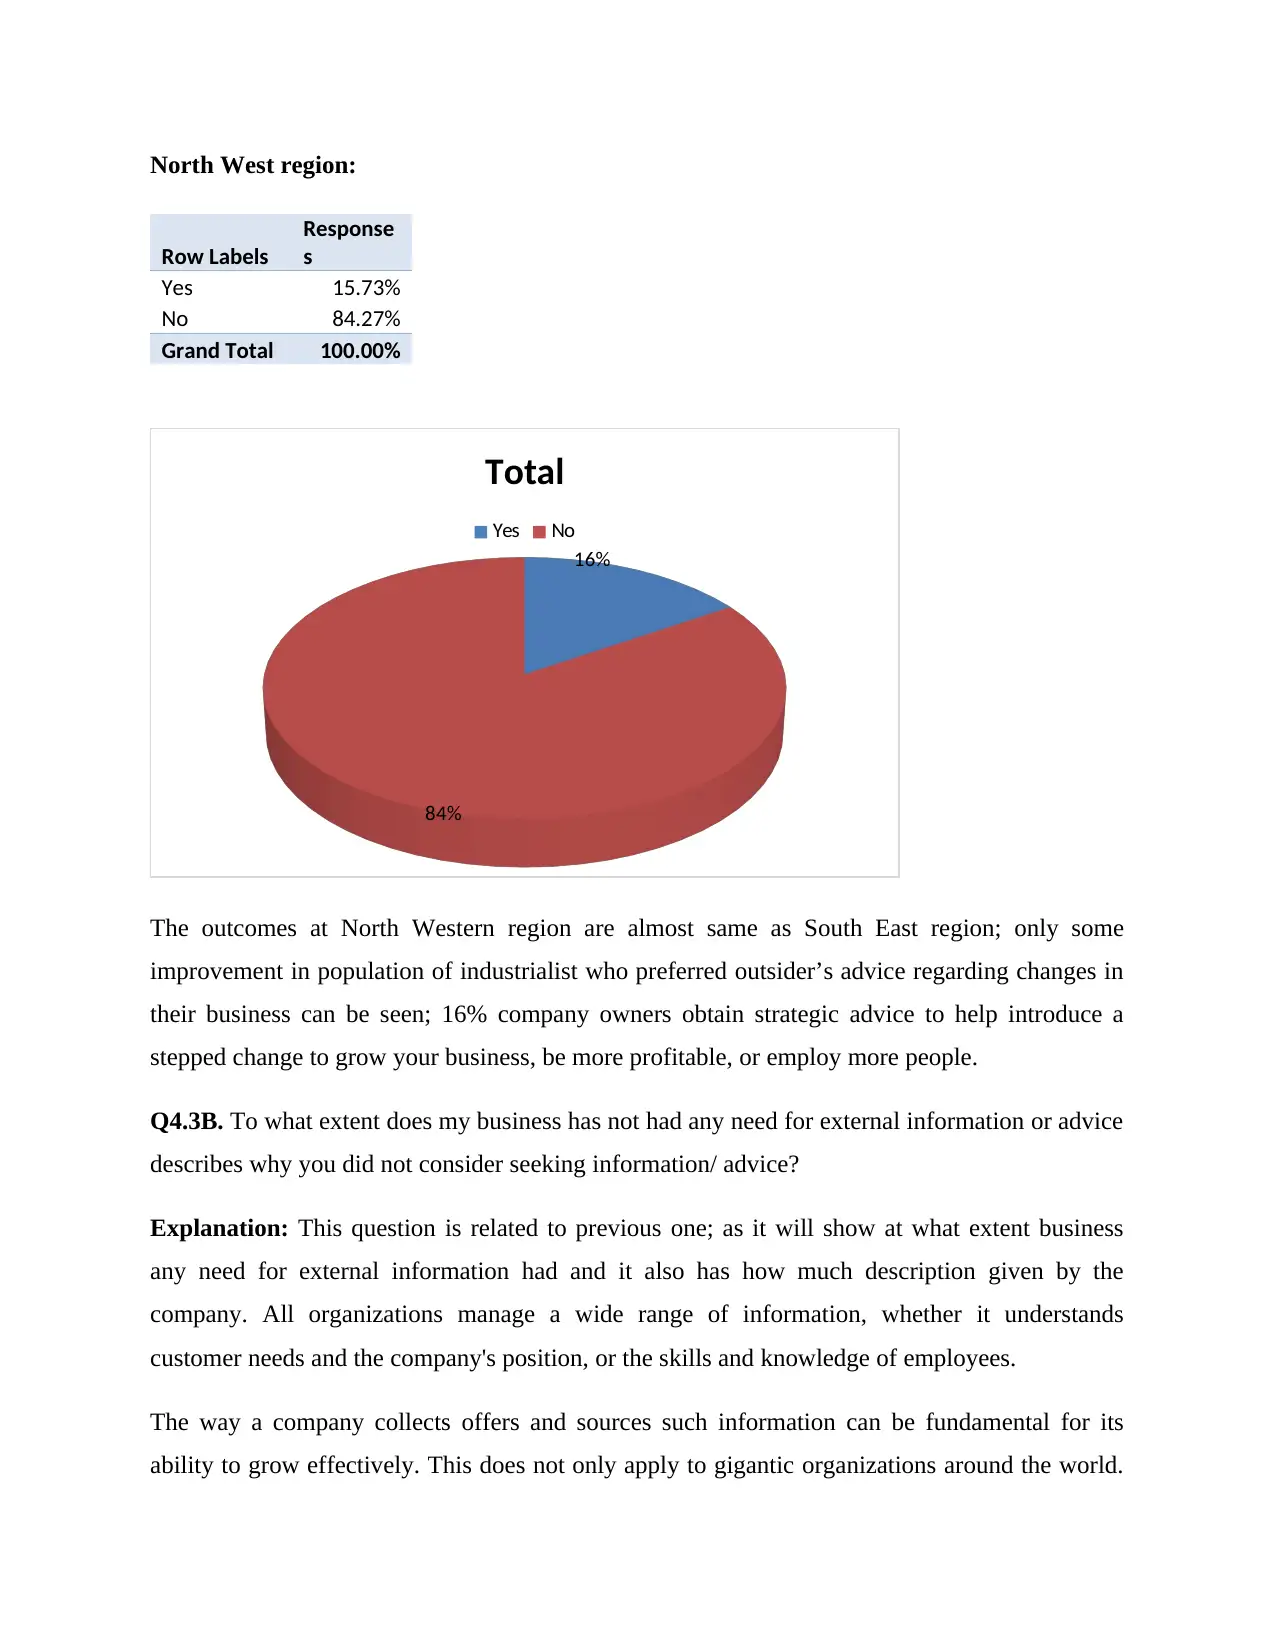
Yes 15.73%
No 84.27%
Grand Total 100.00%
16%
84%
Total
Yes No
The outcomes at North Western region are almost same as South East region; only some
improvement in population of industrialist who preferred outsider’s advice regarding changes in
their business can be seen; 16% company owners obtain strategic advice to help introduce a
stepped change to grow your business, be more profitable, or employ more people.
Q4.3B. To what extent does my business has not had any need for external information or advice
describes why you did not consider seeking information/ advice?
Explanation: This question is related to previous one; as it will show at what extent business
any need for external information had and it also has how much description given by the
company. All organizations manage a wide range of information, whether it understands
customer needs and the company's position, or the skills and knowledge of employees.
The way a company collects offers and sources such information can be fundamental for its
ability to grow effectively. This does not only apply to gigantic organizations around the world.
Row Labels
Response
s
Yes 15.73%
No 84.27%
Grand Total 100.00%
16%
84%
Total
Yes No
The outcomes at North Western region are almost same as South East region; only some
improvement in population of industrialist who preferred outsider’s advice regarding changes in
their business can be seen; 16% company owners obtain strategic advice to help introduce a
stepped change to grow your business, be more profitable, or employ more people.
Q4.3B. To what extent does my business has not had any need for external information or advice
describes why you did not consider seeking information/ advice?
Explanation: This question is related to previous one; as it will show at what extent business
any need for external information had and it also has how much description given by the
company. All organizations manage a wide range of information, whether it understands
customer needs and the company's position, or the skills and knowledge of employees.
The way a company collects offers and sources such information can be fundamental for its
ability to grow effectively. This does not only apply to gigantic organizations around the world.
Information that operators; can profit from anyone, from a nearby newspaper to a collection
company.
South East Region:
Row Labels
Response
s
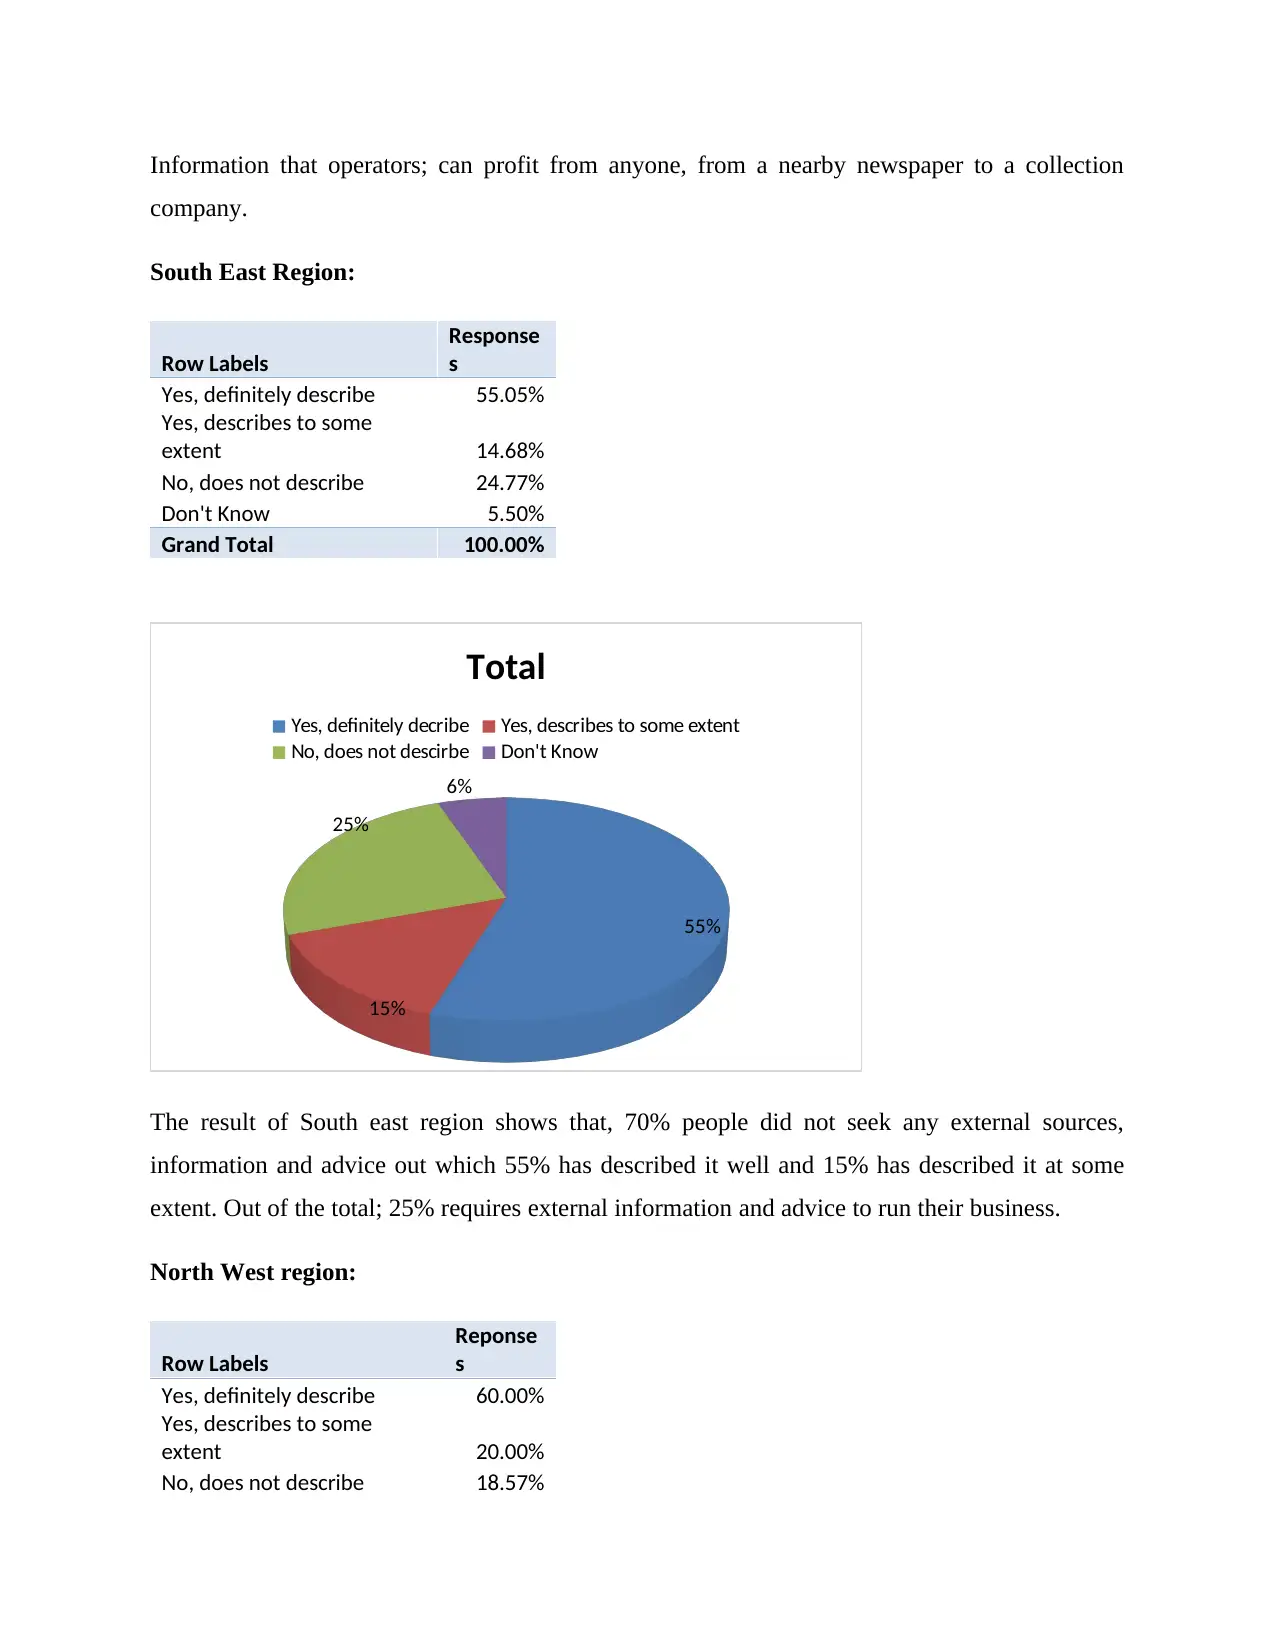
Yes, definitely describe 55.05%
Yes, describes to some
extent 14.68%
No, does not describe 24.77%
Don't Know 5.50%
Grand Total 100.00%
55%
15%
25%
6%
Total
Yes, definitely decribe Yes, describes to some extent
No, does not descirbe Don't Know
The result of South east region shows that, 70% people did not seek any external sources,
information and advice out which 55% has described it well and 15% has described it at some
extent. Out of the total; 25% requires external information and advice to run their business.
North West region:
Row Labels
Reponse
s
Yes, definitely describe 60.00%
Yes, describes to some
extent 20.00%
No, does not describe 18.57%
company.
South East Region:
Row Labels
Response
s
Yes, definitely describe 55.05%
Yes, describes to some
extent 14.68%
No, does not describe 24.77%
Don't Know 5.50%
Grand Total 100.00%
55%
15%
25%
6%
Total
Yes, definitely decribe Yes, describes to some extent
No, does not descirbe Don't Know
The result of South east region shows that, 70% people did not seek any external sources,
information and advice out which 55% has described it well and 15% has described it at some
extent. Out of the total; 25% requires external information and advice to run their business.
North West region:
Row Labels
Reponse
s
Yes, definitely describe 60.00%
Yes, describes to some
extent 20.00%
No, does not describe 18.57%
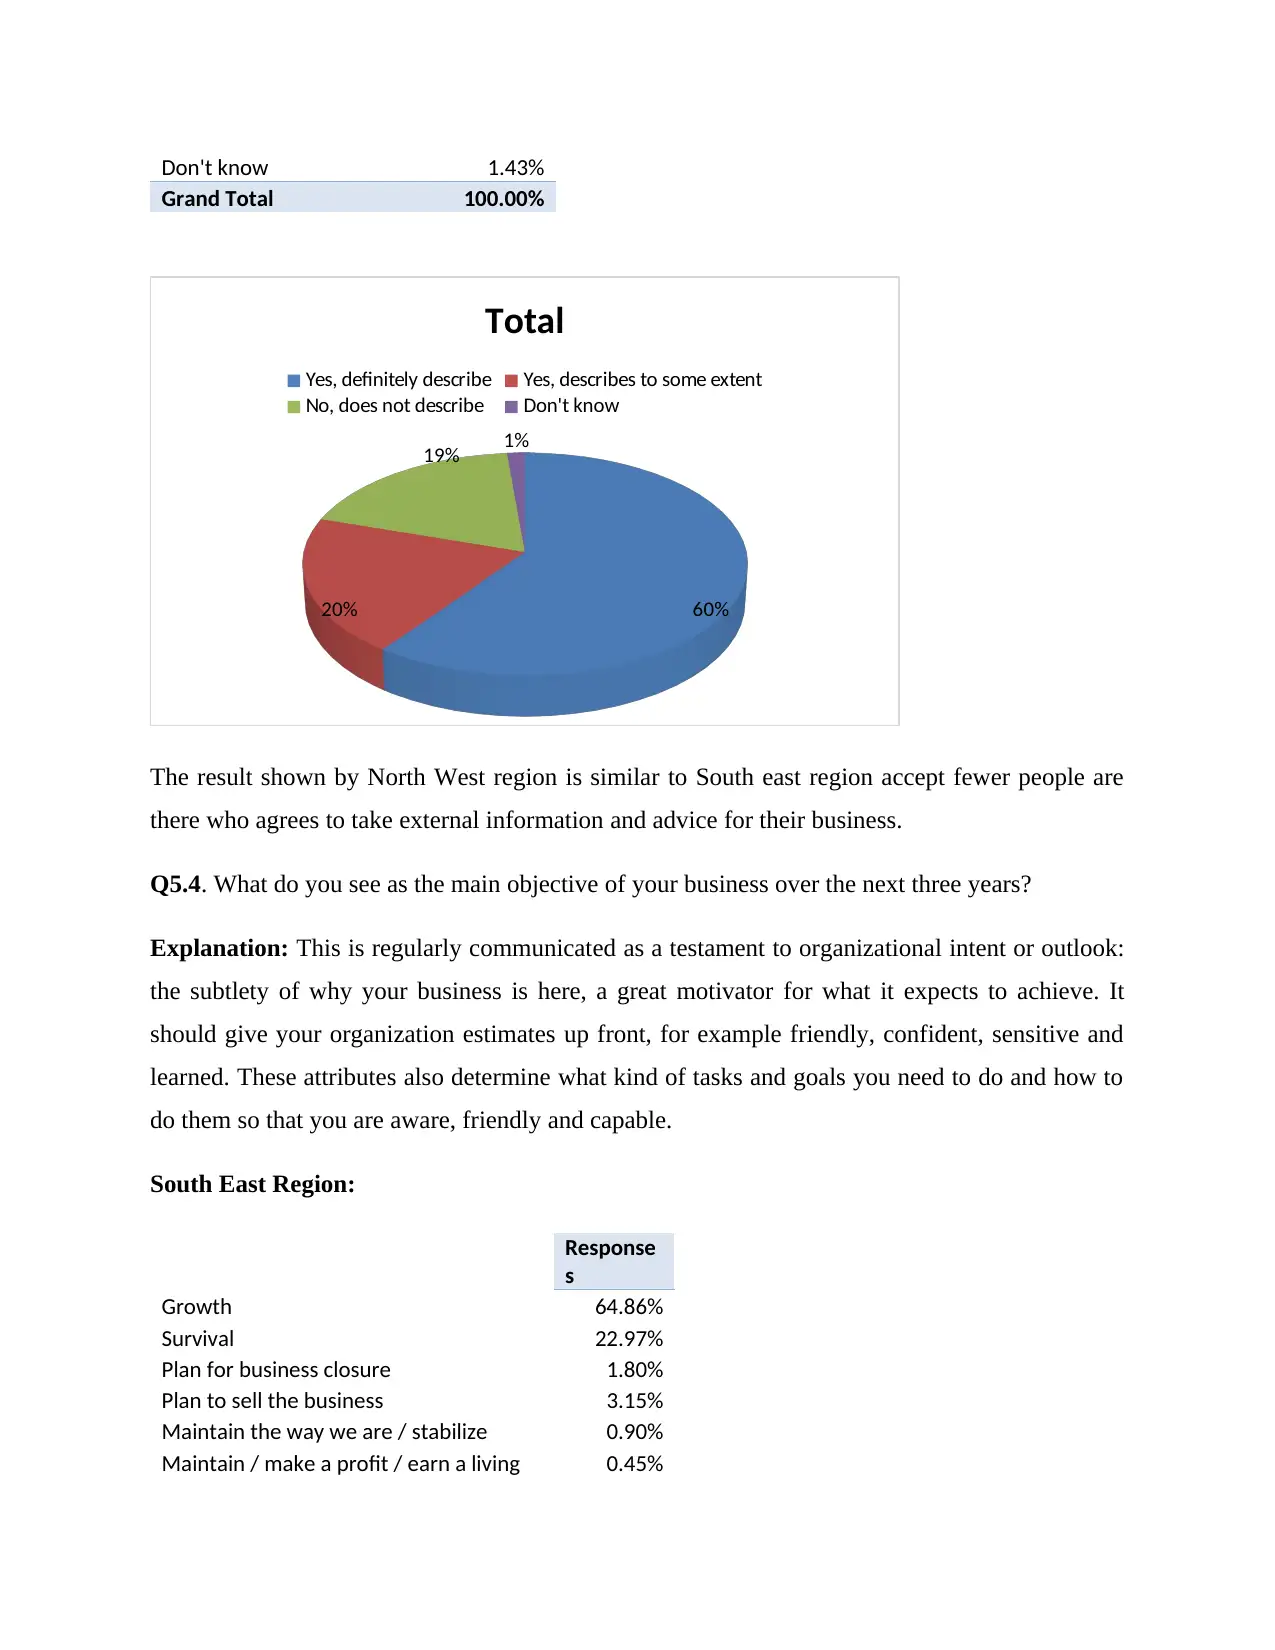
Don't know 1.43%
Grand Total 100.00%
60%20%
19% 1%
Total
Yes, definitely describe Yes, describes to some extent
No, does not describe Don't know
The result shown by North West region is similar to South east region accept fewer people are
there who agrees to take external information and advice for their business.
Q5.4. What do you see as the main objective of your business over the next three years?
Explanation: This is regularly communicated as a testament to organizational intent or outlook:
the subtlety of why your business is here, a great motivator for what it expects to achieve. It
should give your organization estimates up front, for example friendly, confident, sensitive and
learned. These attributes also determine what kind of tasks and goals you need to do and how to
do them so that you are aware, friendly and capable.
South East Region:
Response
s
Growth 64.86%
Survival 22.97%
Plan for business closure 1.80%
Plan to sell the business 3.15%
Maintain the way we are / stabilize 0.90%
Maintain / make a profit / earn a living 0.45%
Paraphrase This Document
Need a fresh take? Get an instant paraphrase of this document with our AI Paraphraser
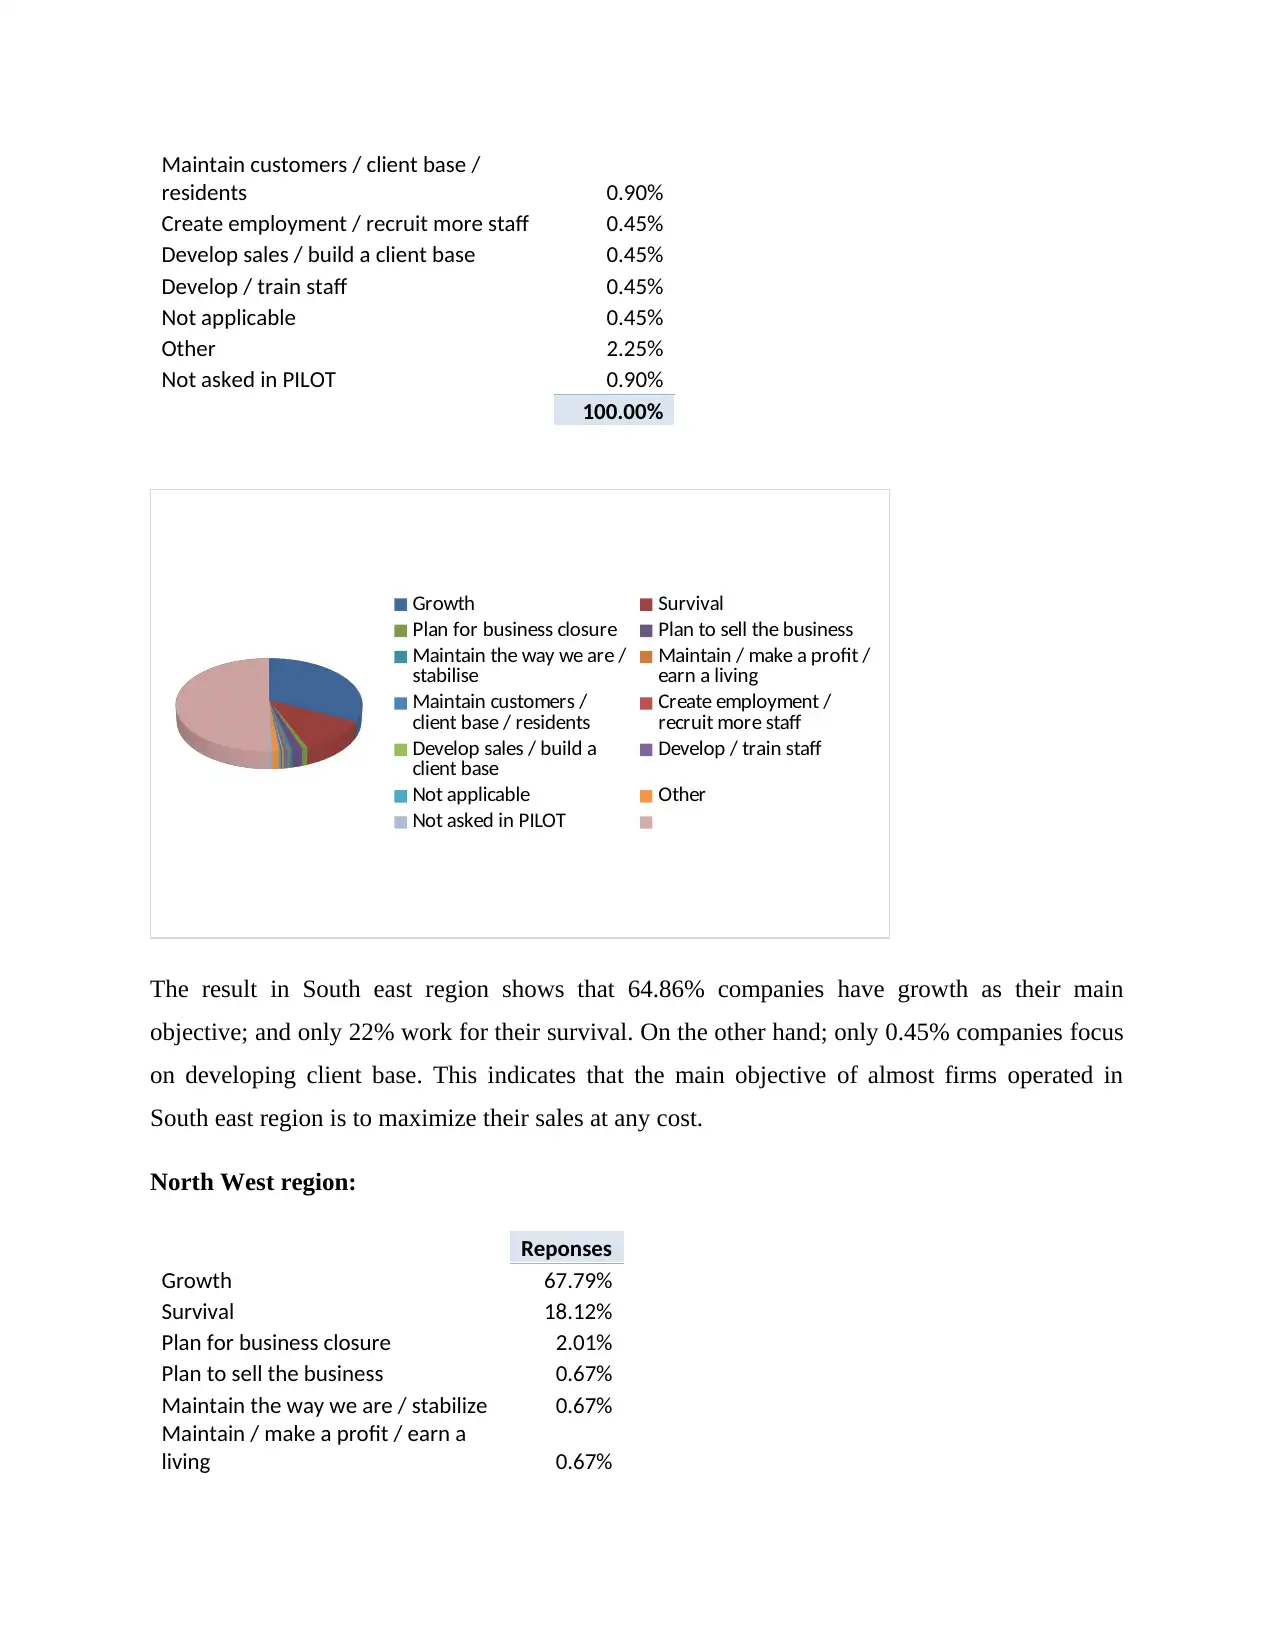
Maintain customers / client base /
residents 0.90%
Create employment / recruit more staff 0.45%
Develop sales / build a client base 0.45%
Develop / train staff 0.45%
Not applicable 0.45%
Other 2.25%
Not asked in PILOT 0.90%
100.00%
Growth Survival
Plan for business closure Plan to sell the business
Maintain the way we are /
stabilise Maintain / make a profit /
earn a living
Maintain customers /
client base / residents Create employment /
recruit more staff
Develop sales / build a
client base Develop / train staff
Not applicable Other
Not asked in PILOT
The result in South east region shows that 64.86% companies have growth as their main
objective; and only 22% work for their survival. On the other hand; only 0.45% companies focus
on developing client base. This indicates that the main objective of almost firms operated in
South east region is to maximize their sales at any cost.
North West region:
Reponses
Growth 67.79%
Survival 18.12%
Plan for business closure 2.01%
Plan to sell the business 0.67%
Maintain the way we are / stabilize 0.67%
Maintain / make a profit / earn a
living 0.67%
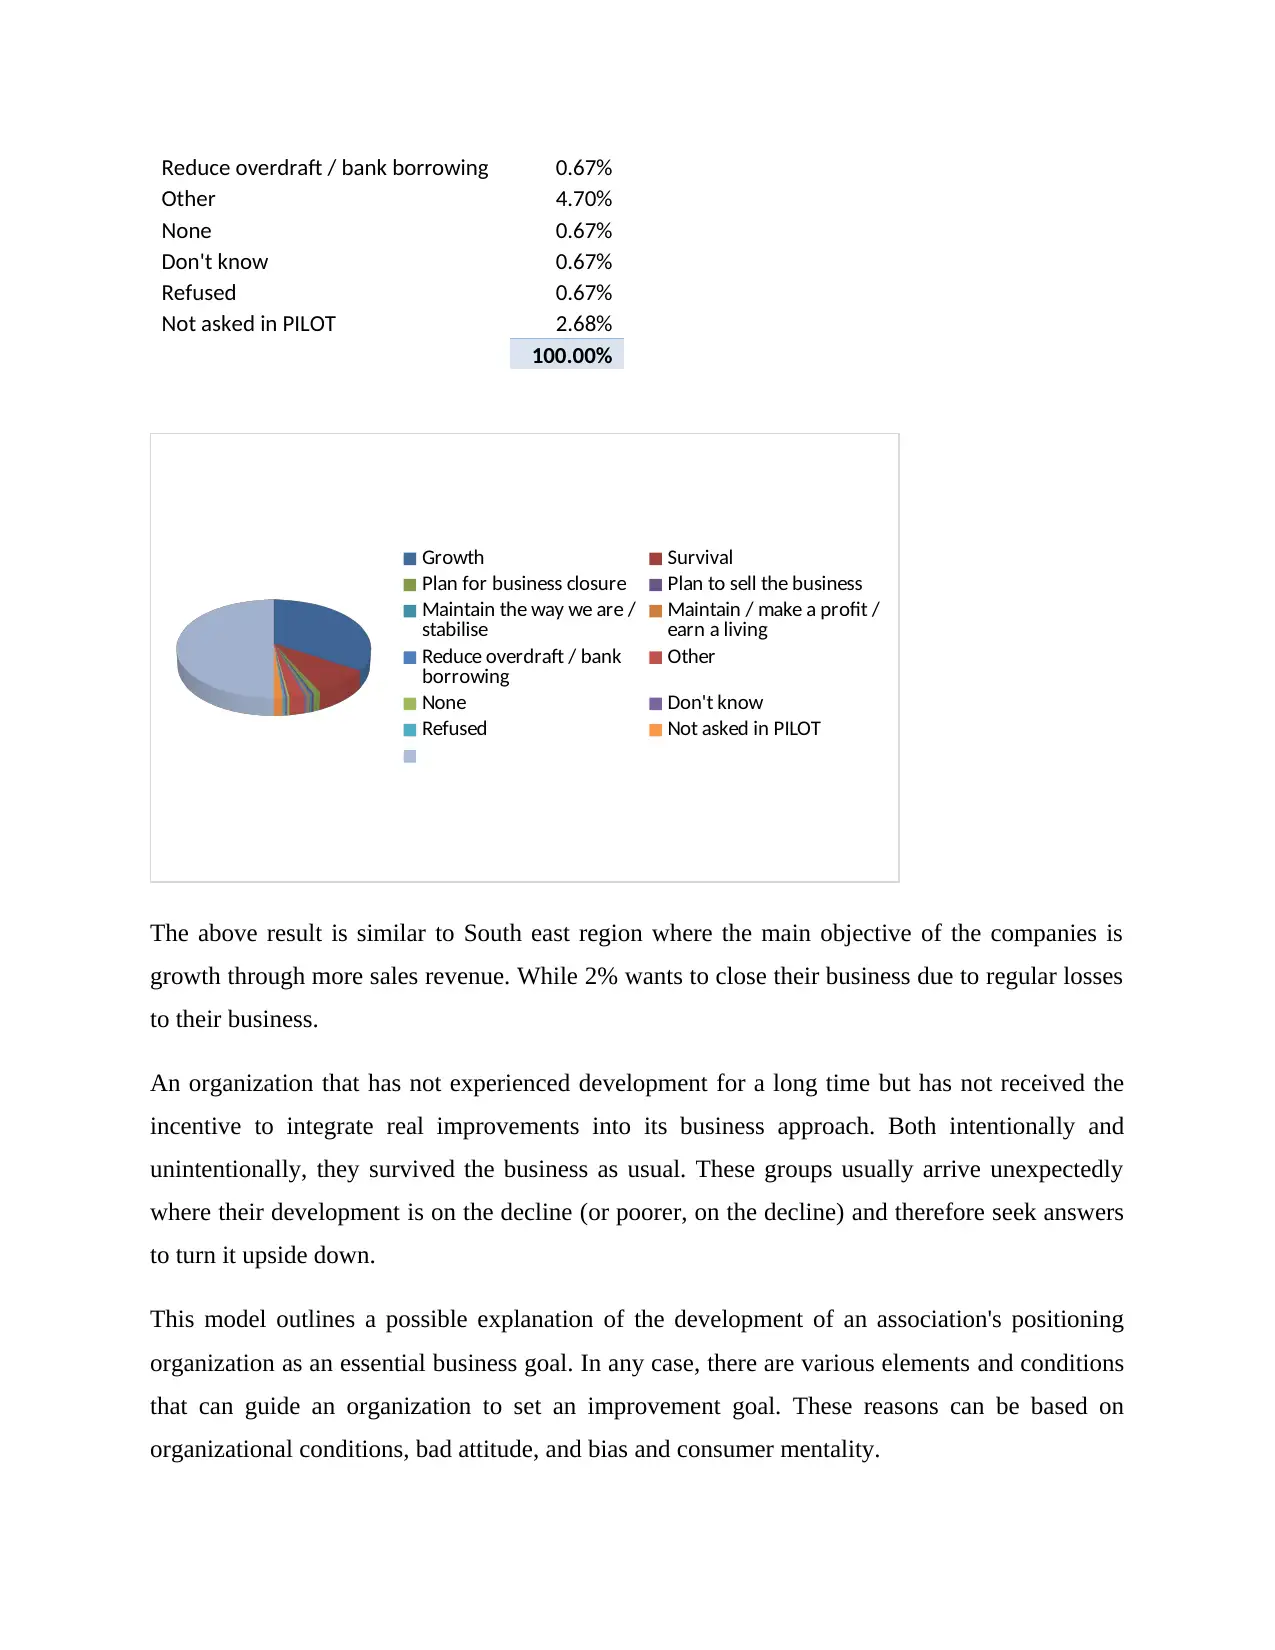
Reduce overdraft / bank borrowing 0.67%
Other 4.70%
None 0.67%
Don't know 0.67%
Refused 0.67%
Not asked in PILOT 2.68%
100.00%
Growth Survival
Plan for business closure Plan to sell the business
Maintain the way we are /
stabilise Maintain / make a profit /
earn a living
Reduce overdraft / bank
borrowing Other
None Don't know
Refused Not asked in PILOT
The above result is similar to South east region where the main objective of the companies is
growth through more sales revenue. While 2% wants to close their business due to regular losses
to their business.
An organization that has not experienced development for a long time but has not received the
incentive to integrate real improvements into its business approach. Both intentionally and
unintentionally, they survived the business as usual. These groups usually arrive unexpectedly
where their development is on the decline (or poorer, on the decline) and therefore seek answers
to turn it upside down.
This model outlines a possible explanation of the development of an association's positioning
organization as an essential business goal. In any case, there are various elements and conditions
that can guide an organization to set an improvement goal. These reasons can be based on
organizational conditions, bad attitude, and bias and consumer mentality.
Q5.5. Has your business actually grown over the past three years/ since established?
Explanation:
Growing companies have a wide range of problems. With the development of the business, a
number of problems and openings require different arrangements: what worked a year earlier
may not be the best approach. Often, avoidable messages transform what can be a wonderful
business in the same way.
South East Region:
Row Labels
Response
s
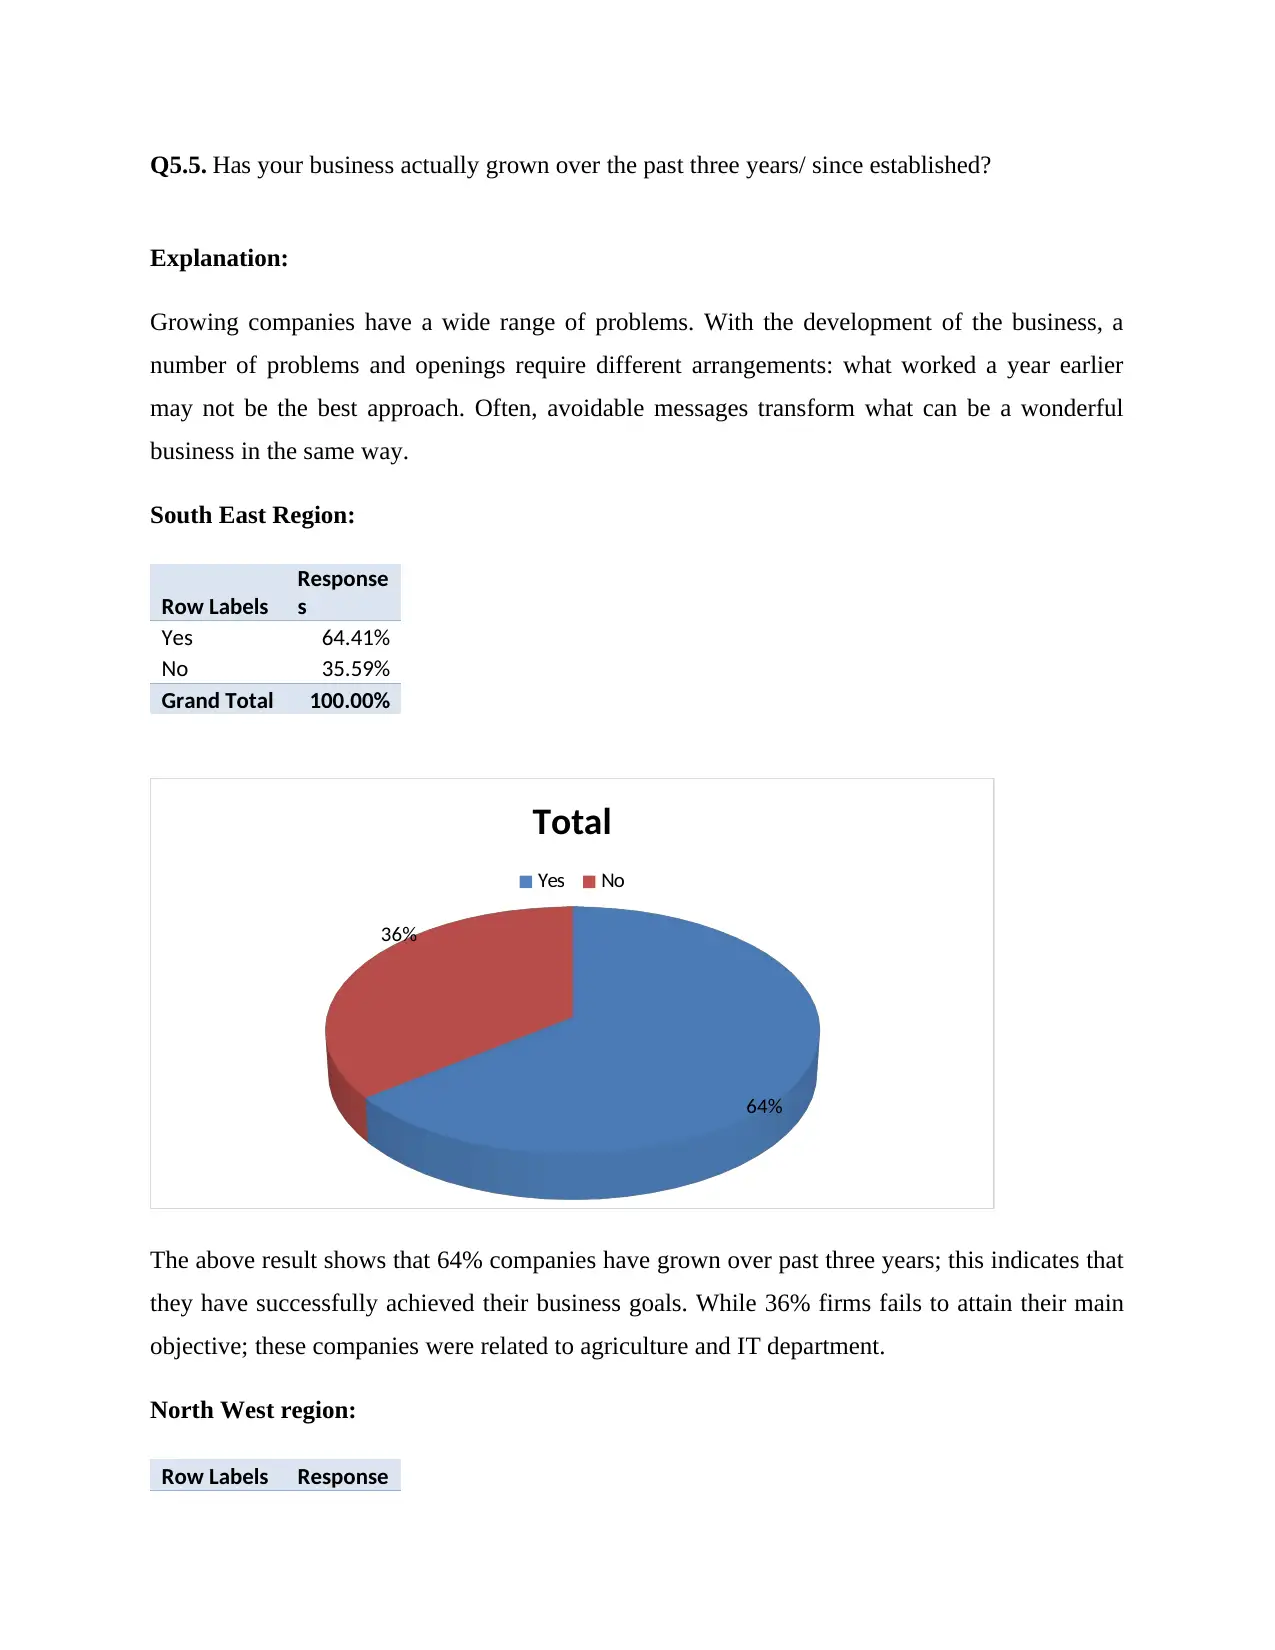
Yes 64.41%
No 35.59%
Grand Total 100.00%
64%
36%
Total
Yes No
The above result shows that 64% companies have grown over past three years; this indicates that
they have successfully achieved their business goals. While 36% firms fails to attain their main
objective; these companies were related to agriculture and IT department.
North West region:
Row Labels Response
Explanation:
Growing companies have a wide range of problems. With the development of the business, a
number of problems and openings require different arrangements: what worked a year earlier
may not be the best approach. Often, avoidable messages transform what can be a wonderful
business in the same way.
South East Region:
Row Labels
Response
s
Yes 64.41%
No 35.59%
Grand Total 100.00%
64%
36%
Total
Yes No
The above result shows that 64% companies have grown over past three years; this indicates that
they have successfully achieved their business goals. While 36% firms fails to attain their main
objective; these companies were related to agriculture and IT department.
North West region:
Row Labels Response
Secure Best Marks with AI Grader
Need help grading? Try our AI Grader for instant feedback on your assignments.
s
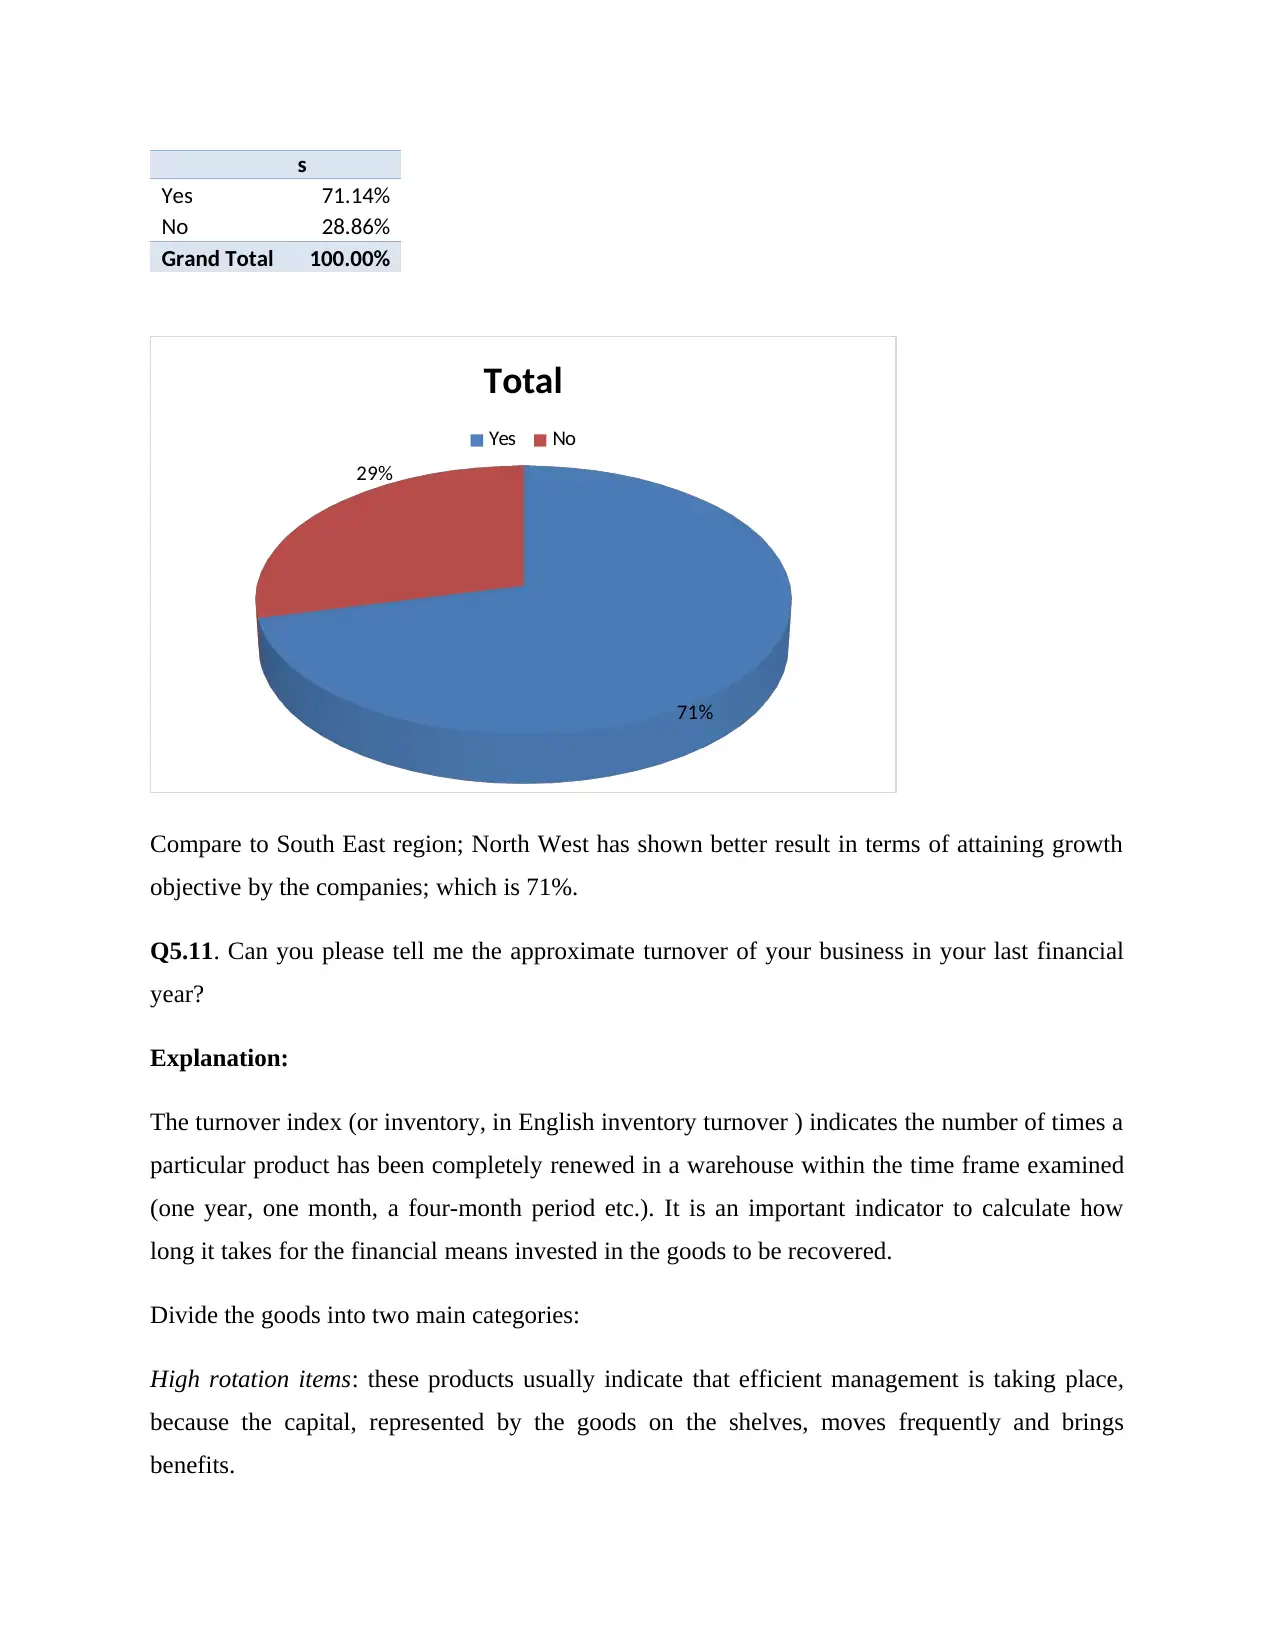
Yes 71.14%
No 28.86%
Grand Total 100.00%
71%
29%
Total
Yes No
Compare to South East region; North West has shown better result in terms of attaining growth
objective by the companies; which is 71%.
Q5.11. Can you please tell me the approximate turnover of your business in your last financial
year?
Explanation:
The turnover index (or inventory, in English inventory turnover ) indicates the number of times a
particular product has been completely renewed in a warehouse within the time frame examined
(one year, one month, a four-month period etc.). It is an important indicator to calculate how
long it takes for the financial means invested in the goods to be recovered.
Divide the goods into two main categories:
High rotation items: these products usually indicate that efficient management is taking place,
because the capital, represented by the goods on the shelves, moves frequently and brings
benefits.
Products at low rotation: this kind of products should be monitored closely, as a retainer in stock
product is interpreted as a signal of one of the little efficient inventory management.
South East Region:
Response
s
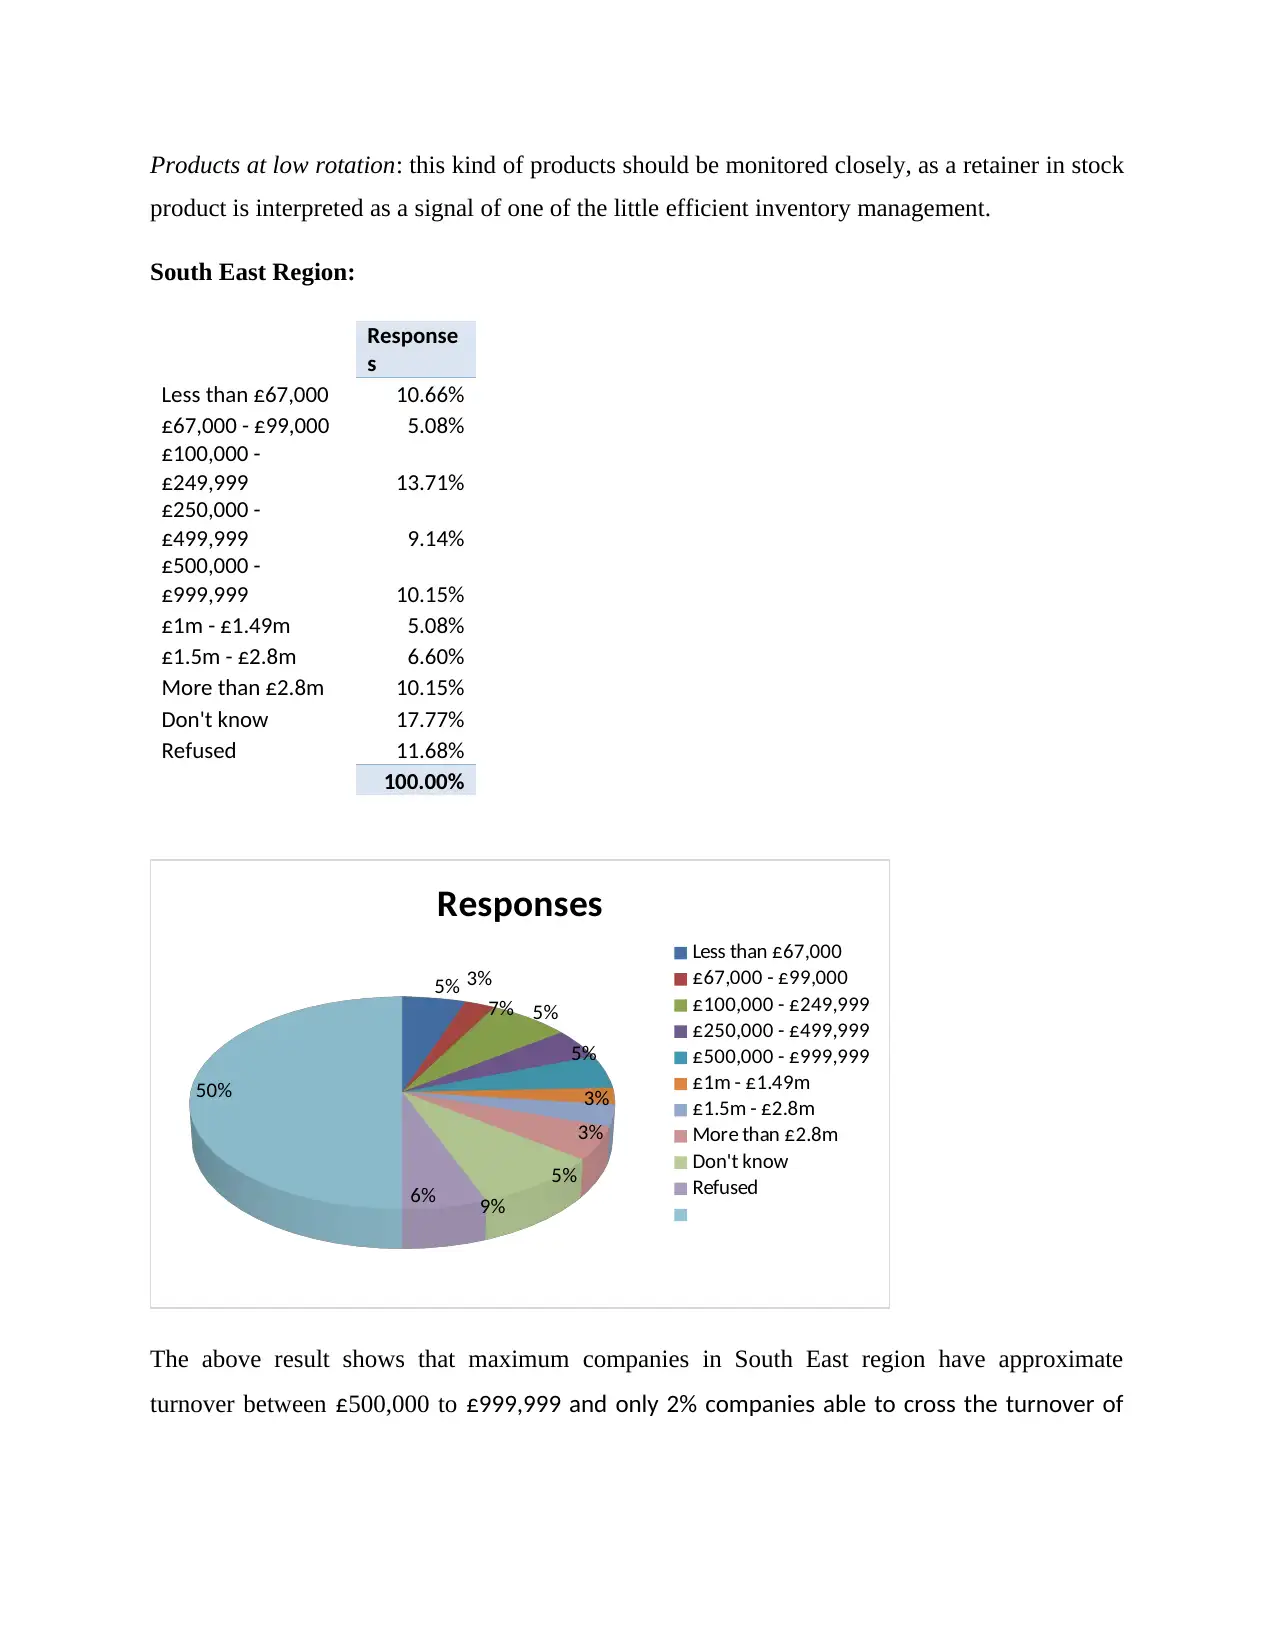
Less than £67,000 10.66%
£67,000 - £99,000 5.08%
£100,000 -
£249,999 13.71%
£250,000 -
£499,999 9.14%
£500,000 -
£999,999 10.15%
£1m - £1.49m 5.08%
£1.5m - £2.8m 6.60%
More than £2.8m 10.15%
Don't know 17.77%
Refused 11.68%
100.00%
5% 3%
7% 5%
5%
3%
3%
5%
9%
6%
50%
Responses
Less than £67,000
£67,000 - £99,000
£100,000 - £249,999
£250,000 - £499,999
£500,000 - £999,999
£1m - £1.49m
£1.5m - £2.8m
More than £2.8m
Don't know
Refused
The above result shows that maximum companies in South East region have approximate
turnover between £500,000 to £999,999 and only 2% companies able to cross the turnover of
product is interpreted as a signal of one of the little efficient inventory management.
South East Region:
Response
s
Less than £67,000 10.66%
£67,000 - £99,000 5.08%
£100,000 -
£249,999 13.71%
£250,000 -
£499,999 9.14%
£500,000 -
£999,999 10.15%
£1m - £1.49m 5.08%
£1.5m - £2.8m 6.60%
More than £2.8m 10.15%
Don't know 17.77%
Refused 11.68%
100.00%
5% 3%
7% 5%
5%
3%
3%
5%
9%
6%
50%
Responses
Less than £67,000
£67,000 - £99,000
£100,000 - £249,999
£250,000 - £499,999
£500,000 - £999,999
£1m - £1.49m
£1.5m - £2.8m
More than £2.8m
Don't know
Refused
The above result shows that maximum companies in South East region have approximate
turnover between £500,000 to £999,999 and only 2% companies able to cross the turnover of
£2.8 million. This indicates the average turnover of firm’s range between £500,000 and
£999,999.
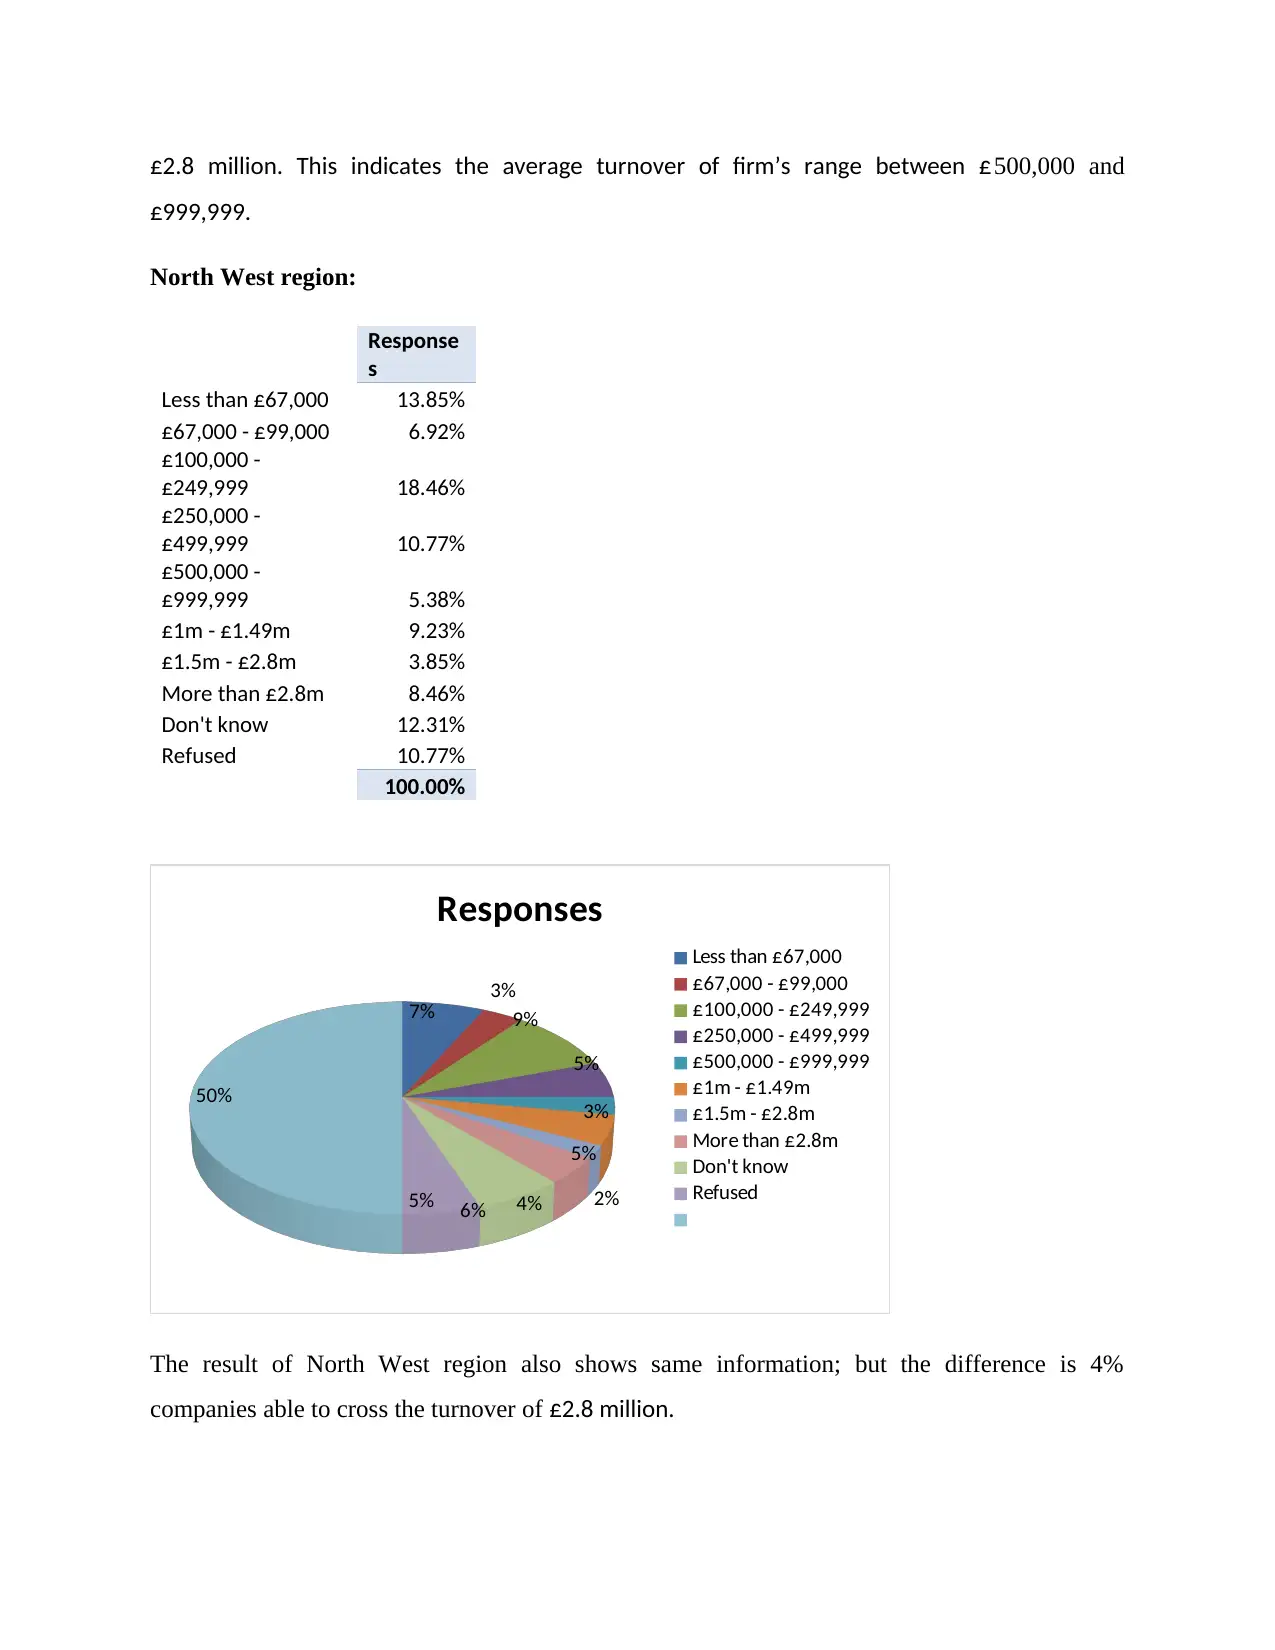
North West region:
Response
s
Less than £67,000 13.85%
£67,000 - £99,000 6.92%
£100,000 -
£249,999 18.46%
£250,000 -
£499,999 10.77%
£500,000 -
£999,999 5.38%
£1m - £1.49m 9.23%
£1.5m - £2.8m 3.85%
More than £2.8m 8.46%
Don't know 12.31%
Refused 10.77%
100.00%
7%
3%
9%
5%
3%
5%
2%4%6%
5%
50%
Responses
Less than £67,000
£67,000 - £99,000
£100,000 - £249,999
£250,000 - £499,999
£500,000 - £999,999
£1m - £1.49m
£1.5m - £2.8m
More than £2.8m
Don't know
Refused
The result of North West region also shows same information; but the difference is 4%
companies able to cross the turnover of £2.8 million.
£999,999.
North West region:
Response
s
Less than £67,000 13.85%
£67,000 - £99,000 6.92%
£100,000 -
£249,999 18.46%
£250,000 -
£499,999 10.77%
£500,000 -
£999,999 5.38%
£1m - £1.49m 9.23%
£1.5m - £2.8m 3.85%
More than £2.8m 8.46%
Don't know 12.31%
Refused 10.77%
100.00%
7%
3%
9%
5%
3%
5%
2%4%6%
5%
50%
Responses
Less than £67,000
£67,000 - £99,000
£100,000 - £249,999
£250,000 - £499,999
£500,000 - £999,999
£1m - £1.49m
£1.5m - £2.8m
More than £2.8m
Don't know
Refused
The result of North West region also shows same information; but the difference is 4%
companies able to cross the turnover of £2.8 million.
Paraphrase This Document
Need a fresh take? Get an instant paraphrase of this document with our AI Paraphraser
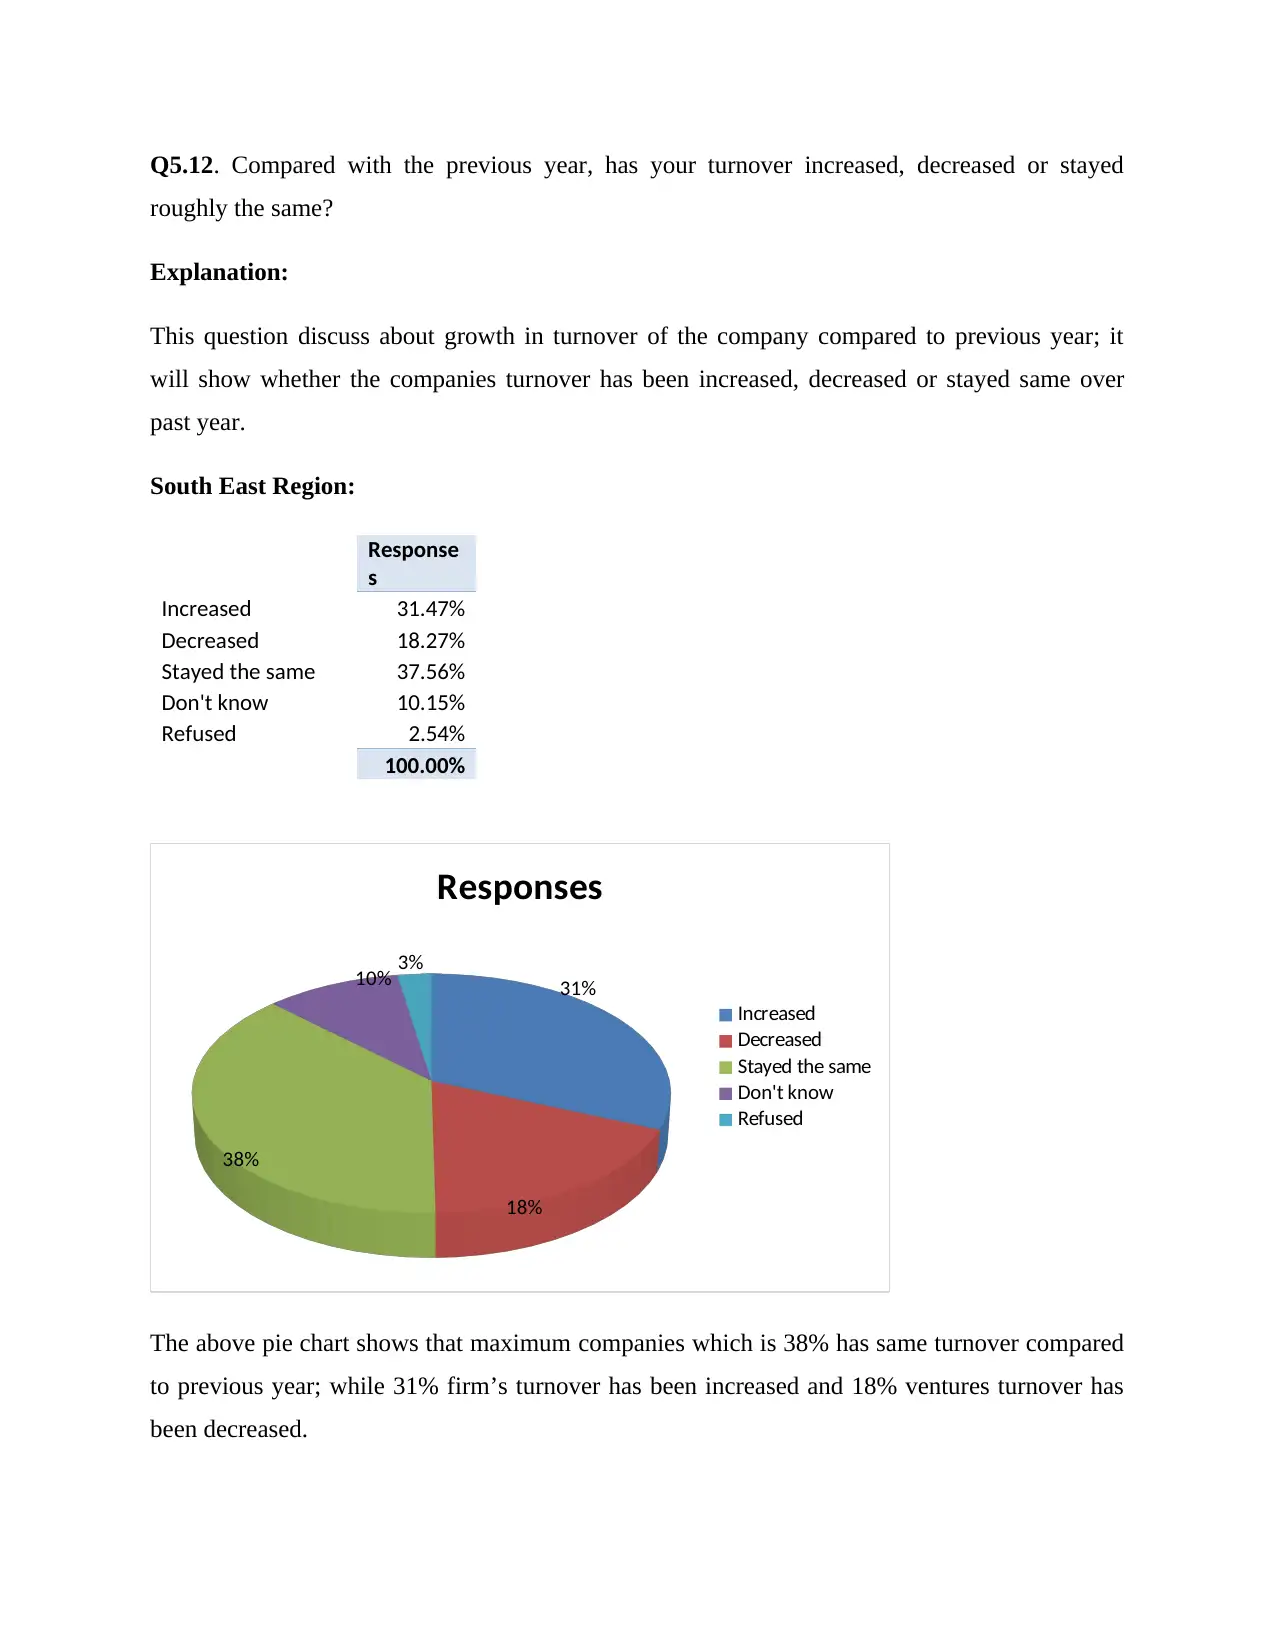
Q5.12. Compared with the previous year, has your turnover increased, decreased or stayed
roughly the same?
Explanation:
This question discuss about growth in turnover of the company compared to previous year; it
will show whether the companies turnover has been increased, decreased or stayed same over
past year.
South East Region:
Response
s
Increased 31.47%
Decreased 18.27%
Stayed the same 37.56%
Don't know 10.15%
Refused 2.54%
100.00%
31%
18%
38%
10% 3%
Responses
Increased
Decreased
Stayed the same
Don't know
Refused
The above pie chart shows that maximum companies which is 38% has same turnover compared
to previous year; while 31% firm’s turnover has been increased and 18% ventures turnover has
been decreased.
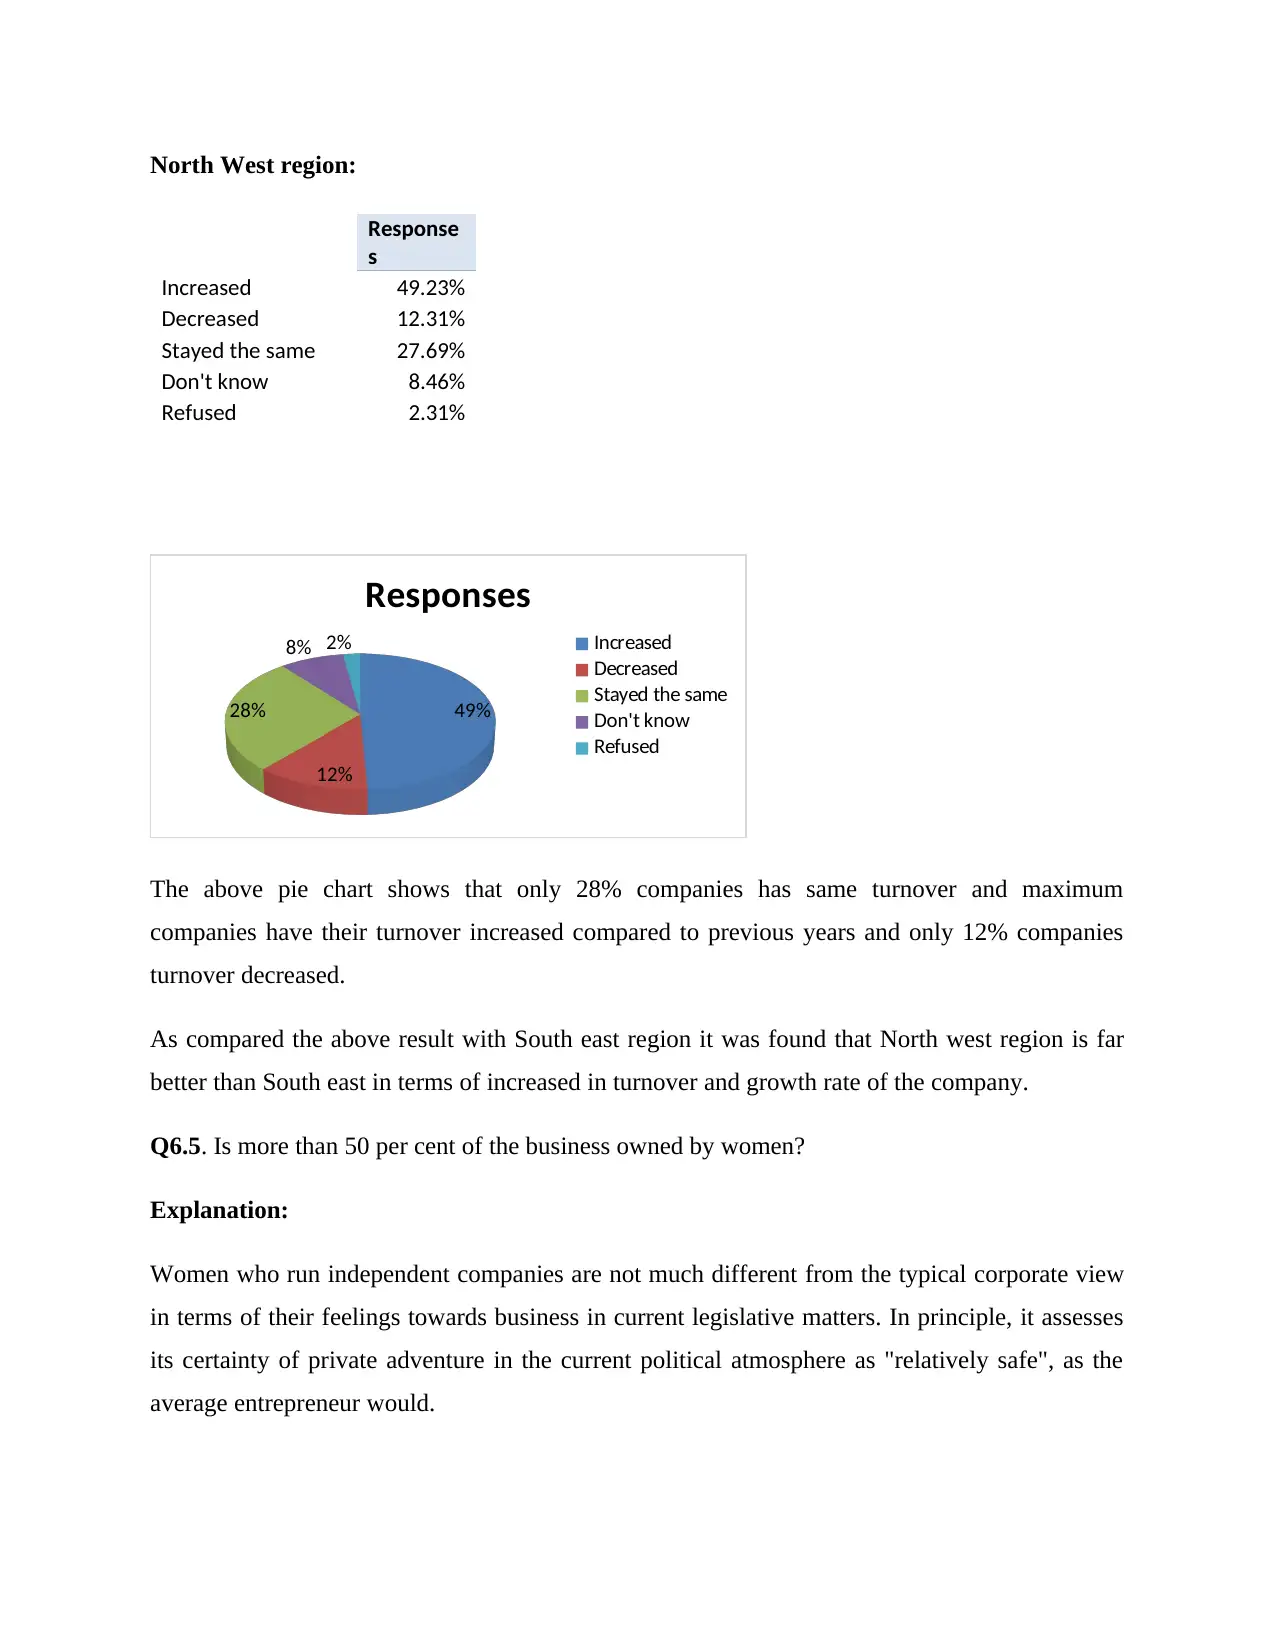
North West region:
Response
s
Increased 49.23%
Decreased 12.31%
Stayed the same 27.69%
Don't know 8.46%
Refused 2.31%
49%
12%
28%
8% 2%
Responses
Increased
Decreased
Stayed the same
Don't know
Refused
The above pie chart shows that only 28% companies has same turnover and maximum
companies have their turnover increased compared to previous years and only 12% companies
turnover decreased.
As compared the above result with South east region it was found that North west region is far
better than South east in terms of increased in turnover and growth rate of the company.
Q6.5. Is more than 50 per cent of the business owned by women?
Explanation:
Women who run independent companies are not much different from the typical corporate view
in terms of their feelings towards business in current legislative matters. In principle, it assesses
its certainty of private adventure in the current political atmosphere as "relatively safe", as the
average entrepreneur would.
Compared to the average entrepreneur, women who go into business work that way for a wider
range of reasons. While most mainstream entrepreneurs (55 percent) are encouraged to start a
business to work on their own, only 31 percent of women share that inspiration.
While lack of capital or potential income is a prime test for female entrepreneurs (model for over
three years), producer selection and retention has moved on to the next larger trial . Like other
entrepreneurs in a time of financially supported development and memorable unemployment
rates, businesswomen consider it difficult to attract and retain employees. View and advertise the
balance of the three major problems for female entrepreneurs - another long-standing model.
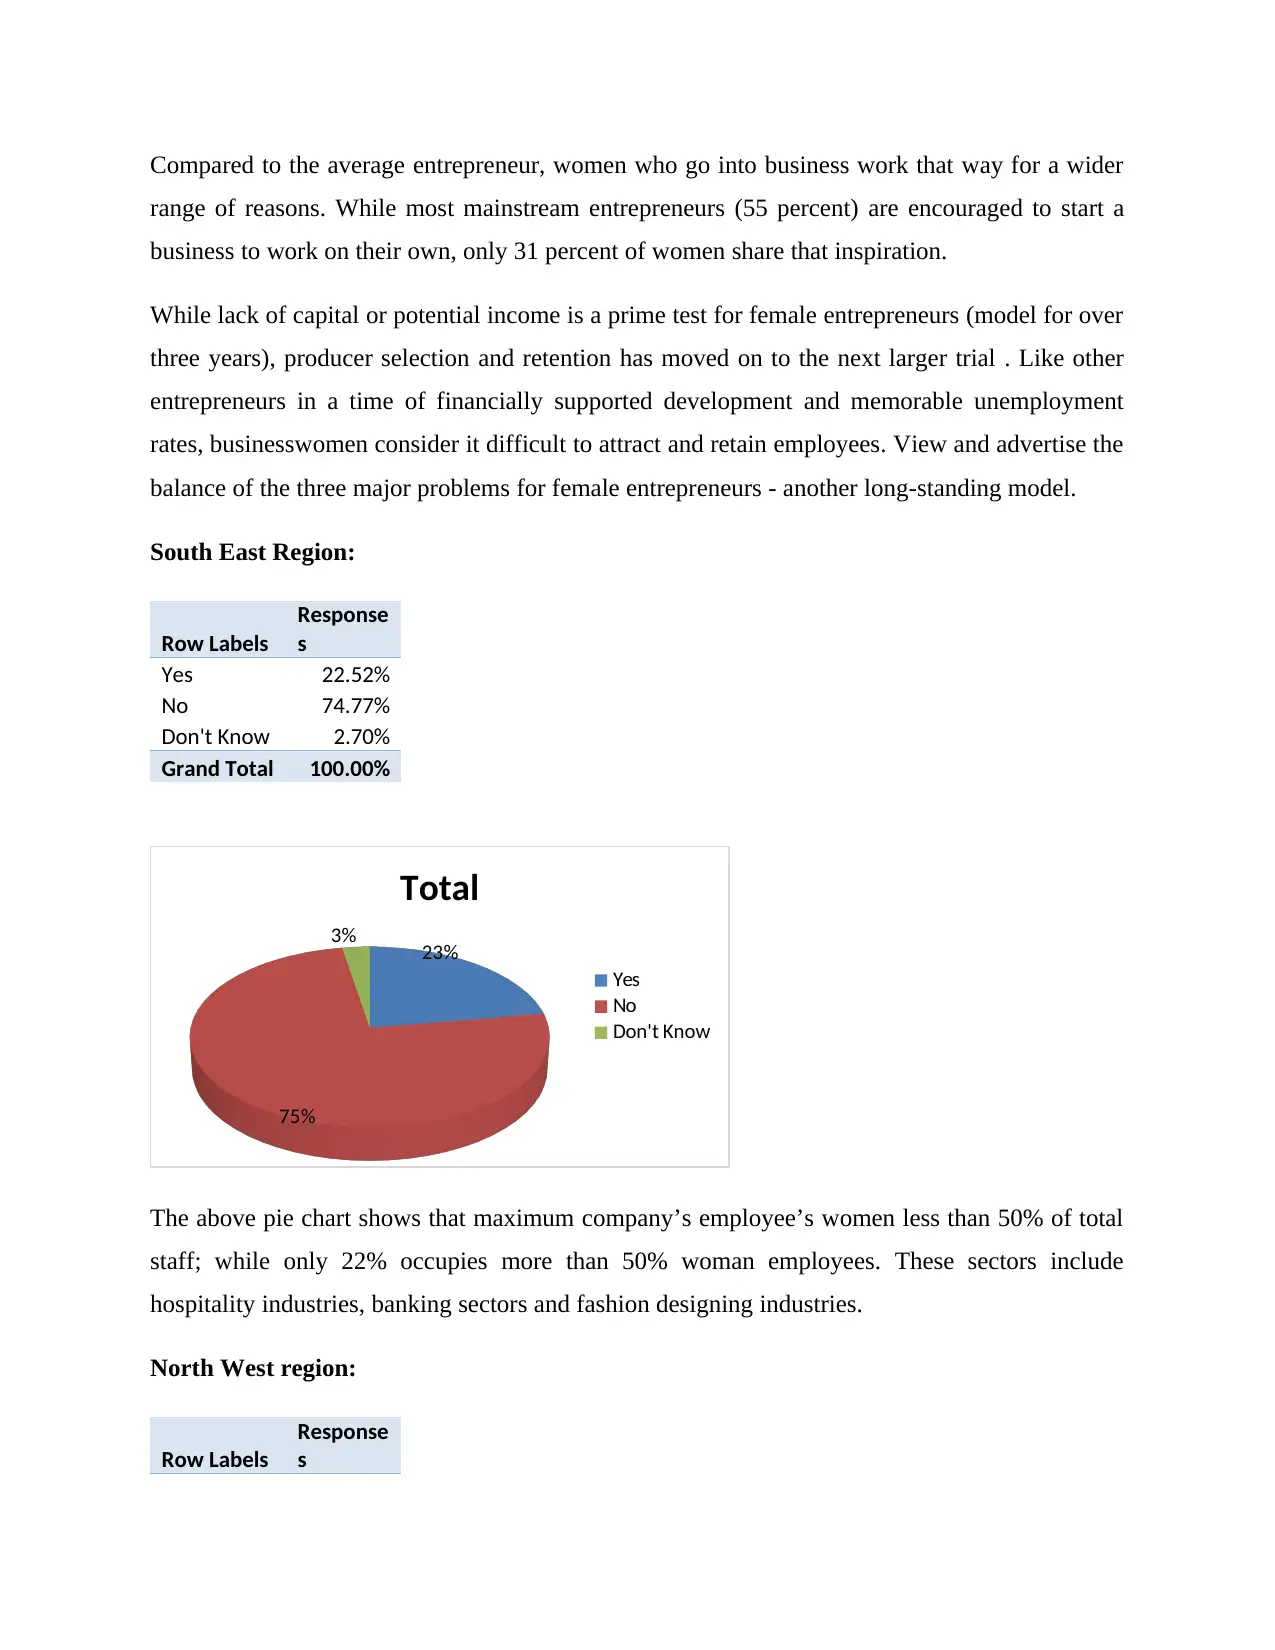
South East Region:
Row Labels
Response
s
Yes 22.52%
No 74.77%
Don't Know 2.70%
Grand Total 100.00%
23%
75%
3%
Total
Yes
No
Don't Know
The above pie chart shows that maximum company’s employee’s women less than 50% of total
staff; while only 22% occupies more than 50% woman employees. These sectors include
hospitality industries, banking sectors and fashion designing industries.
North West region:
Row Labels
Response
s
range of reasons. While most mainstream entrepreneurs (55 percent) are encouraged to start a
business to work on their own, only 31 percent of women share that inspiration.
While lack of capital or potential income is a prime test for female entrepreneurs (model for over
three years), producer selection and retention has moved on to the next larger trial . Like other
entrepreneurs in a time of financially supported development and memorable unemployment
rates, businesswomen consider it difficult to attract and retain employees. View and advertise the
balance of the three major problems for female entrepreneurs - another long-standing model.
South East Region:
Row Labels
Response
s
Yes 22.52%
No 74.77%
Don't Know 2.70%
Grand Total 100.00%
23%
75%
3%
Total
Yes
No
Don't Know
The above pie chart shows that maximum company’s employee’s women less than 50% of total
staff; while only 22% occupies more than 50% woman employees. These sectors include
hospitality industries, banking sectors and fashion designing industries.
North West region:
Row Labels
Response
s
Secure Best Marks with AI Grader
Need help grading? Try our AI Grader for instant feedback on your assignments.
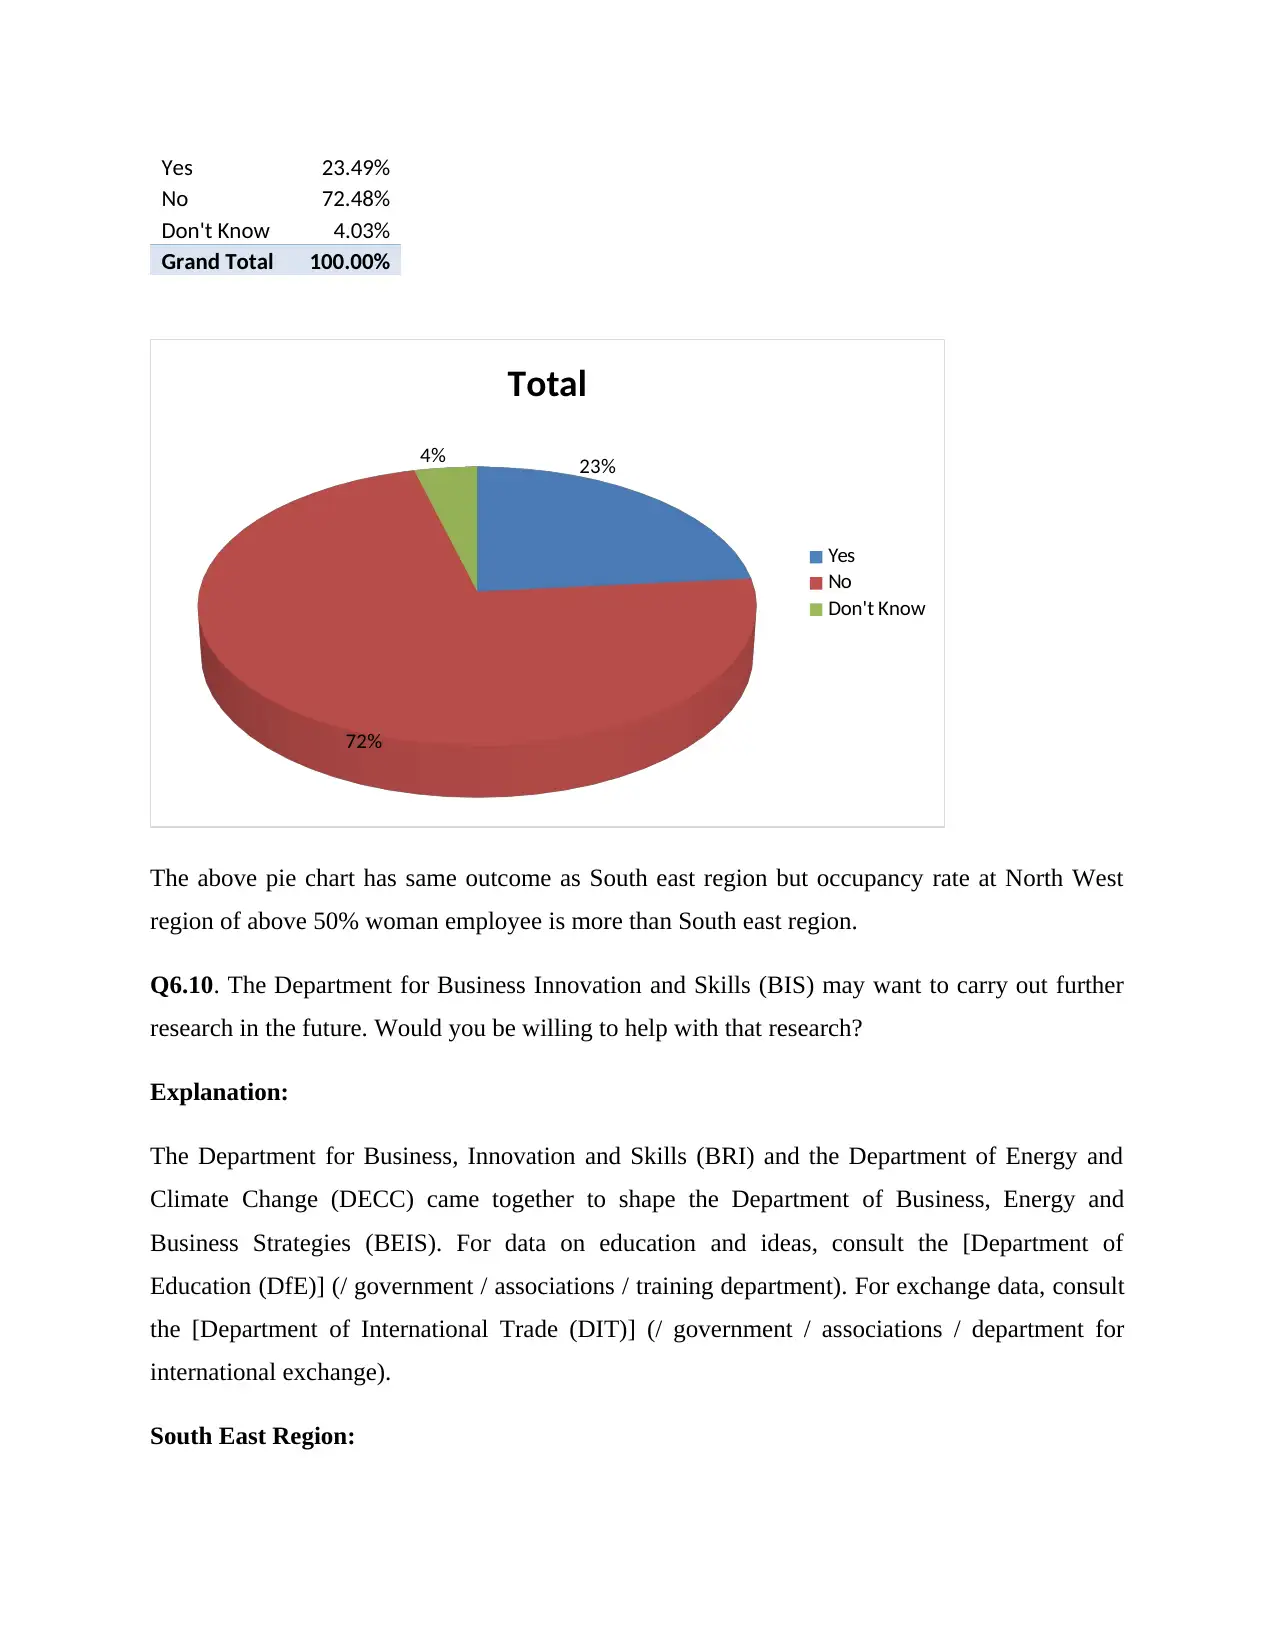
Yes 23.49%
No 72.48%
Don't Know 4.03%
Grand Total 100.00%
23%
72%
4%
Total
Yes
No
Don't Know
The above pie chart has same outcome as South east region but occupancy rate at North West
region of above 50% woman employee is more than South east region.
Q6.10. The Department for Business Innovation and Skills (BIS) may want to carry out further
research in the future. Would you be willing to help with that research?
Explanation:
The Department for Business, Innovation and Skills (BRI) and the Department of Energy and
Climate Change (DECC) came together to shape the Department of Business, Energy and
Business Strategies (BEIS). For data on education and ideas, consult the [Department of
Education (DfE)] (/ government / associations / training department). For exchange data, consult
the [Department of International Trade (DIT)] (/ government / associations / department for
international exchange).
South East Region:
Row Labels
Response
s
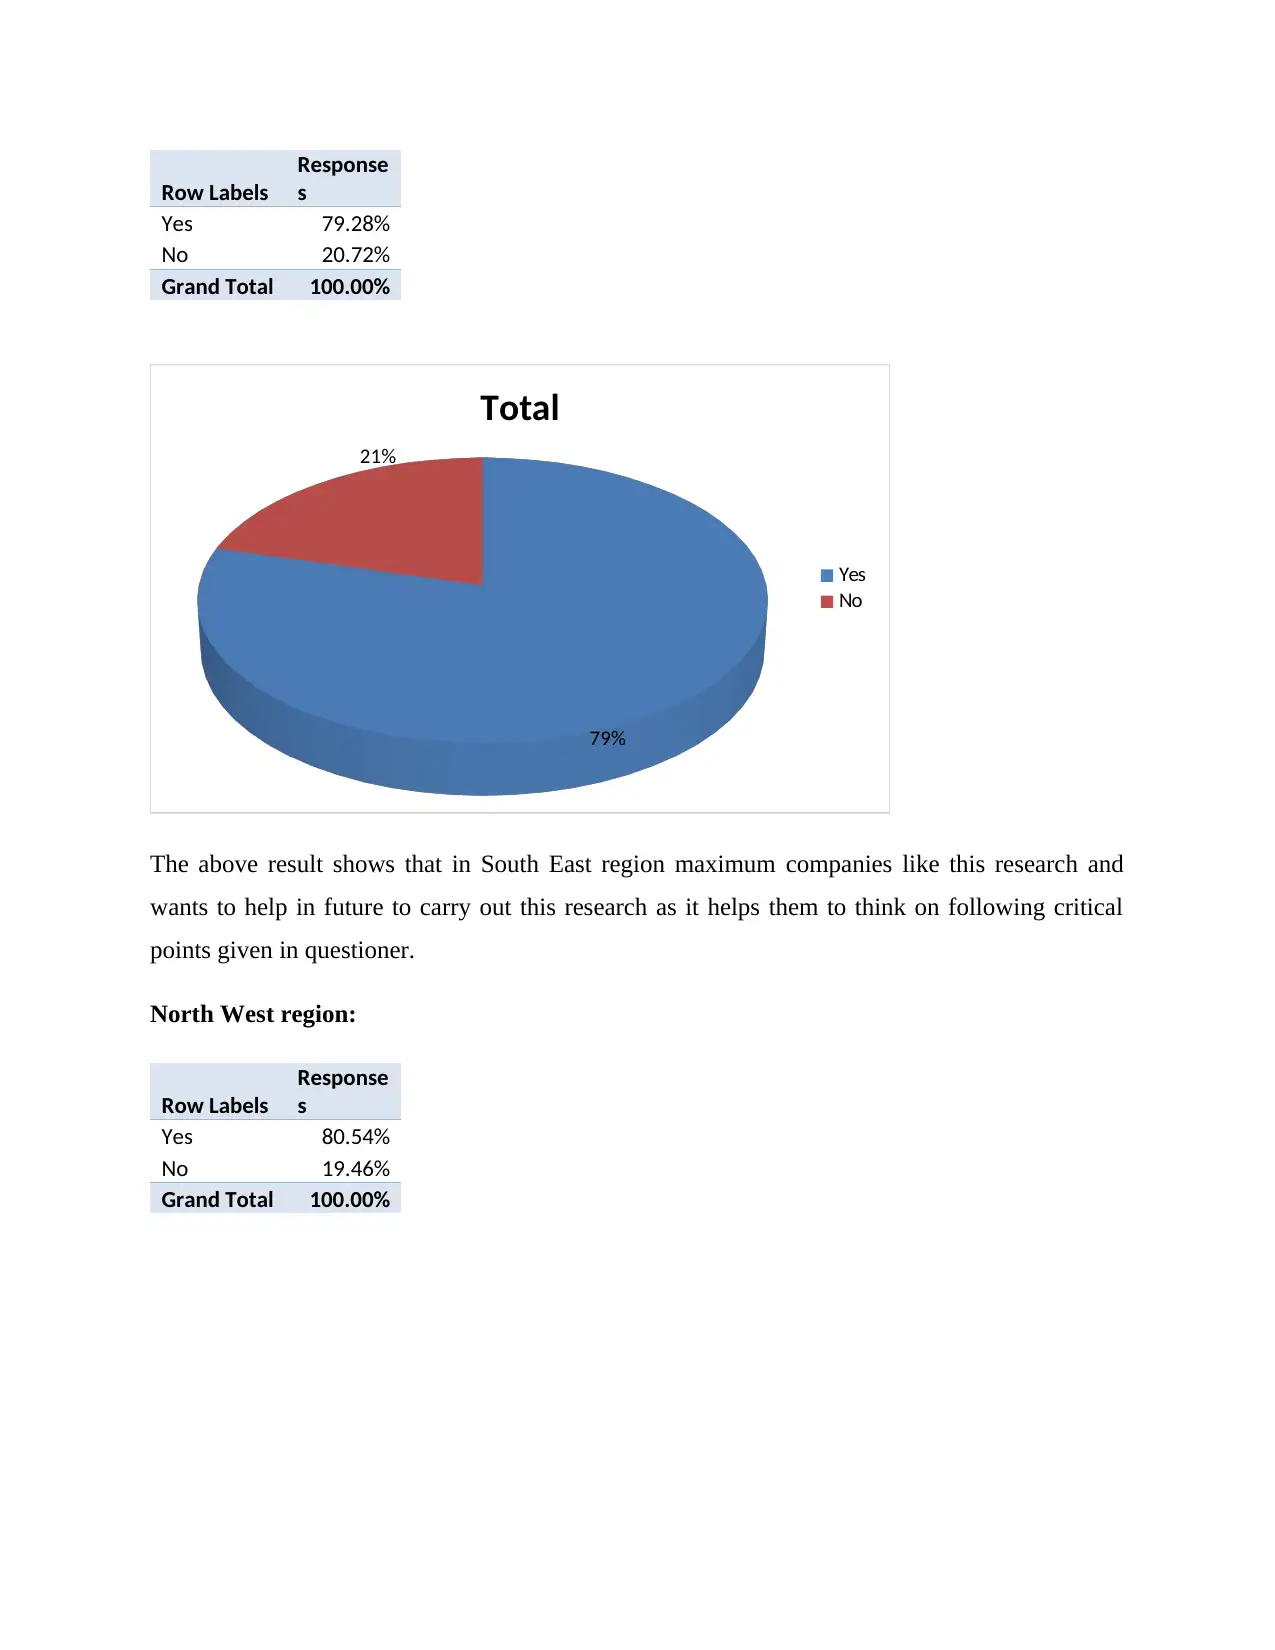
Yes 79.28%
No 20.72%
Grand Total 100.00%
79%
21%
Total
Yes
No
The above result shows that in South East region maximum companies like this research and
wants to help in future to carry out this research as it helps them to think on following critical
points given in questioner.
North West region:
Row Labels
Response
s
Yes 80.54%
No 19.46%
Grand Total 100.00%
Response
s
Yes 79.28%
No 20.72%
Grand Total 100.00%
79%
21%
Total
Yes
No
The above result shows that in South East region maximum companies like this research and
wants to help in future to carry out this research as it helps them to think on following critical
points given in questioner.
North West region:
Row Labels
Response
s
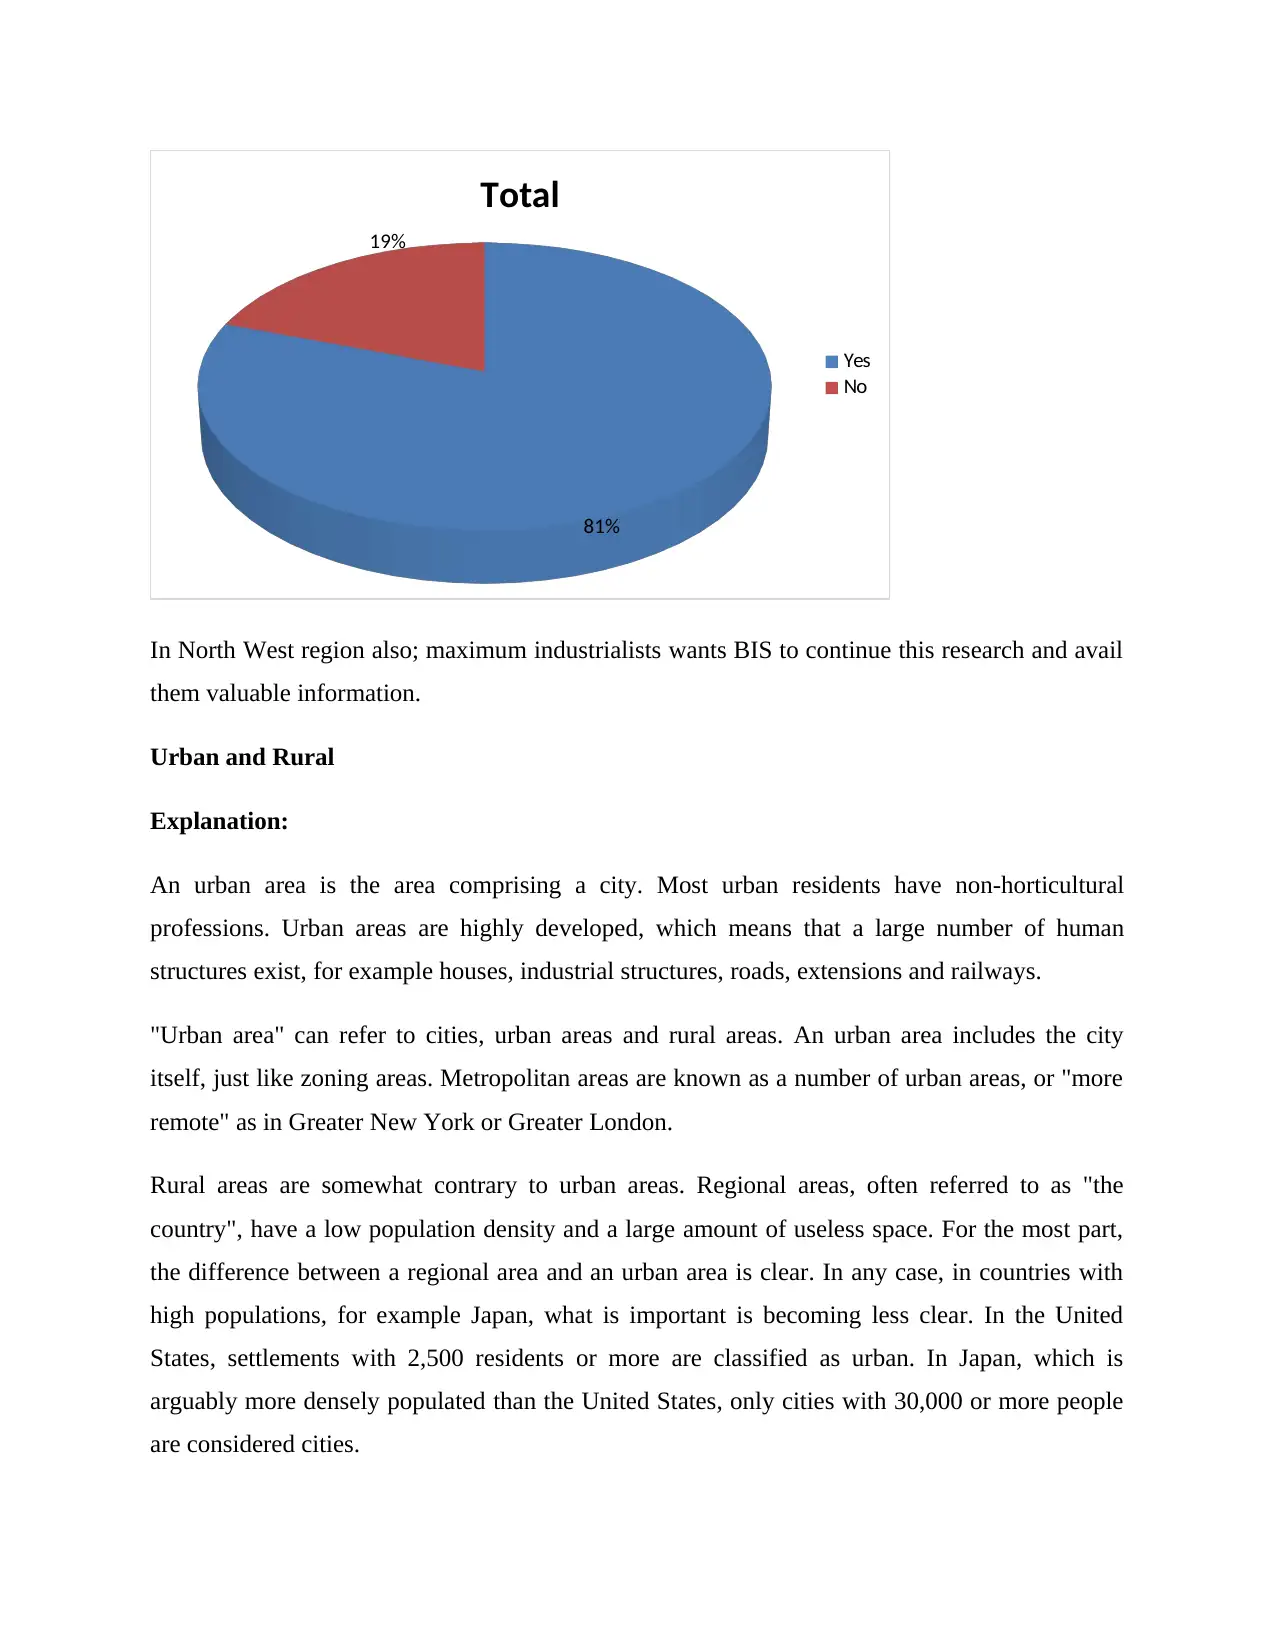
Yes 80.54%
No 19.46%
Grand Total 100.00%
81%
19%
Total
Yes
No
In North West region also; maximum industrialists wants BIS to continue this research and avail
them valuable information.
Urban and Rural
Explanation:
An urban area is the area comprising a city. Most urban residents have non-horticultural
professions. Urban areas are highly developed, which means that a large number of human
structures exist, for example houses, industrial structures, roads, extensions and railways.
"Urban area" can refer to cities, urban areas and rural areas. An urban area includes the city
itself, just like zoning areas. Metropolitan areas are known as a number of urban areas, or "more
remote" as in Greater New York or Greater London.
Rural areas are somewhat contrary to urban areas. Regional areas, often referred to as "the
country", have a low population density and a large amount of useless space. For the most part,
the difference between a regional area and an urban area is clear. In any case, in countries with
high populations, for example Japan, what is important is becoming less clear. In the United
States, settlements with 2,500 residents or more are classified as urban. In Japan, which is
arguably more densely populated than the United States, only cities with 30,000 or more people
are considered cities.
Paraphrase This Document
Need a fresh take? Get an instant paraphrase of this document with our AI Paraphraser
South East Region:
Row Labels
Reponse
s
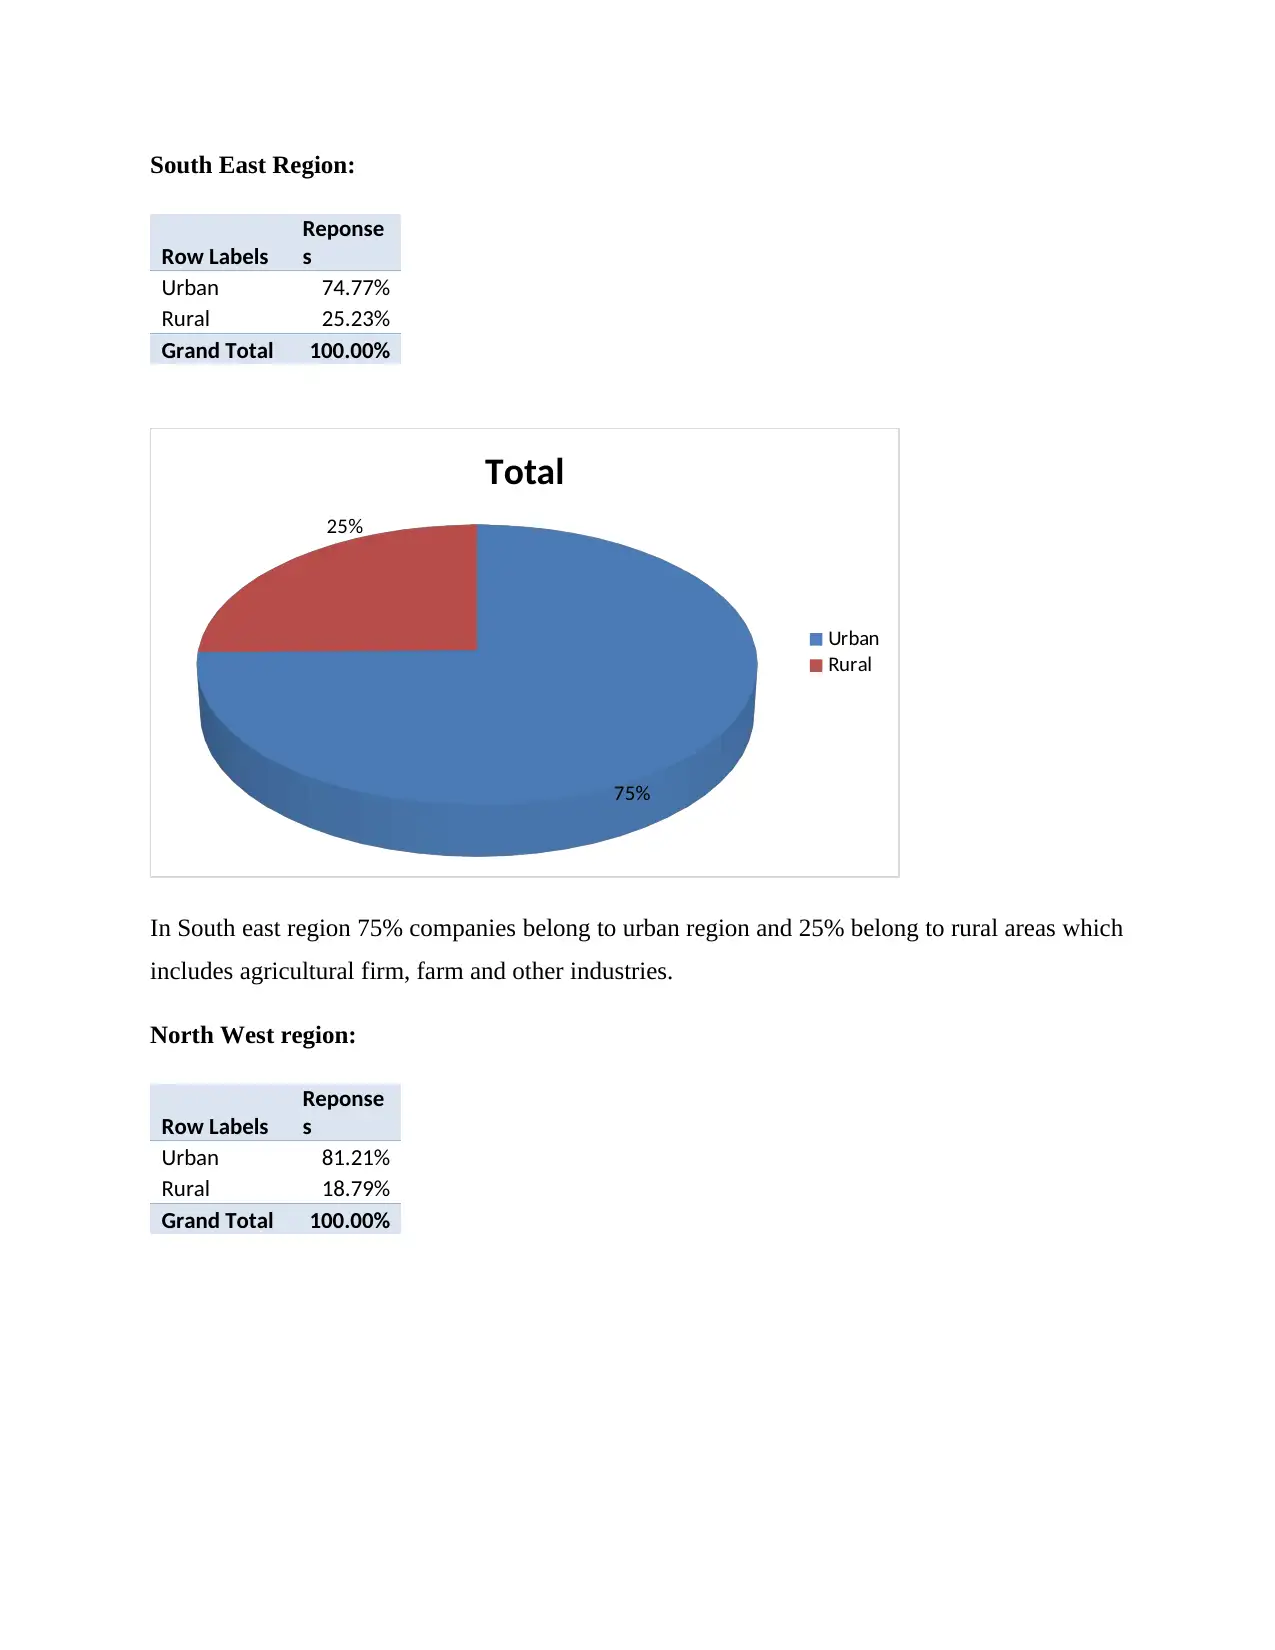
Urban 74.77%
Rural 25.23%
Grand Total 100.00%
75%
25%
Total
Urban
Rural
In South east region 75% companies belong to urban region and 25% belong to rural areas which
includes agricultural firm, farm and other industries.
North West region:
Row Labels
Reponse
s
Urban 81.21%
Rural 18.79%
Grand Total 100.00%
Row Labels
Reponse
s
Urban 74.77%
Rural 25.23%
Grand Total 100.00%
75%
25%
Total
Urban
Rural
In South east region 75% companies belong to urban region and 25% belong to rural areas which
includes agricultural firm, farm and other industries.
North West region:
Row Labels
Reponse
s
Urban 81.21%
Rural 18.79%
Grand Total 100.00%
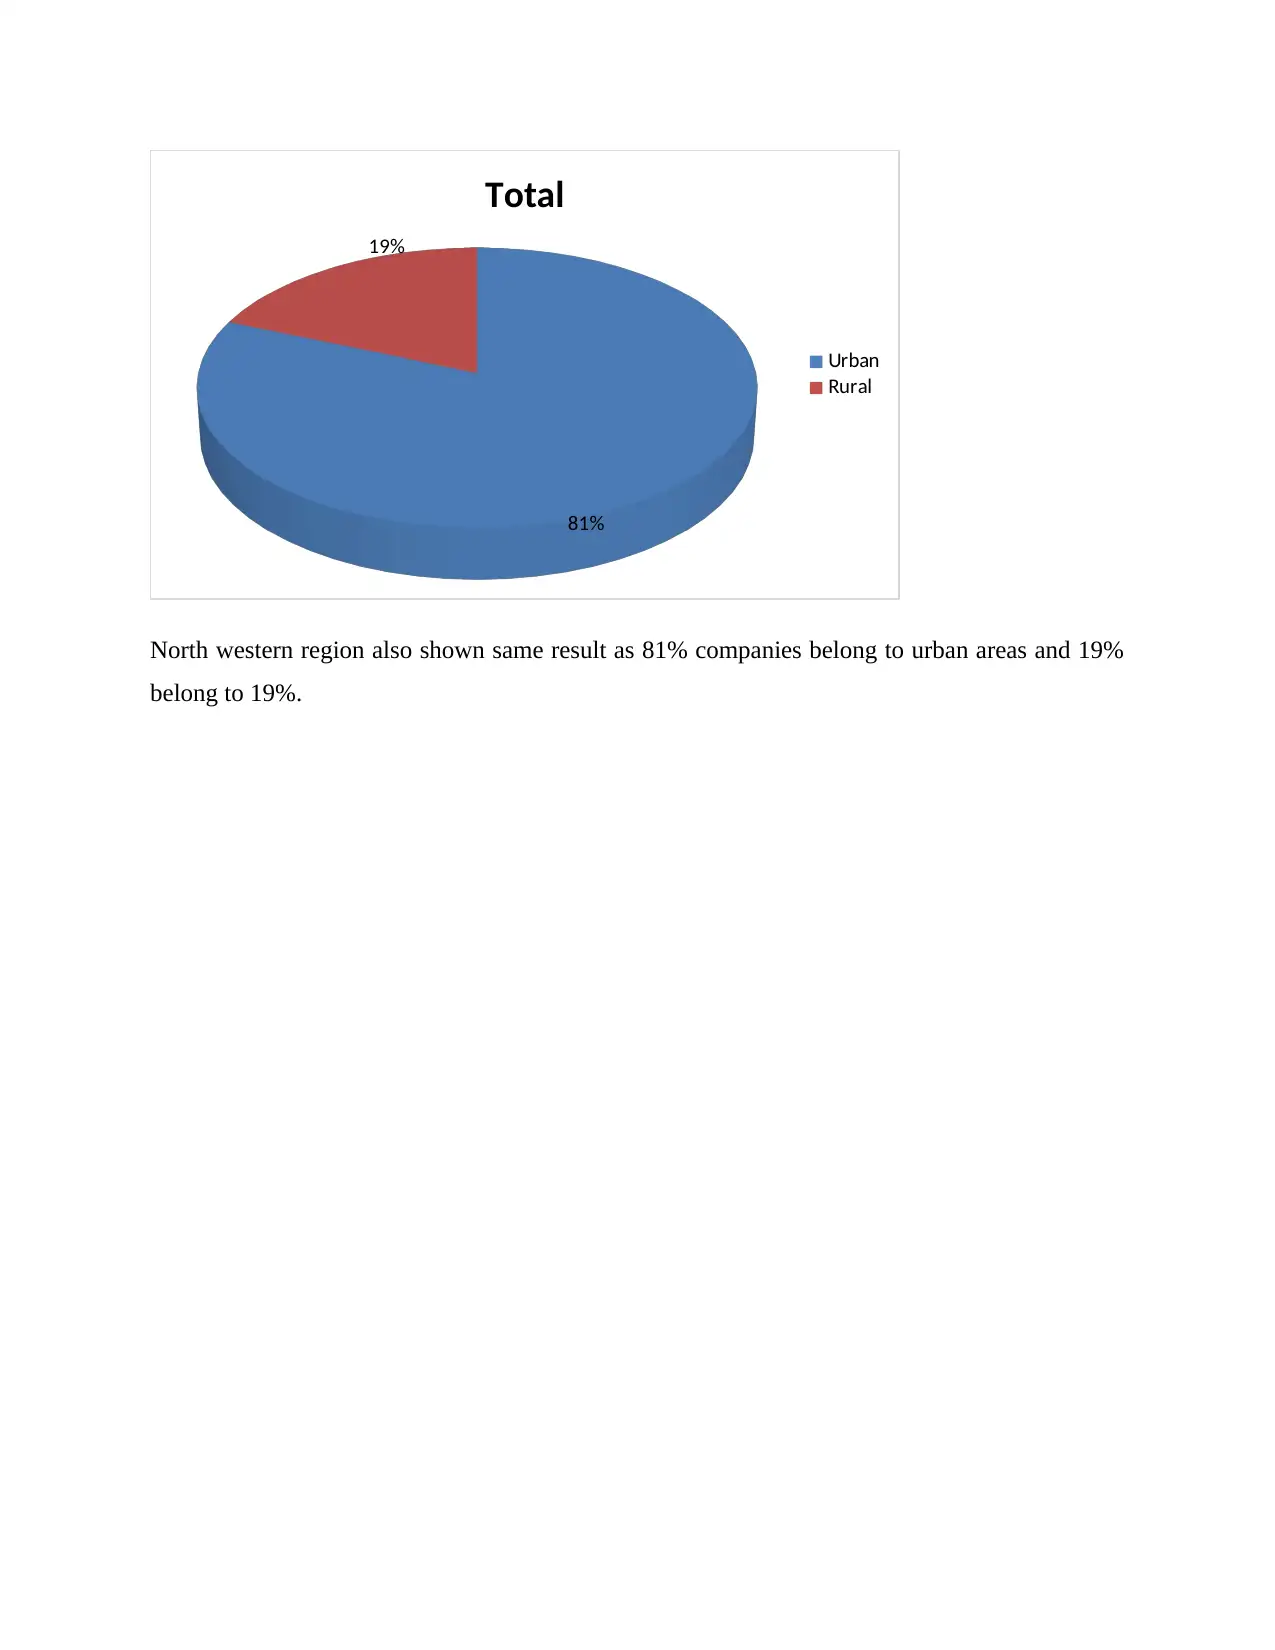
81%
19%
Total
Urban
Rural
North western region also shown same result as 81% companies belong to urban areas and 19%
belong to 19%.
19%
Total
Urban
Rural
North western region also shown same result as 81% companies belong to urban areas and 19%
belong to 19%.
1 out of 21


Your All-in-One AI-Powered Toolkit for Academic Success.
+13062052269
info@desklib.com
Available 24*7 on WhatsApp / Email
![[object Object]](/_next/static/media/star-bottom.7253800d.svg)
Unlock your academic potential
© 2024 | Zucol Services PVT LTD | All rights reserved.