Improving Learning Through Data: A NAPLAN Test Analysis for Schools
VerifiedAdded on 2023/04/06
|18
|3860
|494
Report
AI Summary
This report presents an analysis of NAPLAN test data from two Australian primary schools, Aberdeen Public School and Bald Face Public School, focusing on numeracy, grammar, and punctuation skills. The study employs both quantitative and qualitative research methods, including analysis of gender and race distributions, and NAPLAN scores. The situational analysis compares the schools based on student demographics and performance. The report aims to identify significant issues and propose a broad education plan, informed by educational research, to improve student learning outcomes. The report includes gender distribution, race, and NAPLAN outcomes, comparing student performance against national peers. Finally, the report provides an overview of the research methods, data analysis, and findings, to inform the development of an education plan that addresses the identified issues and promotes improved learning for all students.
Running Head: Using Data to Improve Learning 1
Using Data to Improve Learning
Using Data to Improve Learning
Paraphrase This Document
Need a fresh take? Get an instant paraphrase of this document with our AI Paraphraser
Using Data to Improve Learning 2
Table of Contents
Introduction:....................................................................................................................................3
Background:.................................................................................................................................3
Research objectives:....................................................................................................................4
NAPLAN tests:............................................................................................................................4
Research method:.............................................................................................................................5
Situational analysis:.........................................................................................................................6
Quantitative data analysis:...........................................................................................................7
Qualitative data analysis:...........................................................................................................14
Findings and discussion:................................................................................................................15
References......................................................................................................................................16
Using Data to Improve Learning 3
Introduction:
The paper would strive to emancipate a study to understand the level of knowledge that the
primary students across the different Australian territories. The study would explore the
numeracy ability and understanding of the grammar and punctuations for the students of the KS3
level students in the primary schools across the countries. The research would uphold the
relevance of the sorts of data that would be helpful in understanding the education level of the
students at the primary schools – Aberdeen Public School and Bald Face Public School. The data
and information would be sourced from these schools to have an insight of the understanding of
numeric along with grammar and punctuation and run a comparison between the two. The sorts
of quantitative and qualitative data would be used for the purpose and quantified on the basis of
the gender for the above mentioned metrics.
Background:
Education thrives to be an important aspect in development of mankind and a purposeful
education is quite significant for economic and social progress. In this regard the aspect of
numerical abilities along with grammar and punctuation plays an important role in creating an
effective pool of human resources and the same is valid for the Australian society as well
(UNESCO, 2019). This sort of educational evaluation at the primary level is quite necessary as it
strives for the ideal time to develop the fundamental knowledge. The KS3 level is an ideal time
when a child ponders from childhood towards early teenage years or from primary to secondary
schools. So it strives for an ideal scope to understand the capability of the students in developing
their numerical skills and grammar knowledge from an early stage of their student life. The study
has far reaching implications in striking a development phase for the future workforce in the
Australian scenario.
The primary level of education in the Australian scenario has its impression in turning the kids
into fine gentlemen. It is noted that the Australian education scenario is characterised with
smaller students’ size numbering up to 30 students in a particular class. This phenomenon would
be very much effective in understanding the prominence of the university trained, highly skilled
teachers giving their attention to the individual needs of the students. It definitely strives to
develop the relationship between the teachers and their students. This kind of relationship is very
⊘ This is a preview!⊘
Do you want full access?
Subscribe today to unlock all pages.
Trusted by 1+ million students worldwide
Using Data to Improve Learning 4
much beneficial for the teachers to have an understanding of the issues that obstruct in having
their expertise in numeric and grammatical knowledge (UNICEF, 2019). In this regard the
NAPLAN technique would be used to interpret the data derived from the schools, Aberdeen
Public School and Bald Face Public School to run a comparison between the two regarding their
numerical abilities and knowledge on grammar and punctuation.
Research objectives:
To run a comparison between the students of Aberdeen Public School and Bald Face
Public School regarding their numerical abilities.
To run a comparison between the students of Aberdeen Public School and Bald Face
Public School regarding their understanding of grammar and punctuations.
NAPLAN tests:
The National Assessment Program – Literacy and Numeracy (NAPLAN) stands for a yearly
evaluation process of the literacy and numeracy level of the Australian students aged 3-years, 5-
years, 7-years and 9-years (Nap.edu.au, 2019). This sort of evaluation process are crucial for the
development of the child from a very tender age which would be helpful throughout their student
life and life in general as well. The tests are related to the skills in reading, writing, spelling,
numerical abilities and grammar and punctuations and are conducted annually during the month
of May (Ford, 2013). So NAPLAN has been beneficial for around 1 million Australian students
evaluating their level of knowledge rather than making them pass or fail the tests. The beauty of
this sort of evaluation lies in its familiarisation and not subjecting the students to gruesome
practice for making them pass the test (Thompson, 2014). Through this kind of test, the parents
and teachers of the students get to know their child’s level of progress and lacking.
The scores of the NAPLAN tests are used to run a comparison of the student’s performance
against national peers. It is beneficial for the teachers to understand the knowledge level of the
high performers and the ground wherein the student has been lacking (Stichter, Clarke, &
Dunlap, 2004). So the teachers and the school administration would come forth to map the
progress of the student and identify their strengths and weaknesses for the purpose of teaching
and setting goals. The NAPLAN tests has been formulated by the Australian education system in
striving for equity for all the students studying in Australia (Nap.edu.au, 2019). It strives for an
open conversation process showcasing the numerical and literary skills of the students in the
Paraphrase This Document
Need a fresh take? Get an instant paraphrase of this document with our AI Paraphraser
Using Data to Improve Learning 5
primary schools and compare such data with another school in a different territory or nationally
(Anderson, Sweeney, Williams, Camm, & Cochran, 2016). Therefore NAPLAN tests thrive to
establish the critical foundation of the learning process towards a rewarding and productive
engagement within the community circle.
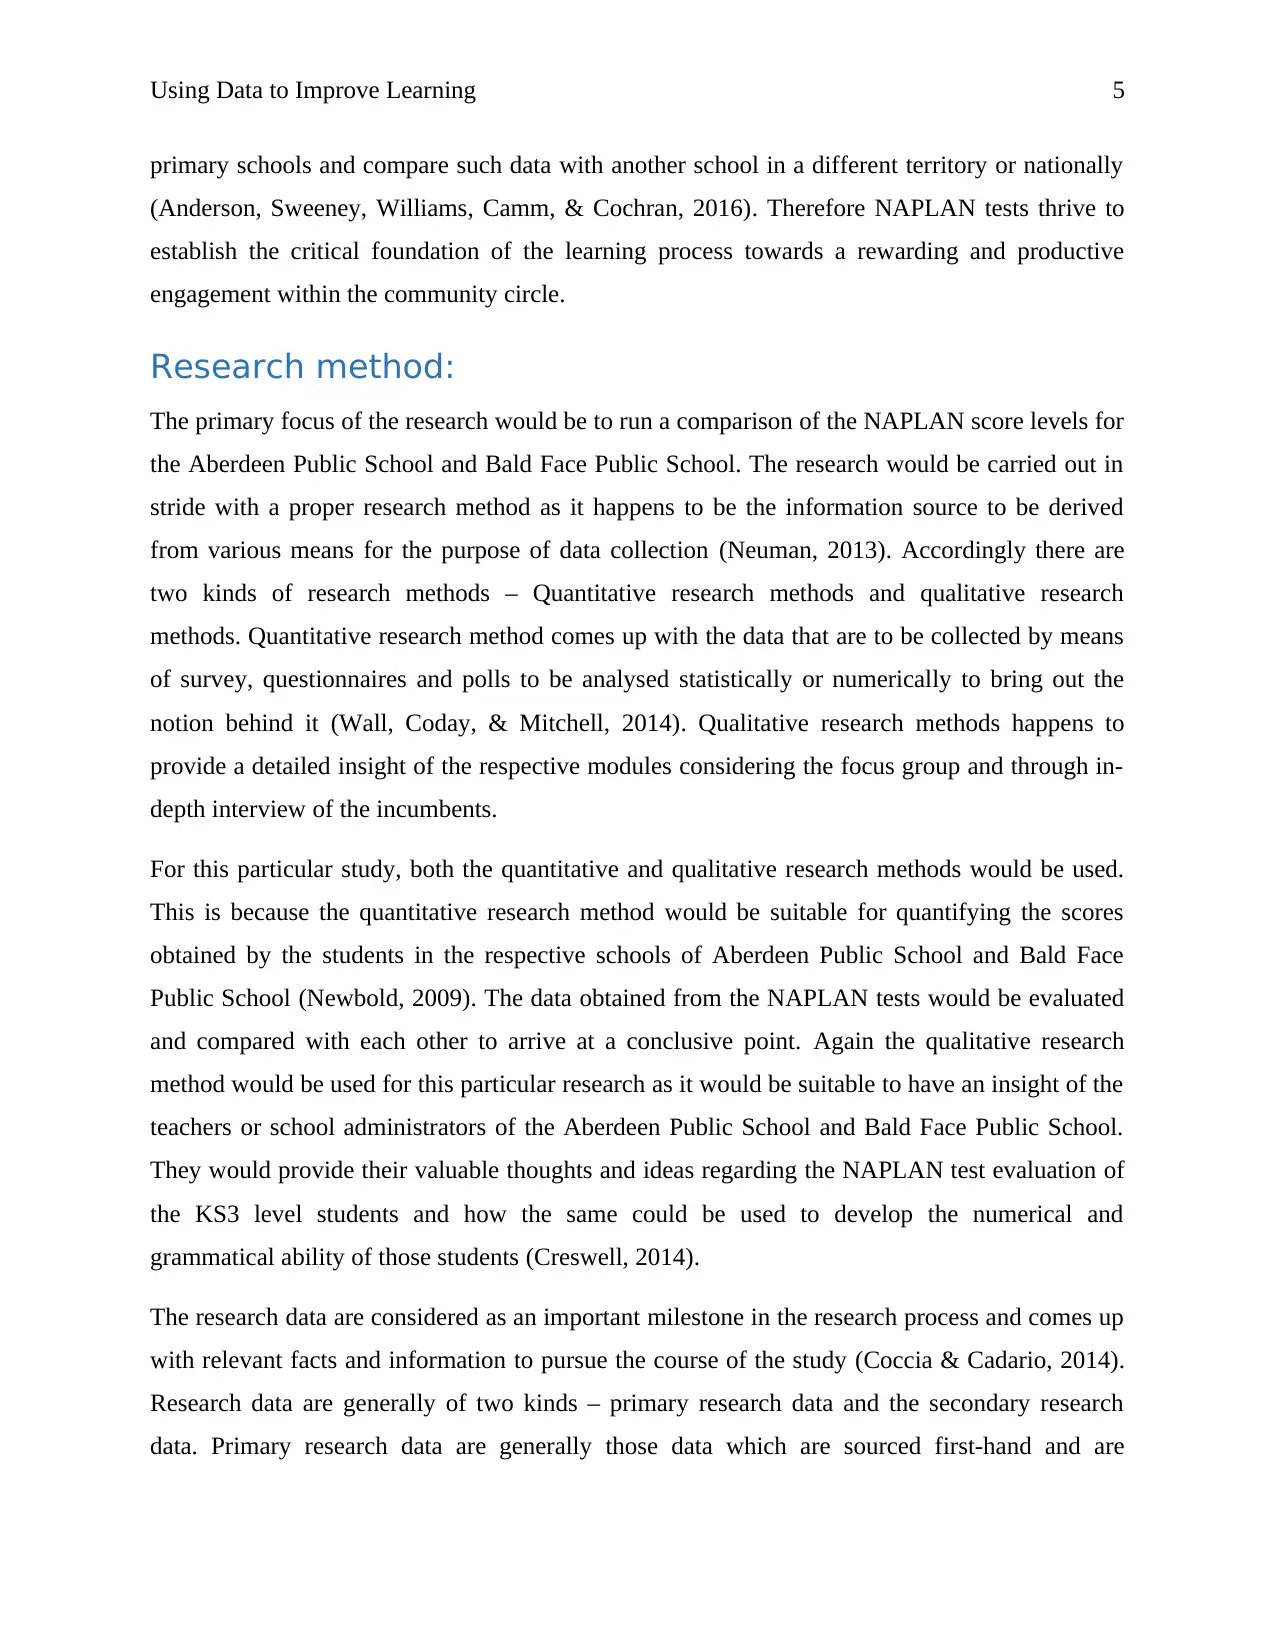
Research method:
The primary focus of the research would be to run a comparison of the NAPLAN score levels for
the Aberdeen Public School and Bald Face Public School. The research would be carried out in
stride with a proper research method as it happens to be the information source to be derived
from various means for the purpose of data collection (Neuman, 2013). Accordingly there are
two kinds of research methods – Quantitative research methods and qualitative research
methods. Quantitative research method comes up with the data that are to be collected by means
of survey, questionnaires and polls to be analysed statistically or numerically to bring out the
notion behind it (Wall, Coday, & Mitchell, 2014). Qualitative research methods happens to
provide a detailed insight of the respective modules considering the focus group and through in-
depth interview of the incumbents.
For this particular study, both the quantitative and qualitative research methods would be used.
This is because the quantitative research method would be suitable for quantifying the scores
obtained by the students in the respective schools of Aberdeen Public School and Bald Face
Public School (Newbold, 2009). The data obtained from the NAPLAN tests would be evaluated
and compared with each other to arrive at a conclusive point. Again the qualitative research
method would be used for this particular research as it would be suitable to have an insight of the
teachers or school administrators of the Aberdeen Public School and Bald Face Public School.
They would provide their valuable thoughts and ideas regarding the NAPLAN test evaluation of
the KS3 level students and how the same could be used to develop the numerical and
grammatical ability of those students (Creswell, 2014).
The research data are considered as an important milestone in the research process and comes up
with relevant facts and information to pursue the course of the study (Coccia & Cadario, 2014).
Research data are generally of two kinds – primary research data and the secondary research
data. Primary research data are generally those data which are sourced first-hand and are
primary schools and compare such data with another school in a different territory or nationally
(Anderson, Sweeney, Williams, Camm, & Cochran, 2016). Therefore NAPLAN tests thrive to
establish the critical foundation of the learning process towards a rewarding and productive
engagement within the community circle.
Research method:
The primary focus of the research would be to run a comparison of the NAPLAN score levels for
the Aberdeen Public School and Bald Face Public School. The research would be carried out in
stride with a proper research method as it happens to be the information source to be derived
from various means for the purpose of data collection (Neuman, 2013). Accordingly there are
two kinds of research methods – Quantitative research methods and qualitative research
methods. Quantitative research method comes up with the data that are to be collected by means
of survey, questionnaires and polls to be analysed statistically or numerically to bring out the
notion behind it (Wall, Coday, & Mitchell, 2014). Qualitative research methods happens to
provide a detailed insight of the respective modules considering the focus group and through in-
depth interview of the incumbents.
For this particular study, both the quantitative and qualitative research methods would be used.
This is because the quantitative research method would be suitable for quantifying the scores
obtained by the students in the respective schools of Aberdeen Public School and Bald Face
Public School (Newbold, 2009). The data obtained from the NAPLAN tests would be evaluated
and compared with each other to arrive at a conclusive point. Again the qualitative research
method would be used for this particular research as it would be suitable to have an insight of the
teachers or school administrators of the Aberdeen Public School and Bald Face Public School.
They would provide their valuable thoughts and ideas regarding the NAPLAN test evaluation of
the KS3 level students and how the same could be used to develop the numerical and
grammatical ability of those students (Creswell, 2014).
The research data are considered as an important milestone in the research process and comes up
with relevant facts and information to pursue the course of the study (Coccia & Cadario, 2014).
Research data are generally of two kinds – primary research data and the secondary research
data. Primary research data are generally those data which are sourced first-hand and are
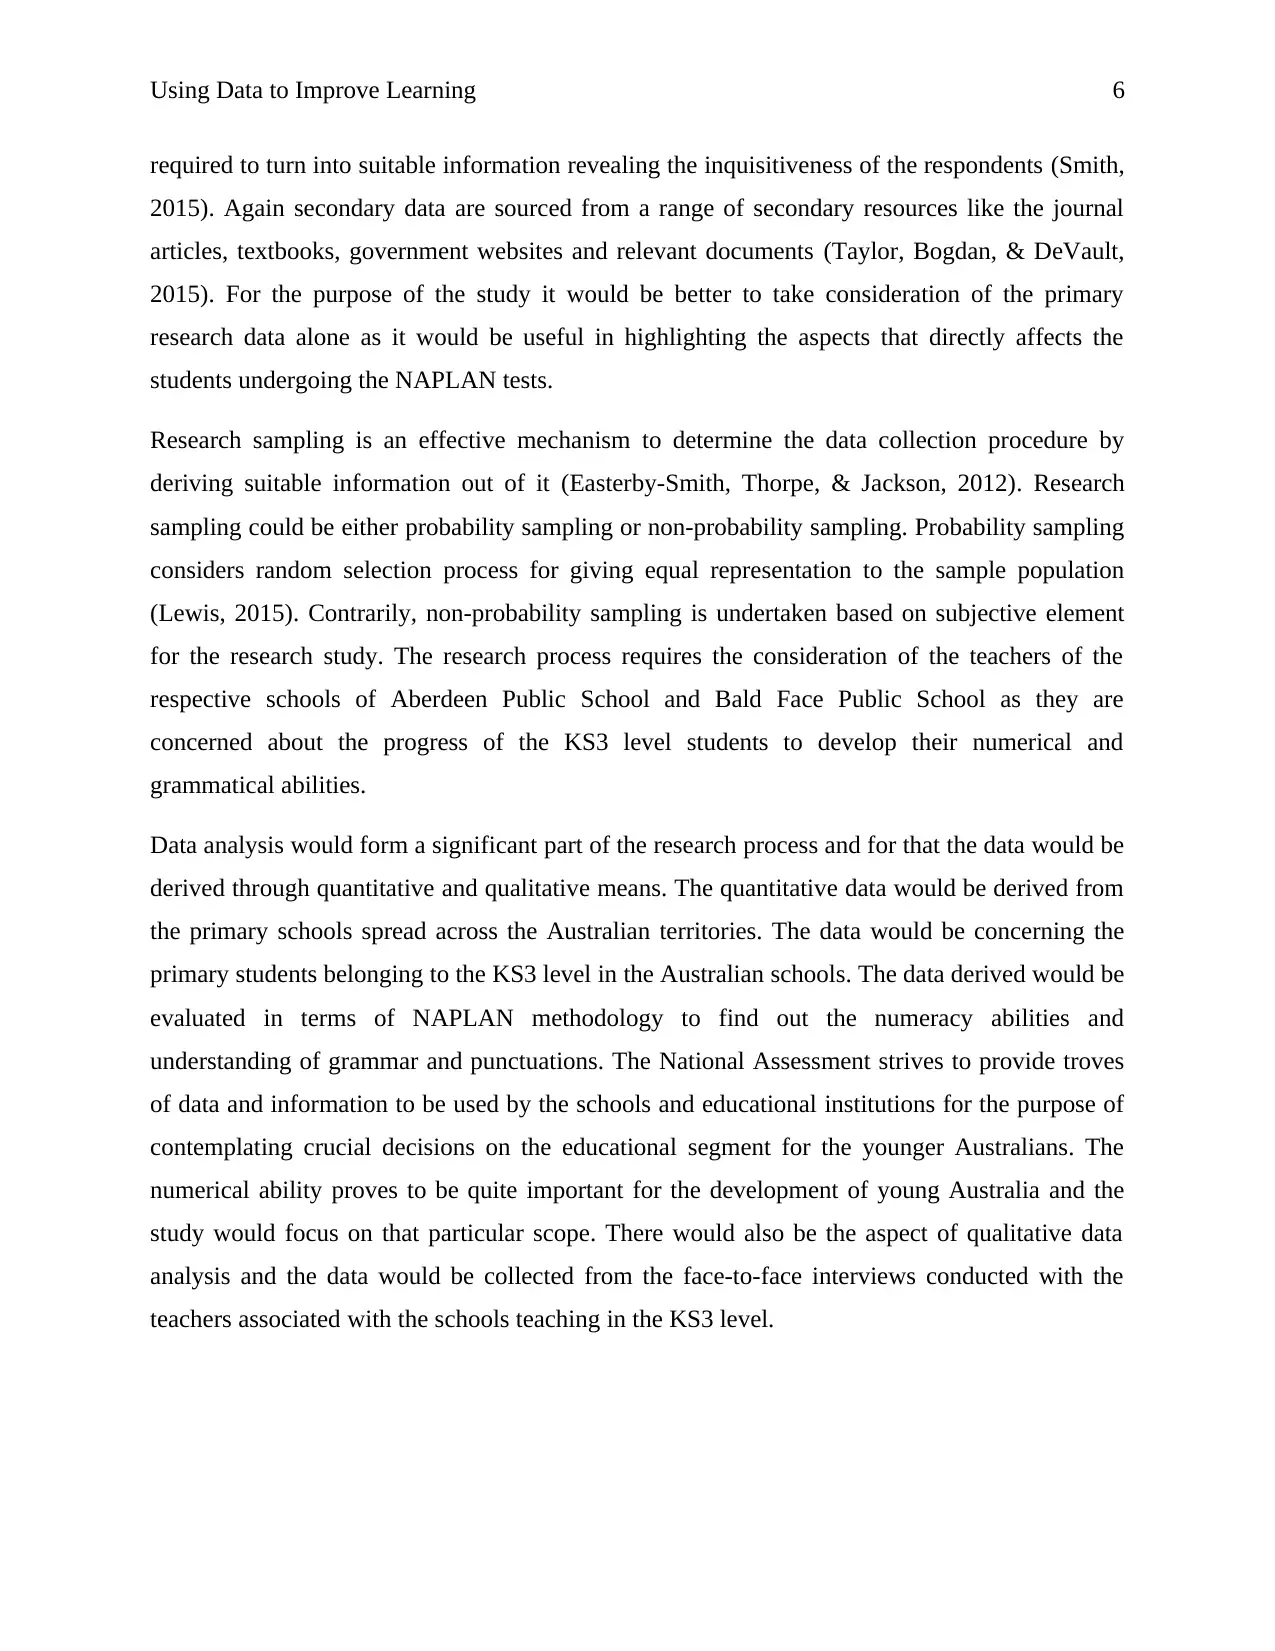
Using Data to Improve Learning 6
required to turn into suitable information revealing the inquisitiveness of the respondents (Smith,
2015). Again secondary data are sourced from a range of secondary resources like the journal
articles, textbooks, government websites and relevant documents (Taylor, Bogdan, & DeVault,
2015). For the purpose of the study it would be better to take consideration of the primary
research data alone as it would be useful in highlighting the aspects that directly affects the
students undergoing the NAPLAN tests.
Research sampling is an effective mechanism to determine the data collection procedure by
deriving suitable information out of it (Easterby-Smith, Thorpe, & Jackson, 2012). Research
sampling could be either probability sampling or non-probability sampling. Probability sampling
considers random selection process for giving equal representation to the sample population
(Lewis, 2015). Contrarily, non-probability sampling is undertaken based on subjective element
for the research study. The research process requires the consideration of the teachers of the
respective schools of Aberdeen Public School and Bald Face Public School as they are
concerned about the progress of the KS3 level students to develop their numerical and
grammatical abilities.
Data analysis would form a significant part of the research process and for that the data would be
derived through quantitative and qualitative means. The quantitative data would be derived from
the primary schools spread across the Australian territories. The data would be concerning the
primary students belonging to the KS3 level in the Australian schools. The data derived would be
evaluated in terms of NAPLAN methodology to find out the numeracy abilities and
understanding of grammar and punctuations. The National Assessment strives to provide troves
of data and information to be used by the schools and educational institutions for the purpose of
contemplating crucial decisions on the educational segment for the younger Australians. The
numerical ability proves to be quite important for the development of young Australia and the
study would focus on that particular scope. There would also be the aspect of qualitative data
analysis and the data would be collected from the face-to-face interviews conducted with the
teachers associated with the schools teaching in the KS3 level.
⊘ This is a preview!⊘
Do you want full access?
Subscribe today to unlock all pages.
Trusted by 1+ million students worldwide

Using Data to Improve Learning 7
Situational analysis:
In this section the respective educational scenario of Aberdeen Public School and Bald Face
Public School would be presented individually and compared to have a suitable conclusion out of
it. It would point out certain generalised and definite aspects that would be suitable to find out
the level of progress of the students for the respective schools.
Quantitative data analysis:
Gender distribution –
Source: (Myschool.edu.au, 2019)
The above pie chart shows the gender distribution for Aberdeen public School located at
Aberdeen of the New South Wales territory. It shows that out of the total 227 students studying
there, girls are more in number – 115 while 112 pupils are boys. The girls outnumber the boys by
being 51% of the total population though the boys are quite close at 49%.
Paraphrase This Document
Need a fresh take? Get an instant paraphrase of this document with our AI Paraphraser
Using Data to Improve Learning 8
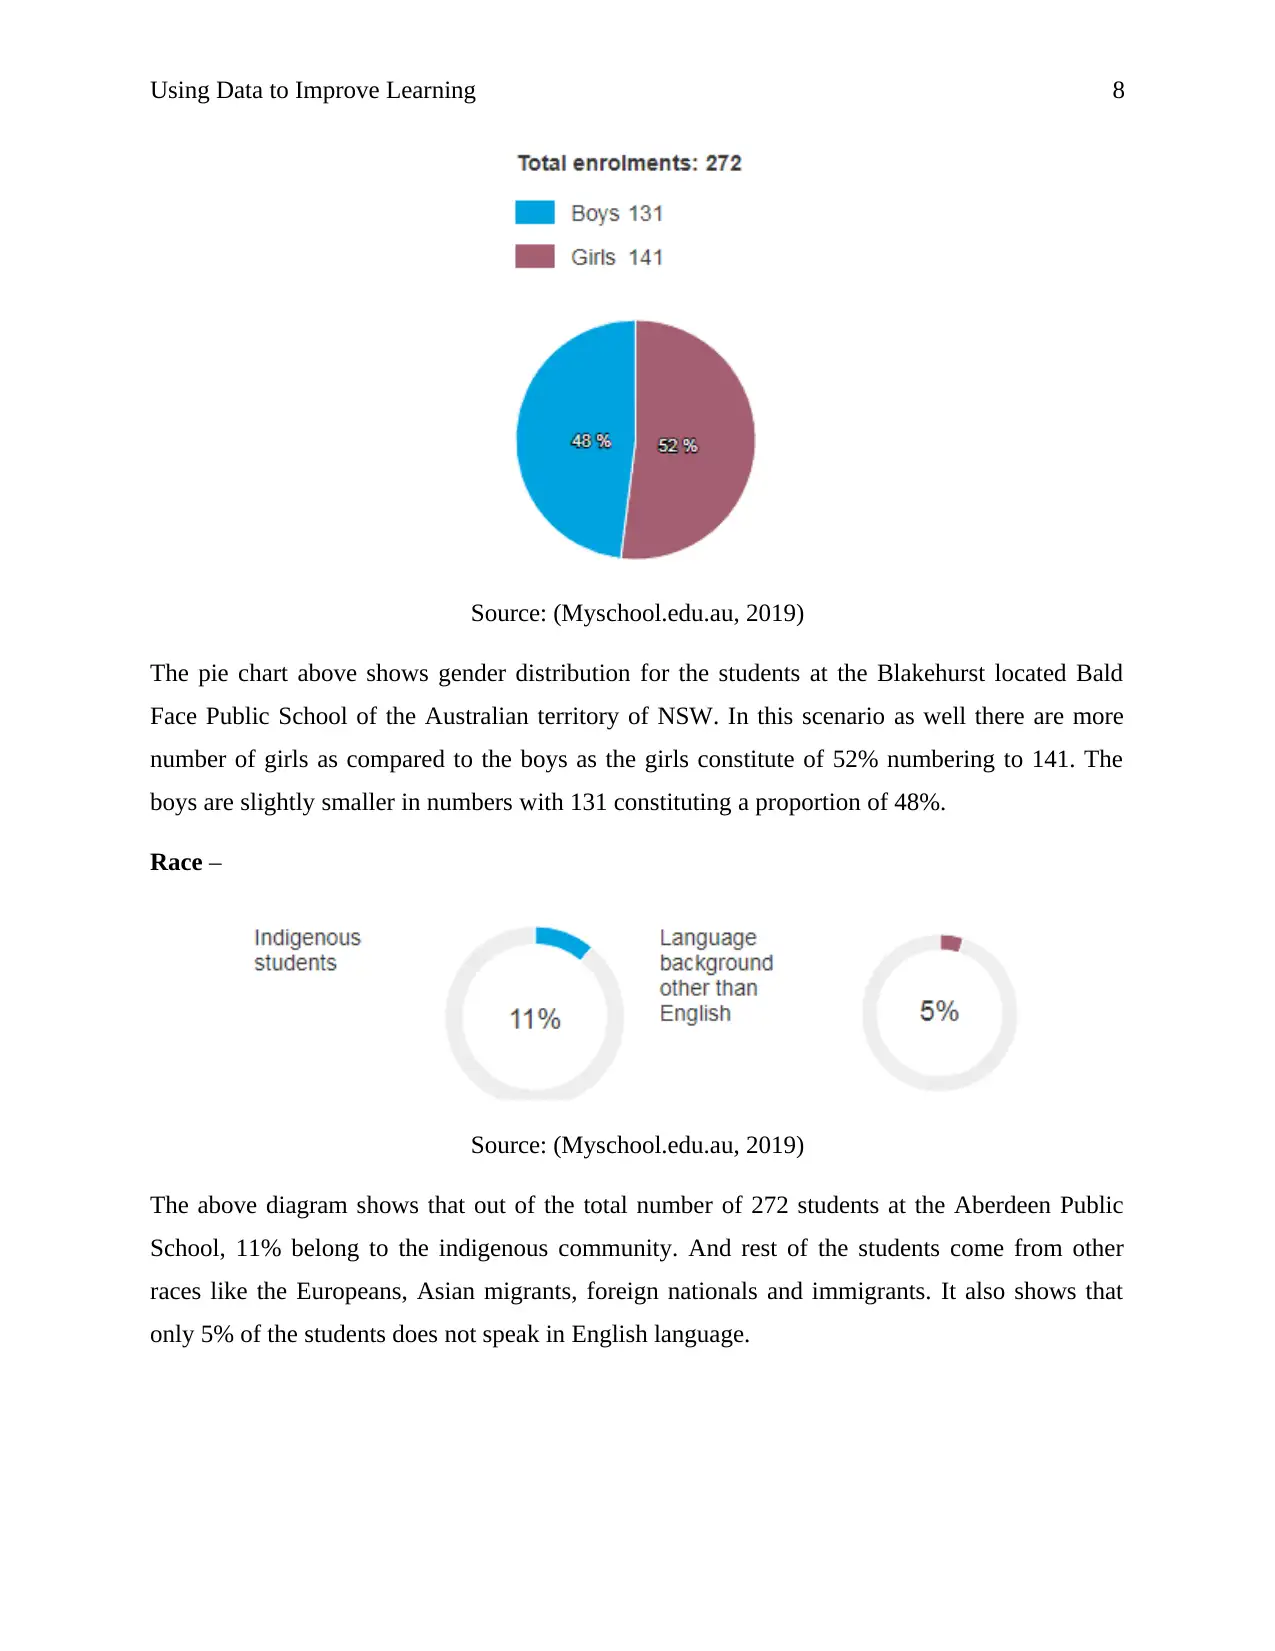
Source: (Myschool.edu.au, 2019)
The pie chart above shows gender distribution for the students at the Blakehurst located Bald
Face Public School of the Australian territory of NSW. In this scenario as well there are more
number of girls as compared to the boys as the girls constitute of 52% numbering to 141. The
boys are slightly smaller in numbers with 131 constituting a proportion of 48%.
Race –
Source: (Myschool.edu.au, 2019)
The above diagram shows that out of the total number of 272 students at the Aberdeen Public
School, 11% belong to the indigenous community. And rest of the students come from other
races like the Europeans, Asian migrants, foreign nationals and immigrants. It also shows that
only 5% of the students does not speak in English language.
Source: (Myschool.edu.au, 2019)
The pie chart above shows gender distribution for the students at the Blakehurst located Bald
Face Public School of the Australian territory of NSW. In this scenario as well there are more
number of girls as compared to the boys as the girls constitute of 52% numbering to 141. The
boys are slightly smaller in numbers with 131 constituting a proportion of 48%.
Race –
Source: (Myschool.edu.au, 2019)
The above diagram shows that out of the total number of 272 students at the Aberdeen Public
School, 11% belong to the indigenous community. And rest of the students come from other
races like the Europeans, Asian migrants, foreign nationals and immigrants. It also shows that
only 5% of the students does not speak in English language.
Using Data to Improve Learning 9
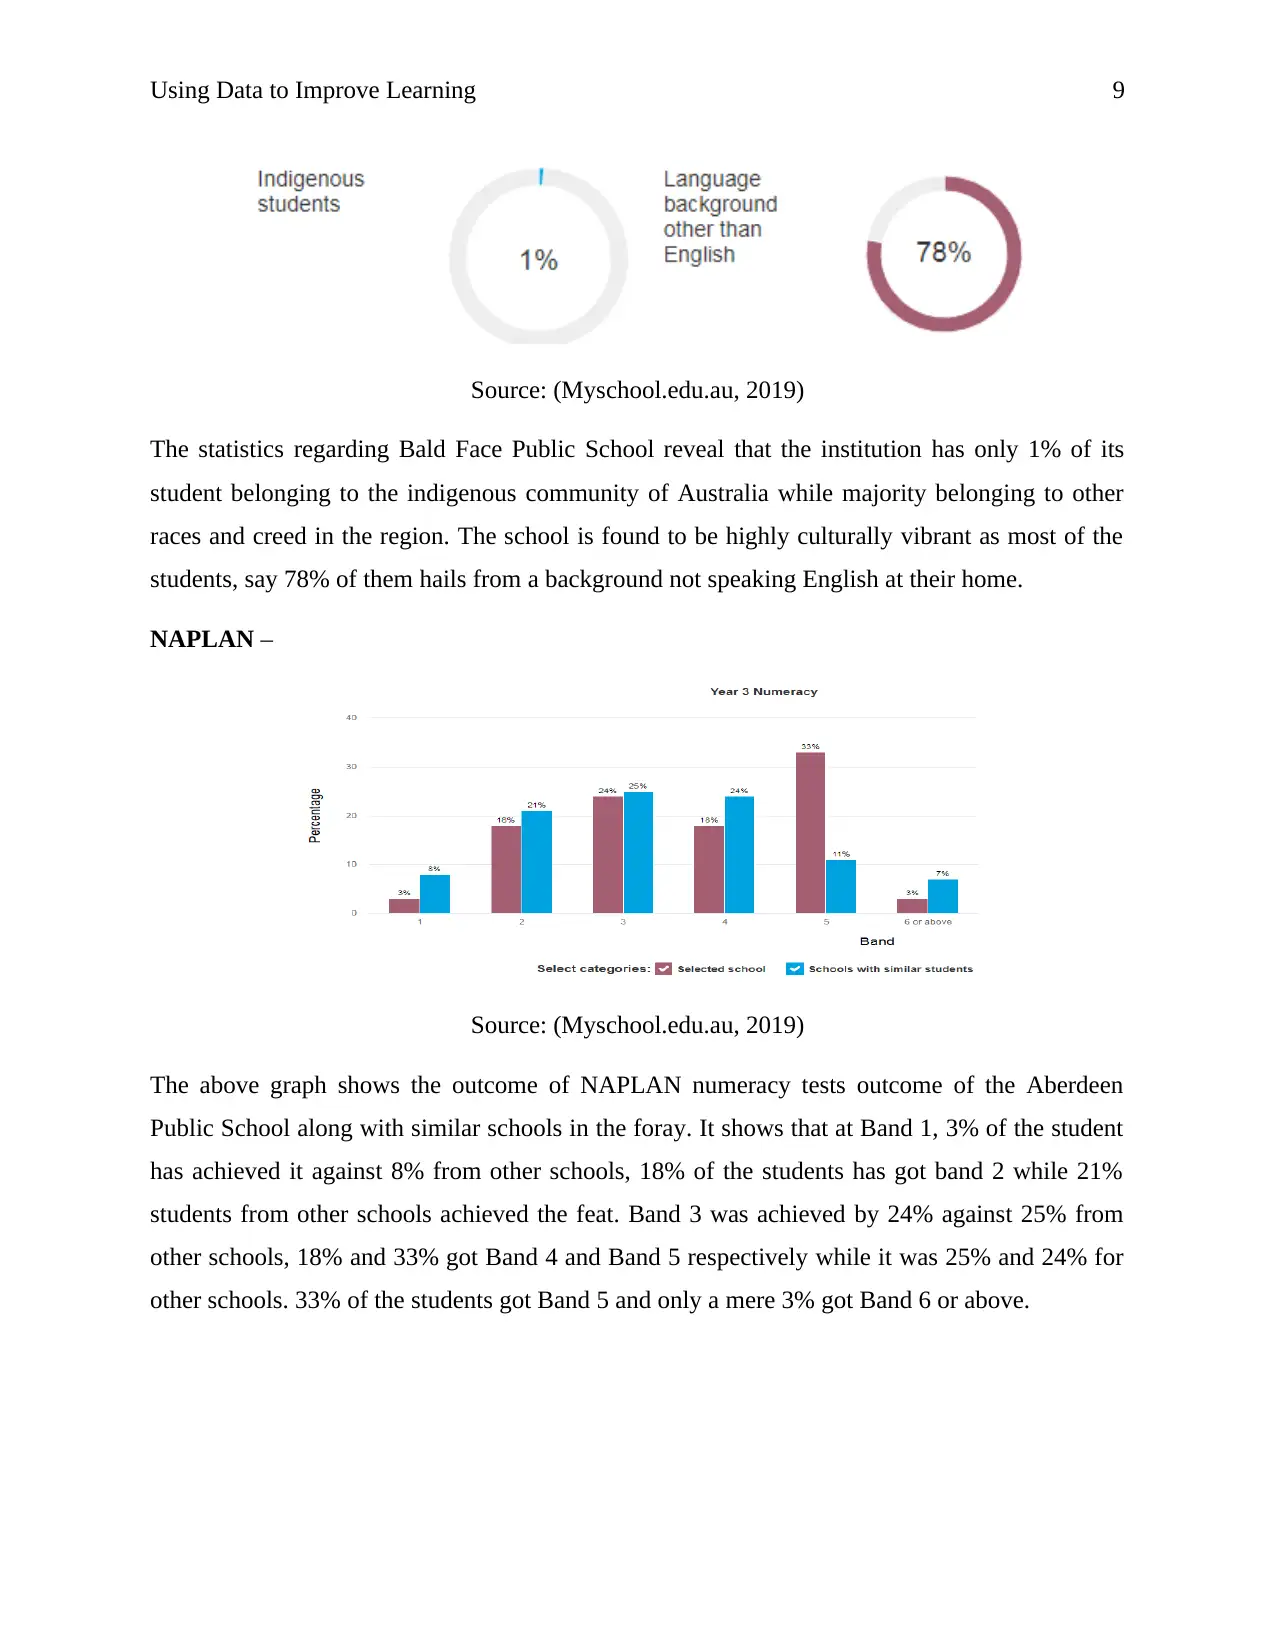
Source: (Myschool.edu.au, 2019)
The statistics regarding Bald Face Public School reveal that the institution has only 1% of its
student belonging to the indigenous community of Australia while majority belonging to other
races and creed in the region. The school is found to be highly culturally vibrant as most of the
students, say 78% of them hails from a background not speaking English at their home.
NAPLAN –
Source: (Myschool.edu.au, 2019)
The above graph shows the outcome of NAPLAN numeracy tests outcome of the Aberdeen
Public School along with similar schools in the foray. It shows that at Band 1, 3% of the student
has achieved it against 8% from other schools, 18% of the students has got band 2 while 21%
students from other schools achieved the feat. Band 3 was achieved by 24% against 25% from
other schools, 18% and 33% got Band 4 and Band 5 respectively while it was 25% and 24% for
other schools. 33% of the students got Band 5 and only a mere 3% got Band 6 or above.
Source: (Myschool.edu.au, 2019)
The statistics regarding Bald Face Public School reveal that the institution has only 1% of its
student belonging to the indigenous community of Australia while majority belonging to other
races and creed in the region. The school is found to be highly culturally vibrant as most of the
students, say 78% of them hails from a background not speaking English at their home.
NAPLAN –
Source: (Myschool.edu.au, 2019)
The above graph shows the outcome of NAPLAN numeracy tests outcome of the Aberdeen
Public School along with similar schools in the foray. It shows that at Band 1, 3% of the student
has achieved it against 8% from other schools, 18% of the students has got band 2 while 21%
students from other schools achieved the feat. Band 3 was achieved by 24% against 25% from
other schools, 18% and 33% got Band 4 and Band 5 respectively while it was 25% and 24% for
other schools. 33% of the students got Band 5 and only a mere 3% got Band 6 or above.
⊘ This is a preview!⊘
Do you want full access?
Subscribe today to unlock all pages.
Trusted by 1+ million students worldwide
Using Data to Improve Learning 10
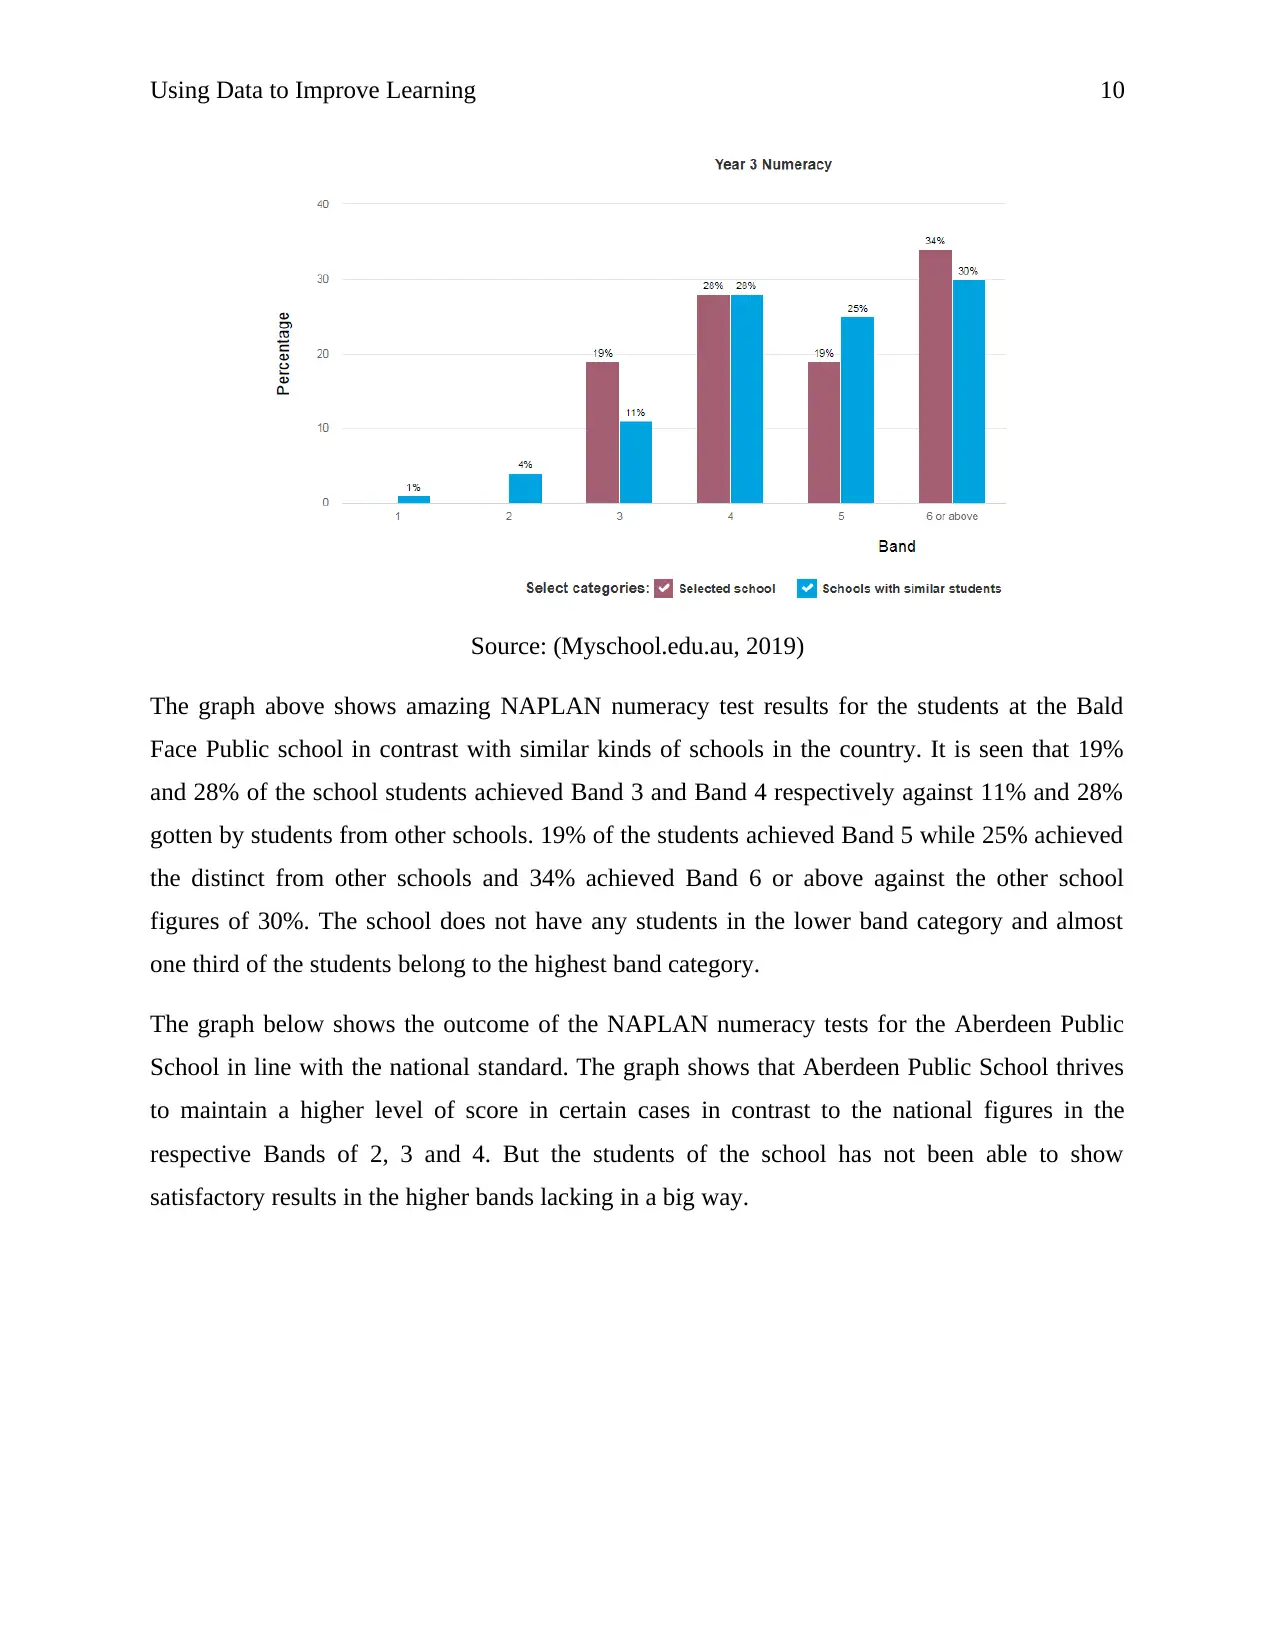
Source: (Myschool.edu.au, 2019)
The graph above shows amazing NAPLAN numeracy test results for the students at the Bald
Face Public school in contrast with similar kinds of schools in the country. It is seen that 19%
and 28% of the school students achieved Band 3 and Band 4 respectively against 11% and 28%
gotten by students from other schools. 19% of the students achieved Band 5 while 25% achieved
the distinct from other schools and 34% achieved Band 6 or above against the other school
figures of 30%. The school does not have any students in the lower band category and almost
one third of the students belong to the highest band category.
The graph below shows the outcome of the NAPLAN numeracy tests for the Aberdeen Public
School in line with the national standard. The graph shows that Aberdeen Public School thrives
to maintain a higher level of score in certain cases in contrast to the national figures in the
respective Bands of 2, 3 and 4. But the students of the school has not been able to show
satisfactory results in the higher bands lacking in a big way.
Paraphrase This Document
Need a fresh take? Get an instant paraphrase of this document with our AI Paraphraser
Using Data to Improve Learning 11
Source: (Myschool.edu.au, 2019)
Source: (Myschool.edu.au, 2019)
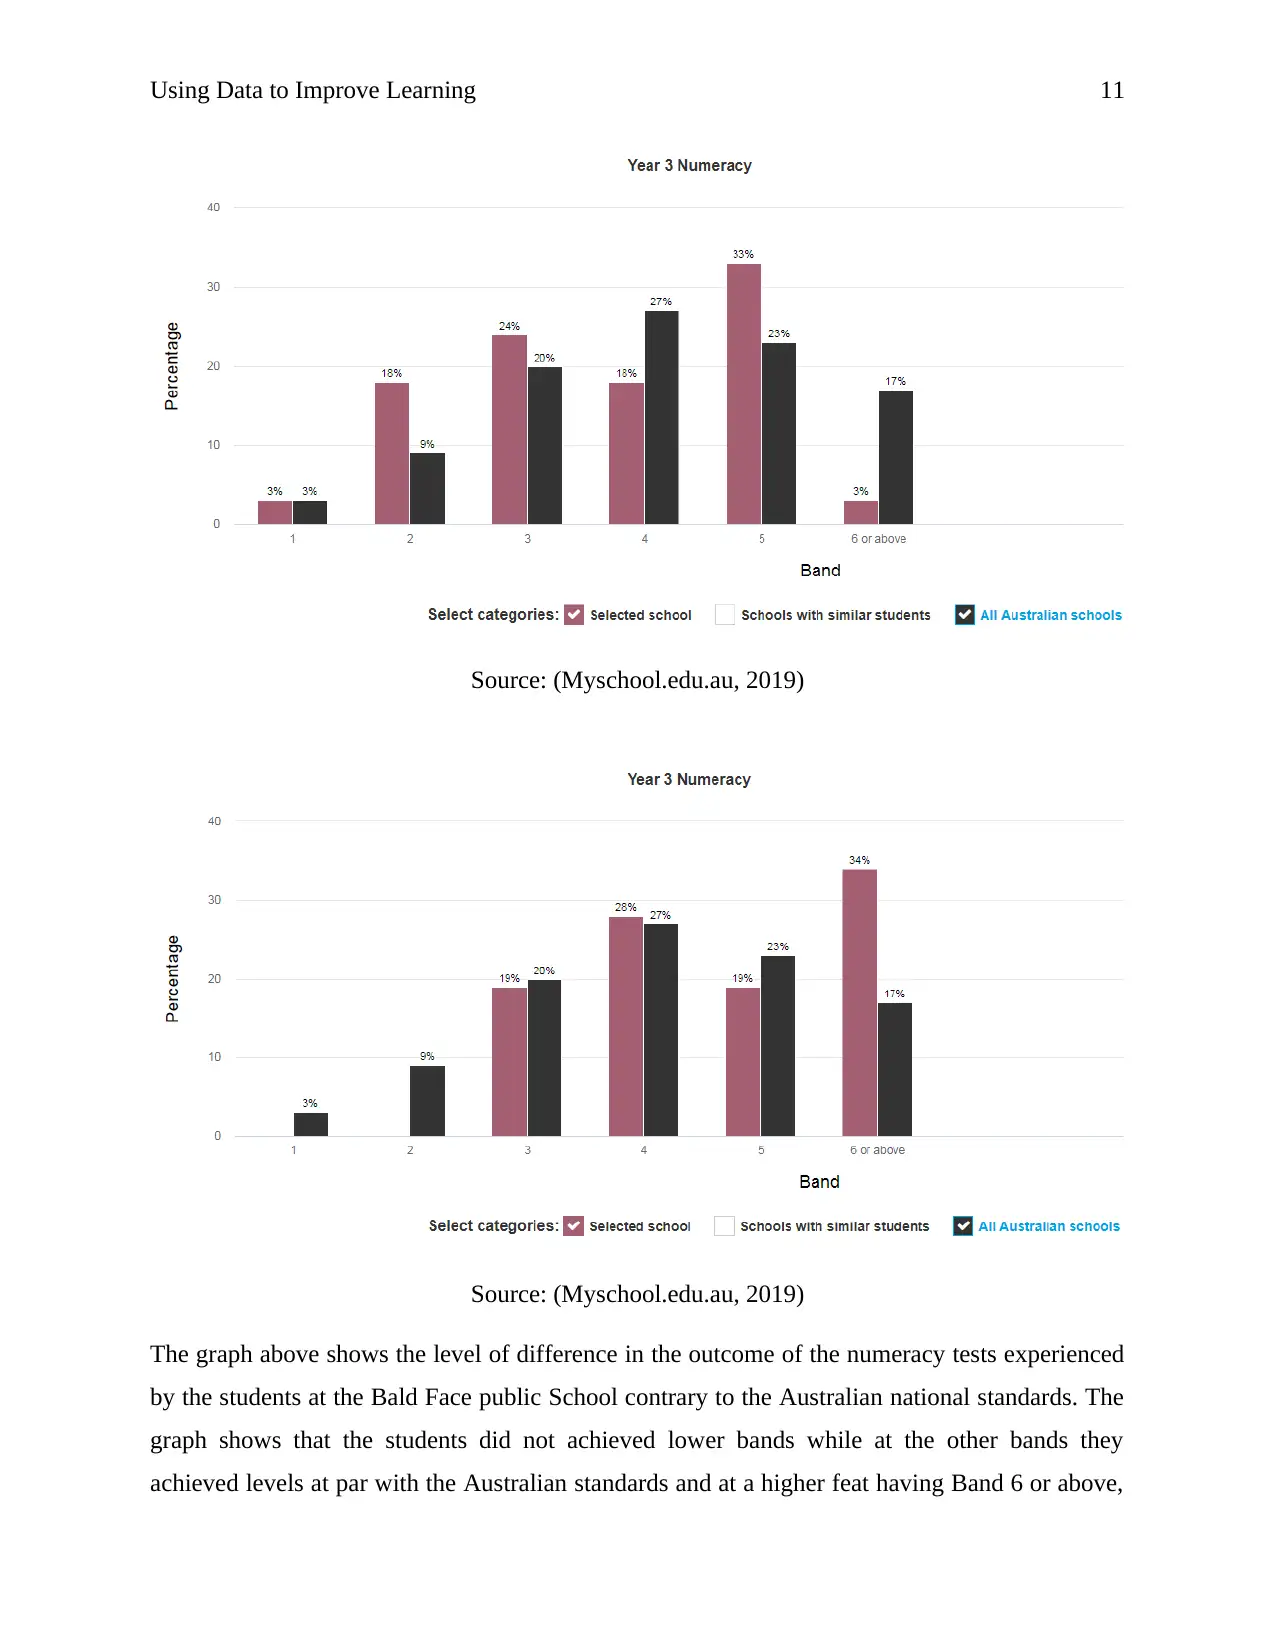
The graph above shows the level of difference in the outcome of the numeracy tests experienced
by the students at the Bald Face public School contrary to the Australian national standards. The
graph shows that the students did not achieved lower bands while at the other bands they
achieved levels at par with the Australian standards and at a higher feat having Band 6 or above,
Source: (Myschool.edu.au, 2019)
Source: (Myschool.edu.au, 2019)
The graph above shows the level of difference in the outcome of the numeracy tests experienced
by the students at the Bald Face public School contrary to the Australian national standards. The
graph shows that the students did not achieved lower bands while at the other bands they
achieved levels at par with the Australian standards and at a higher feat having Band 6 or above,
Using Data to Improve Learning 12
it has passed over the benchmark. So the likes of Bald Face Public School has a greater expertise
in numerical abilities in the Australian educational scenario.
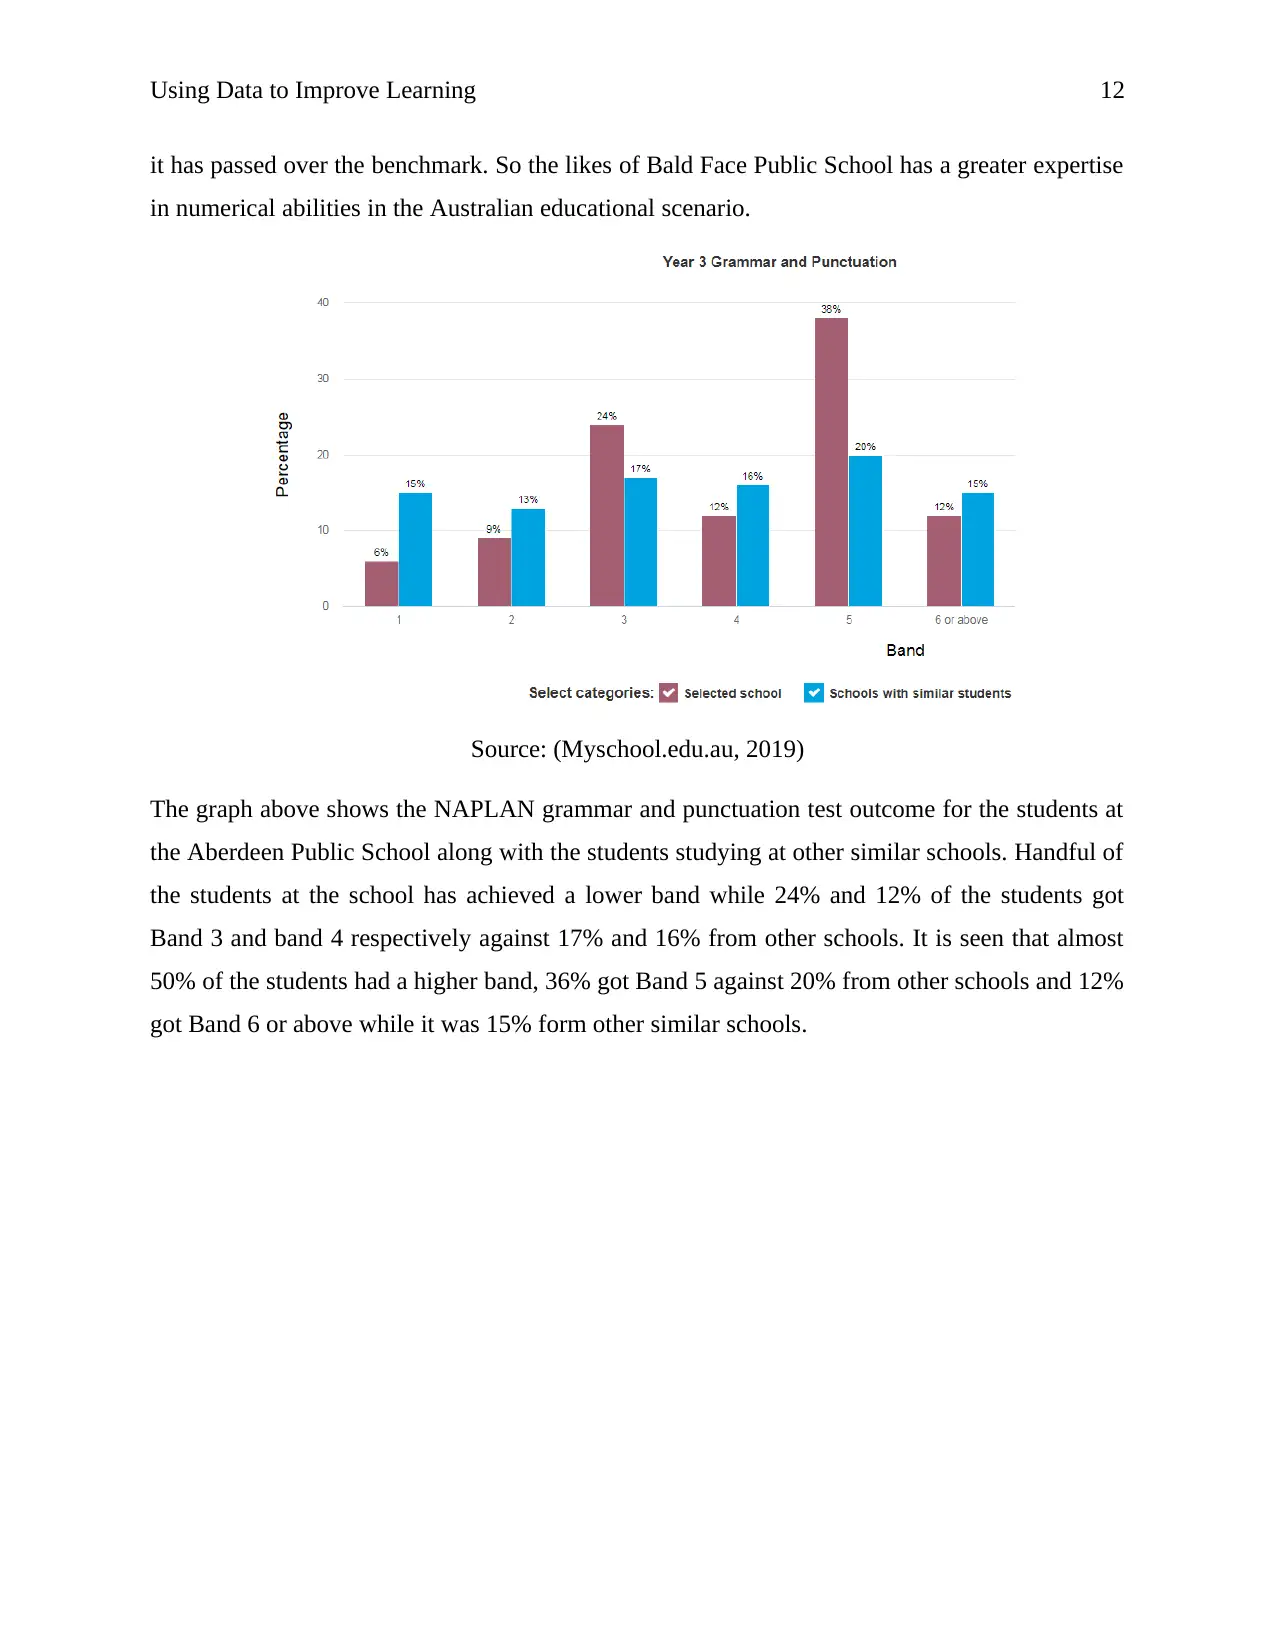
Source: (Myschool.edu.au, 2019)
The graph above shows the NAPLAN grammar and punctuation test outcome for the students at
the Aberdeen Public School along with the students studying at other similar schools. Handful of
the students at the school has achieved a lower band while 24% and 12% of the students got
Band 3 and band 4 respectively against 17% and 16% from other schools. It is seen that almost
50% of the students had a higher band, 36% got Band 5 against 20% from other schools and 12%
got Band 6 or above while it was 15% form other similar schools.
it has passed over the benchmark. So the likes of Bald Face Public School has a greater expertise
in numerical abilities in the Australian educational scenario.
Source: (Myschool.edu.au, 2019)
The graph above shows the NAPLAN grammar and punctuation test outcome for the students at
the Aberdeen Public School along with the students studying at other similar schools. Handful of
the students at the school has achieved a lower band while 24% and 12% of the students got
Band 3 and band 4 respectively against 17% and 16% from other schools. It is seen that almost
50% of the students had a higher band, 36% got Band 5 against 20% from other schools and 12%
got Band 6 or above while it was 15% form other similar schools.
⊘ This is a preview!⊘
Do you want full access?
Subscribe today to unlock all pages.
Trusted by 1+ million students worldwide
1 out of 18
Related Documents


Your All-in-One AI-Powered Toolkit for Academic Success.
+13062052269
info@desklib.com
Available 24*7 on WhatsApp / Email
![[object Object]](/_next/static/media/star-bottom.7253800d.svg)
Unlock your academic potential
Copyright © 2020–2026 A2Z Services. All Rights Reserved. Developed and managed by ZUCOL.