Data and Information Management: Practical Applications and Solutions
VerifiedAdded on 2023/06/18
|13
|1185
|110
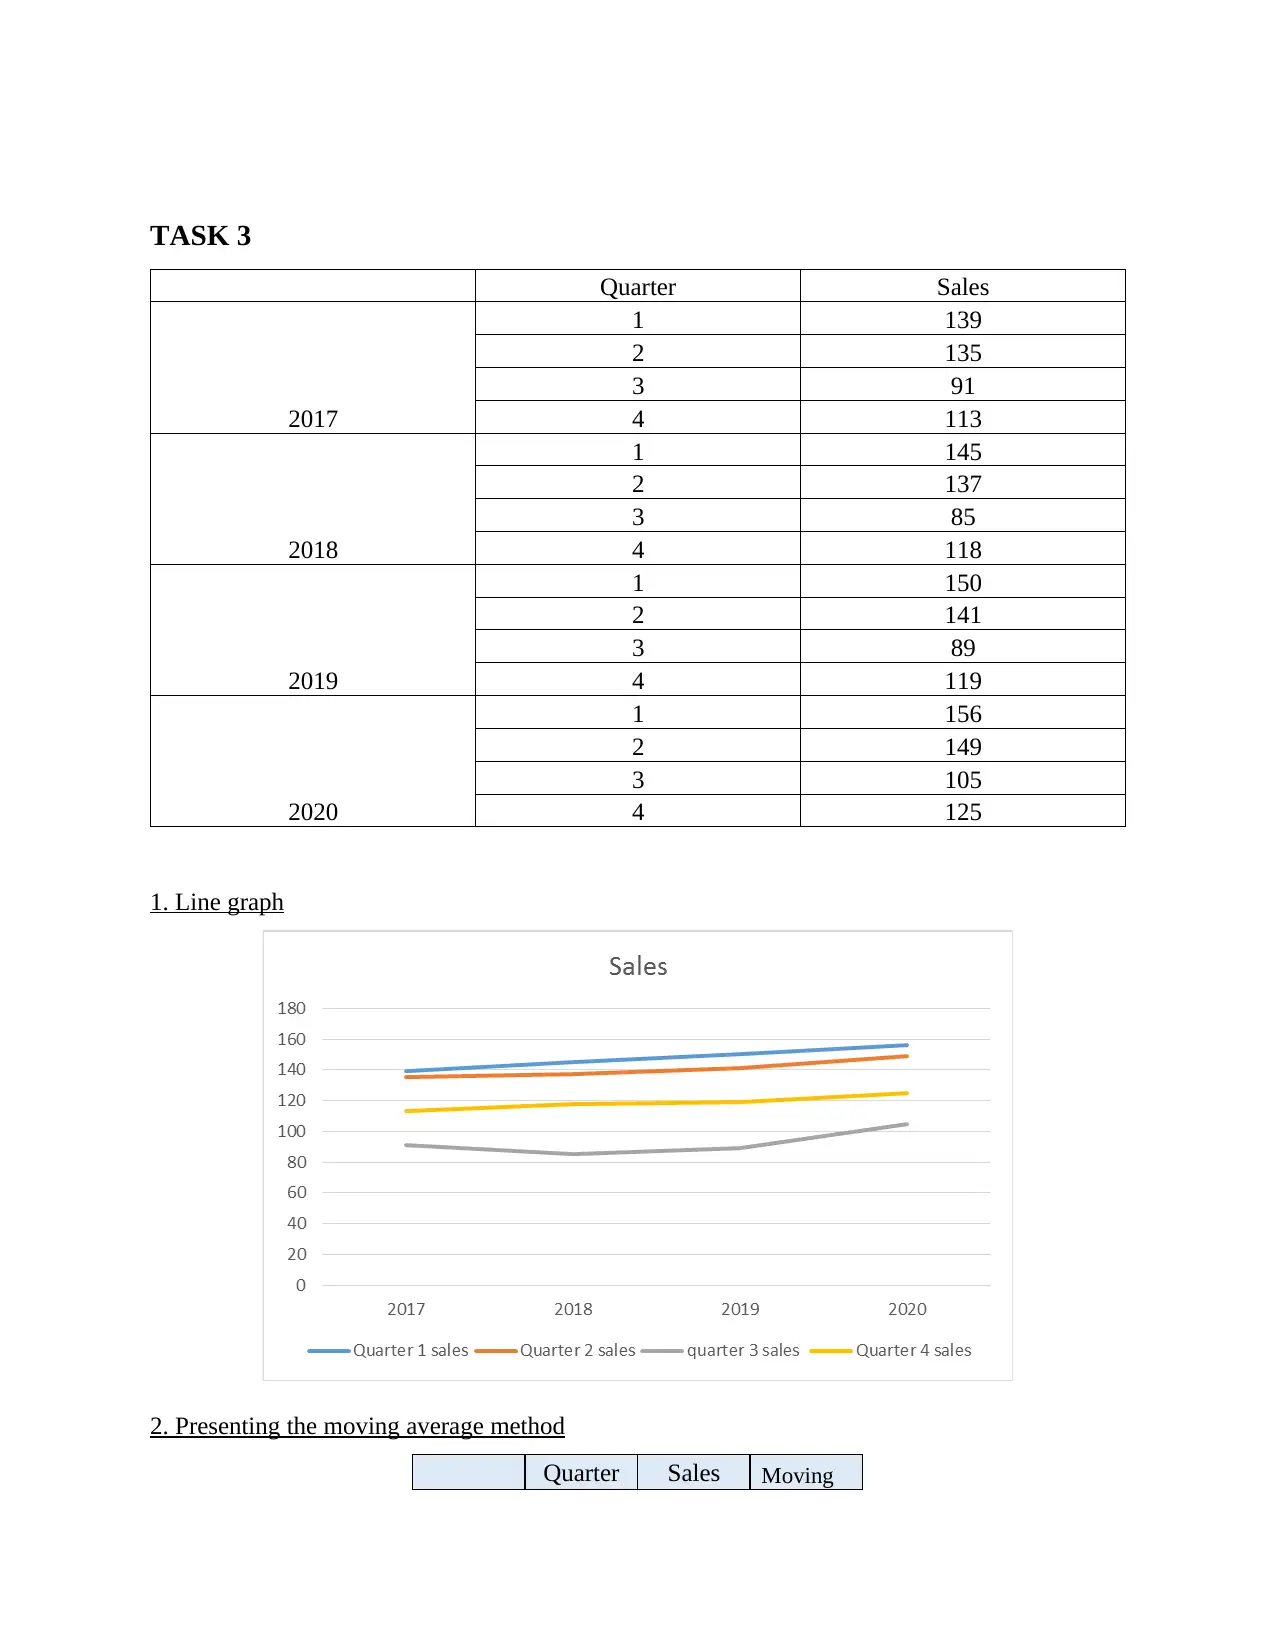
Practical Assignment
AI Summary
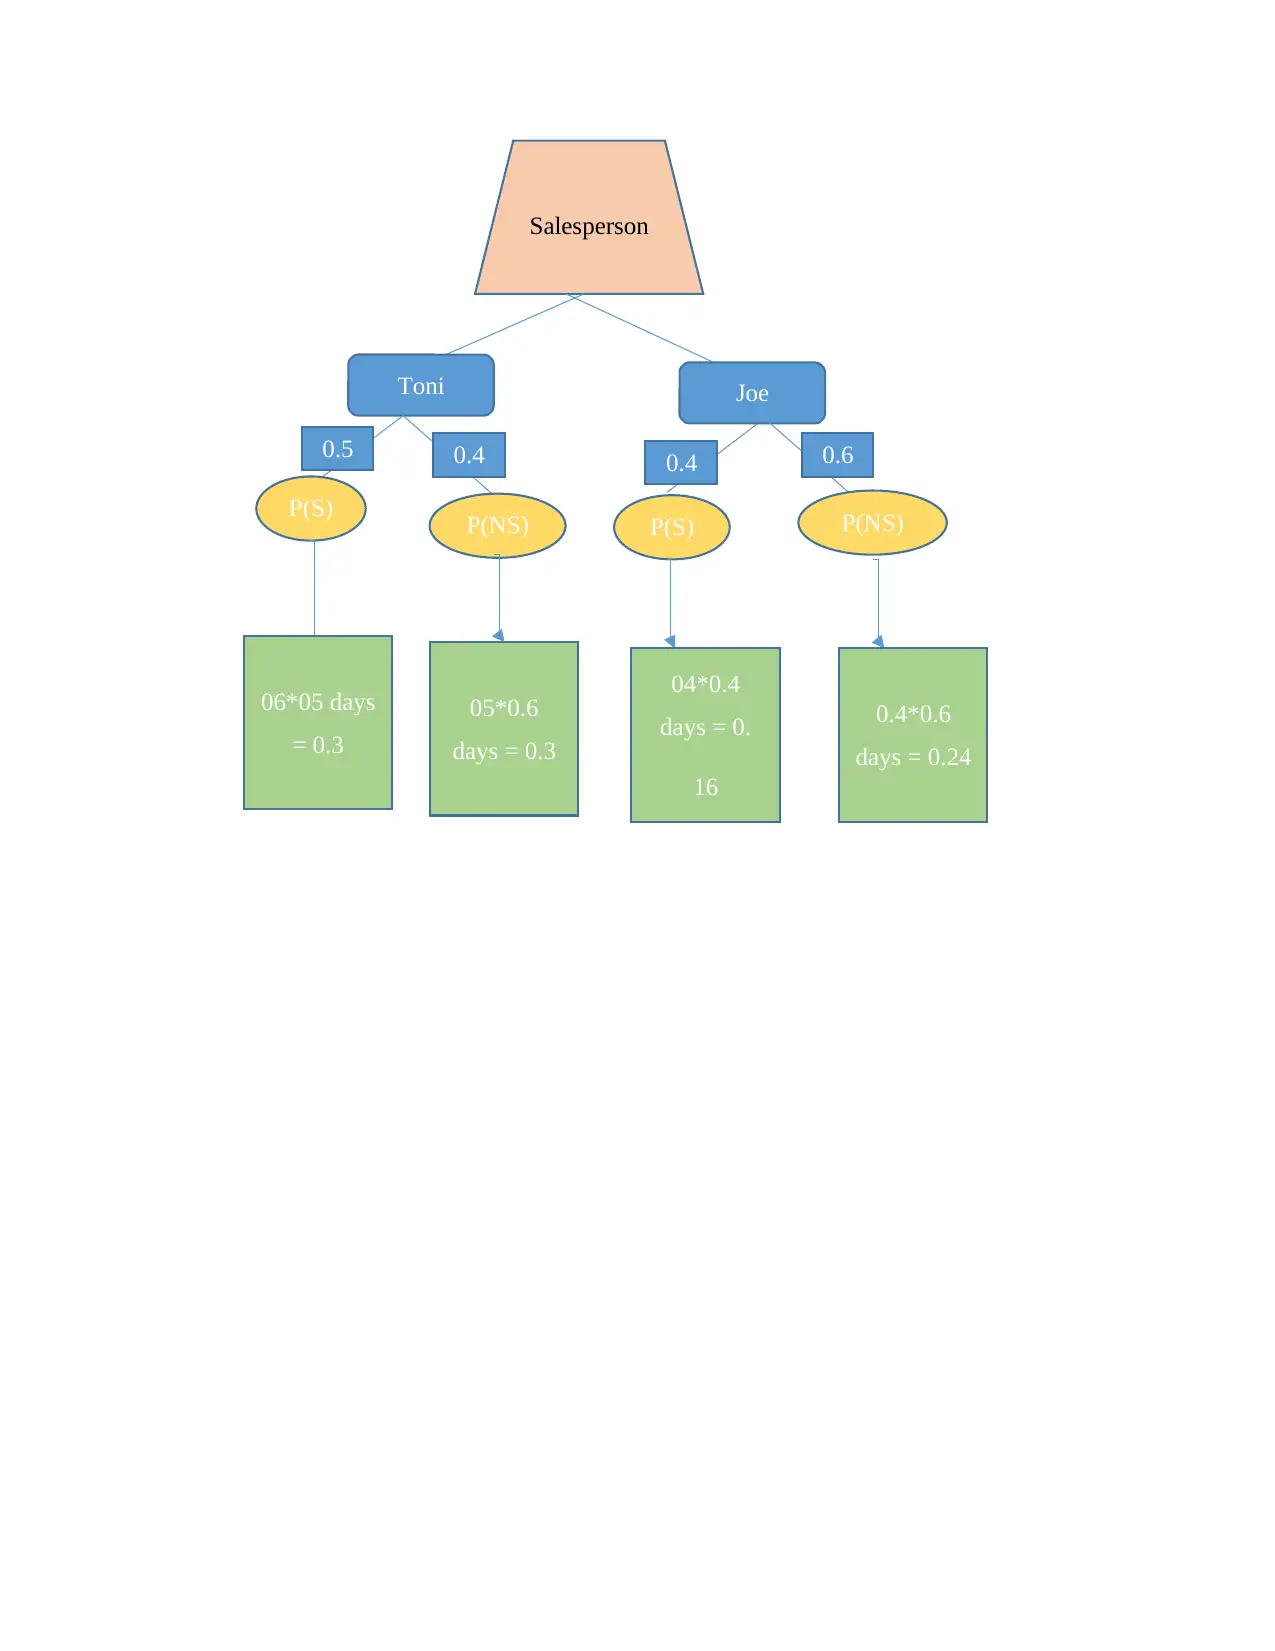
This assignment focuses on practical data analysis and management techniques. It includes labeling codes for categories and creating frequency tables using pivot tables, along with graphical representations of variables and descriptive statistics. The assignment also covers network diagrams, critical path analysis using Gantt charts, and presents critical and non-critical paths. Furthermore, it explores the moving average method, including the centered moving average, and presents data related to original sales and sales trends. A tree diagram is used to illustrate probabilities related to selecting a salesperson, and linear programming is applied to solve optimization problems. Desklib offers a wide range of similar solved assignments and past papers to aid students in their studies.


1 out of 13
Related Documents


Your All-in-One AI-Powered Toolkit for Academic Success.
+13062052269
info@desklib.com
Available 24*7 on WhatsApp / Email
![[object Object]](/_next/static/media/star-bottom.7253800d.svg)
Copyright © 2020–2026 A2Z Services. All Rights Reserved. Developed and managed by ZUCOL.