Investment Product Valuation for Smiths Group Plc: A Detailed Analysis
VerifiedAdded on 2023/01/13
|13
|3251
|44
Report
AI Summary
This report presents a detailed valuation analysis of investment products for Smiths Group Plc. It begins with an overview of the company, including its strengths, weaknesses, opportunities, and threats, analyzed using a SWOT framework. The report then delves into share valuation, employing the Dividend Discount Model, Earnings and Investments Model, P/E Multiple, and Free Cash Flow Model to determine the intrinsic value of the company's shares. A critical discussion compares the results obtained from these various models. The report also assesses bond valuation, calculating the market value of a bond and examining its investment suitability under different interest rate scenarios. Furthermore, the report includes the valuation of options using the Black-Scholes Model, determining the price of call and put options and evaluating the validity of calculations through Put-Call Parity. The analysis concludes with a summary of the total net profit or loss. The report provides a comprehensive understanding of investment analysis techniques and their application in evaluating the financial performance of Smiths Group Plc.

Valuation of Investment
Products
1
Products
1
Paraphrase This Document
Need a fresh take? Get an instant paraphrase of this document with our AI Paraphraser
Contents
INTRODUCTION...........................................................................................................................3
PART A: Company Overview.........................................................................................................4
PART B: Share Valuation...............................................................................................................5
1. Dividend Discount Model........................................................................................................5
2. Earnings and Investments Model.............................................................................................6
3. P/E Multiple.............................................................................................................................7
4. Free Cash Flow Model.............................................................................................................7
5. Critical discussion of the results..............................................................................................8
PART C: Bond Valuation................................................................................................................8
1. Market value of the bond as of 4 February 2020.....................................................................8
2. Investment suitability...............................................................................................................9
3. Calculation of modified duration...........................................................................................10
4. Concept of modified duration................................................................................................10
PART D: Valuation of Options.....................................................................................................11
1. Price of a 3-month European call option...............................................................................11
2. Price of a put option with similar characteristics as the call option......................................11
3. Validity of calculations using Put call parity.........................................................................11
4. Total net profit or loss............................................................................................................12
CONCLUSION..............................................................................................................................12
REFERENCES..............................................................................................................................13
2
INTRODUCTION
Investment products the stocks which are offered to investors by listed organisations. These
products are required to be effectively valued so that an informed investment decision can be
taken (Bauer and Smeets, 2015). The main aim of this report is to build an understanding about
the concept of investment analysis and enhance the skills of using various investment techniques
such as share and bond valuation. For this purpose, a large scale listed company is selected
which is Smiths Group Plc. This is an engineering company having headquarters in London,
United Kingdom. This organisation was founded in 1851 by Samuel Smith. The operations of
this company includes few principle divisions which are medical systems, defence and
Aerospace.
This report is divided in four parts; the first part will focus upon overview of the selected
company including its strengths, weaknesses, opportunities and challenges. The second part of
this report is related to share valuation in which selected company’s intrinsic value of share will
be computed using various techniques. In the third section of the report, value of the bond of
3
⊘ This is a preview!⊘
Do you want full access?
Subscribe today to unlock all pages.
Trusted by 1+ million students worldwide
selected company will be estimated using varied interest rate scenarios. In the last section,
options of the company will be valued using Black-Scholes Model.
PART A: Company Overview
Smith Group Plc. is a public limited company listed at London Stock Exchange and is a part
of FTSE 100 component. This company deals in engineering industry and has competitive image
in market. Being a 169 years old organisation, the brand image of this organisation is quite
influential. Like every other company, this company also faces challenges due to dynamic
market environment. In order to analyse the internal and external environment of this company a
framework named SWOT is used below by which strengths, weaknesses, opportunities and
threats (challenges) of this company are analysed:
Strengths
Strengths are the internal resources and competencies of an organisation which must be
enhanced through effective operations (Bernstrom, 2014). Smith Group Plc has a strong
distribution network which easily reaches their potential market is an essential strength of this
company. Other strengths of this company includes high level of customer satisfaction, strong
brand portfolio and high returns on Capital Expenditure. For the purpose of investment analysis,
it must be noted that this company is effective when it comes to gaining high returns of their
expenditures which can be beneficial for potential investors.
Weaknesses
This company has comparatively low research and development skills which is a major
weakness of this company that must be resolved by investing in R&D department. Another
weakness of this company is the non-effective financial planning due to which liquidity of this
company gets impacted. This weakness must be considered by its potential investors as they can
face the issue of low liquidity if they invest in this company’s stocks.
Opportunities
There are various opportunities which can be grabbed by Smiths Group Plc. The industry in
which this company deals is a growing industry which can provide the future opportunity of
capturing new customers. This company can also enhance their online platform from which they
can reach larger market segments, this opportunity will need investment in big data analytics.
Decreasing transportation cost is also an opportunity for this company which can be grabbed by
operating in markets which has lower shipping prices (Enever, Isaac and Daley, 2014).
4
Paraphrase This Document
Need a fresh take? Get an instant paraphrase of this document with our AI Paraphraser
Threats (Challenges)
Threats and challenges are the situations which company has to face while operating in a
marketplace. These challenges can affect the productivity and profitability of an organisation.
Smith Group Plc. is operating in various markets and facing various challenges. The most
influencing challenge for this company is high prices of raw material due to which margin
market of this company will be negatively impacted. Other threats or challenges of this company
which they may face in future are shortage of skilled employees, intense competition and threats
of new entrants in the industry.
Smith Group Plc.’s position in industry
Smith Group Plc. is considered as one of the best organisation working in engineering
industry and is a largest provider of security and defence industry. This company holds a strong
and competitive position in market. This company faces the threat of new entrant in this industry
as continuously innovating new products requires high capital due to which Smith Group Plc.
lacks in providing new value proposition to their customers.
The engineering industry is a vast marketplace and includes various sectors. The most
important element in such sectors is the raw material which are procured from the suppliers. Due
to the dominant position of suppliers in this industry, Smith Group faces the high bargaining
power issue from which their margins can also be impacted. But on the other hand, when it
comes to the customers, Smith Group Plc. enjoys competitive position in market due to which
they can limit the bargain power of their clients.
The products developed by this company are highly innovative but they are imitable and not
rare due to which these products can easily be substituted (Kahn and Lemmon, 2016). This factor
implies the submissive position of this company in industry. Smith Group Plc. is operating in an
industry where competition is common but then also this group has proven to be the best due to
their low margins are competency to create innovative position.
PART B: Share Valuation
1. Dividend Discount Model
This model is a quantitative method of calculating and forecasting the intrinsic value of a
share of a company. The intrinsic value is the price of a share which is completely non effected
by the external environment. This value is based on only the internal affairs, capabilities and
5
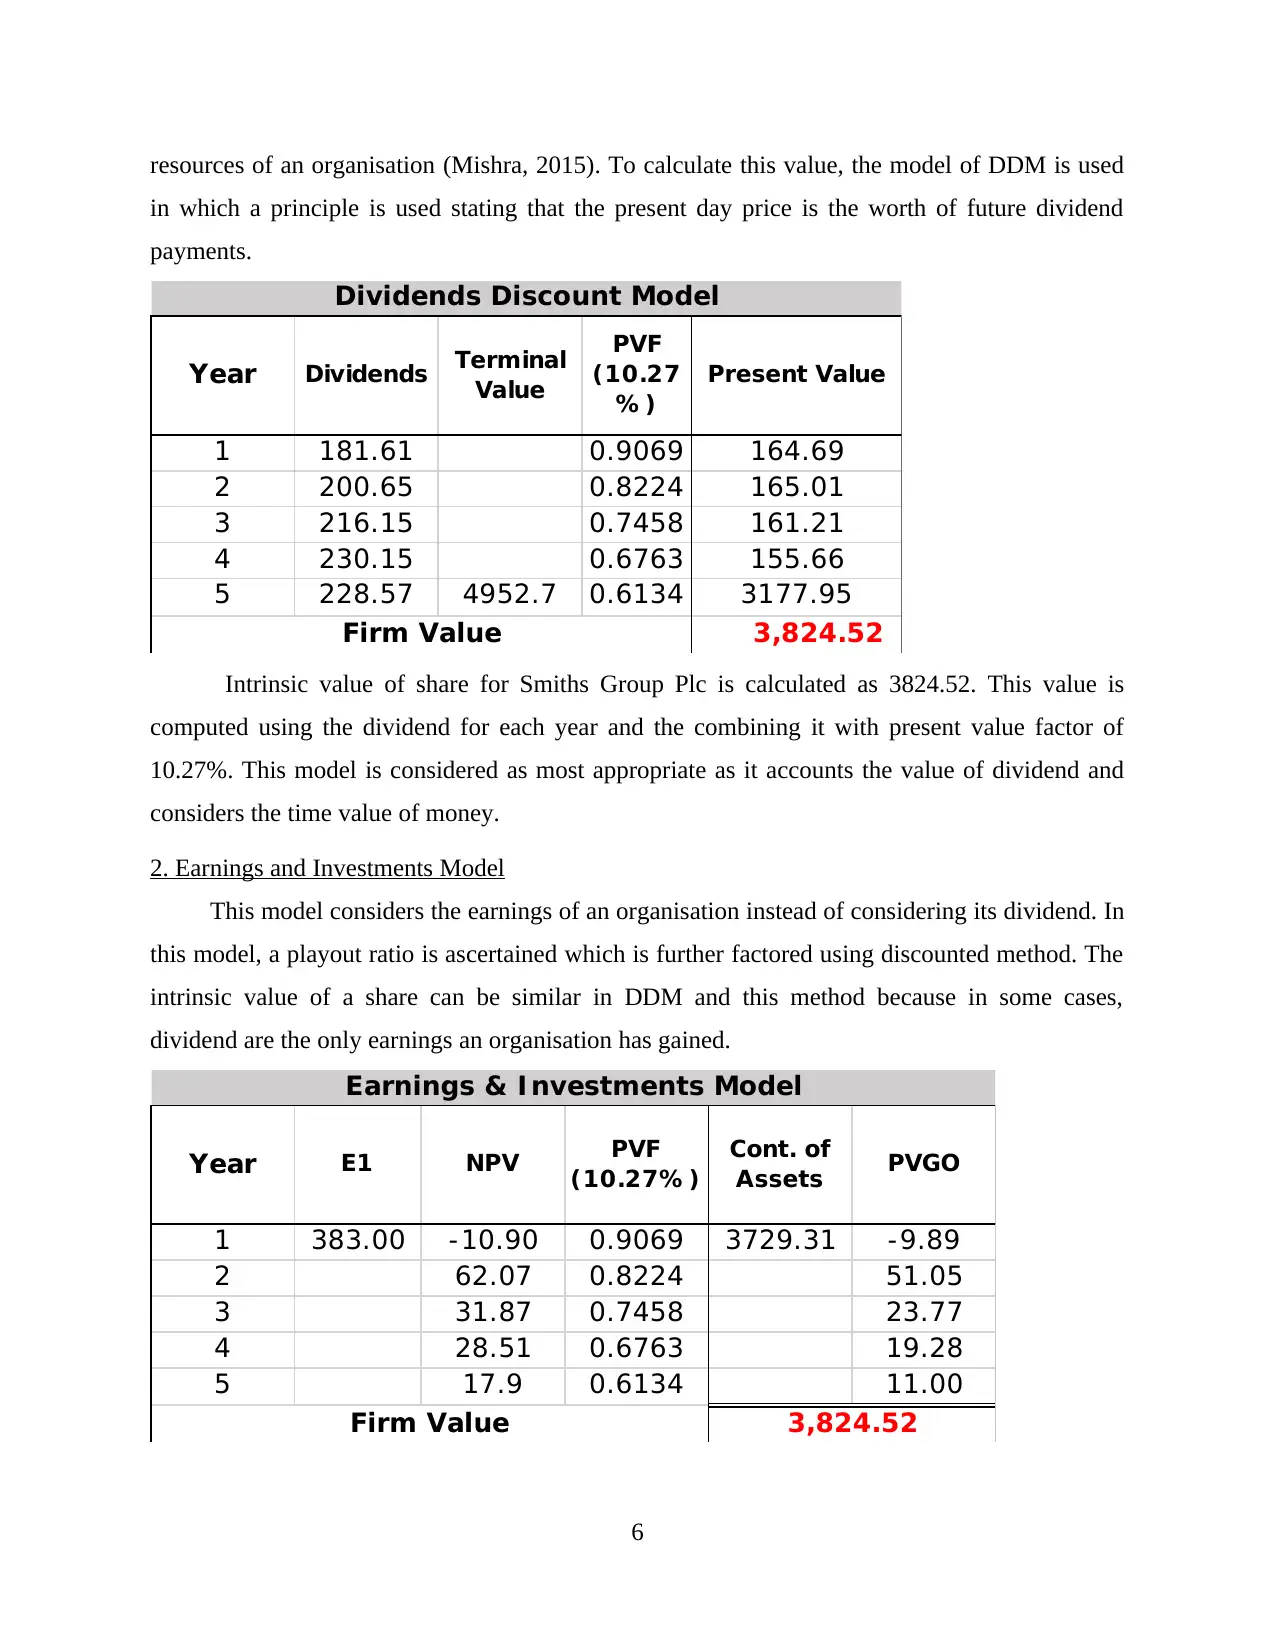
resources of an organisation (Mishra, 2015). To calculate this value, the model of DDM is used
in which a principle is used stating that the present day price is the worth of future dividend
payments.
Year Dividends Terminal
Value
PVF
(10.27
% )
Present Value
1 181.61 0.9069 164.69
2 200.65 0.8224 165.01
3 216.15 0.7458 161.21
4 230.15 0.6763 155.66
5 228.57 4952.7 0.6134 3177.95
3,824.52Firm Value
Dividends Discount Model
Intrinsic value of share for Smiths Group Plc is calculated as 3824.52. This value is
computed using the dividend for each year and the combining it with present value factor of
10.27%. This model is considered as most appropriate as it accounts the value of dividend and
considers the time value of money.
2. Earnings and Investments Model
This model considers the earnings of an organisation instead of considering its dividend. In
this model, a playout ratio is ascertained which is further factored using discounted method. The
intrinsic value of a share can be similar in DDM and this method because in some cases,
dividend are the only earnings an organisation has gained.
Year E1 NPV PVF
(10.27% )
Cont. of
Assets PVGO
1 383.00 - 10.90 0.9069 3729.31 - 9.89
2 62.07 0.8224 51.05
3 31.87 0.7458 23.77
4 28.51 0.6763 19.28
5 17.9 0.6134 11.00
Firm Value 3,824.52
Earnings & I nvestments Model
6
⊘ This is a preview!⊘
Do you want full access?
Subscribe today to unlock all pages.
Trusted by 1+ million students worldwide
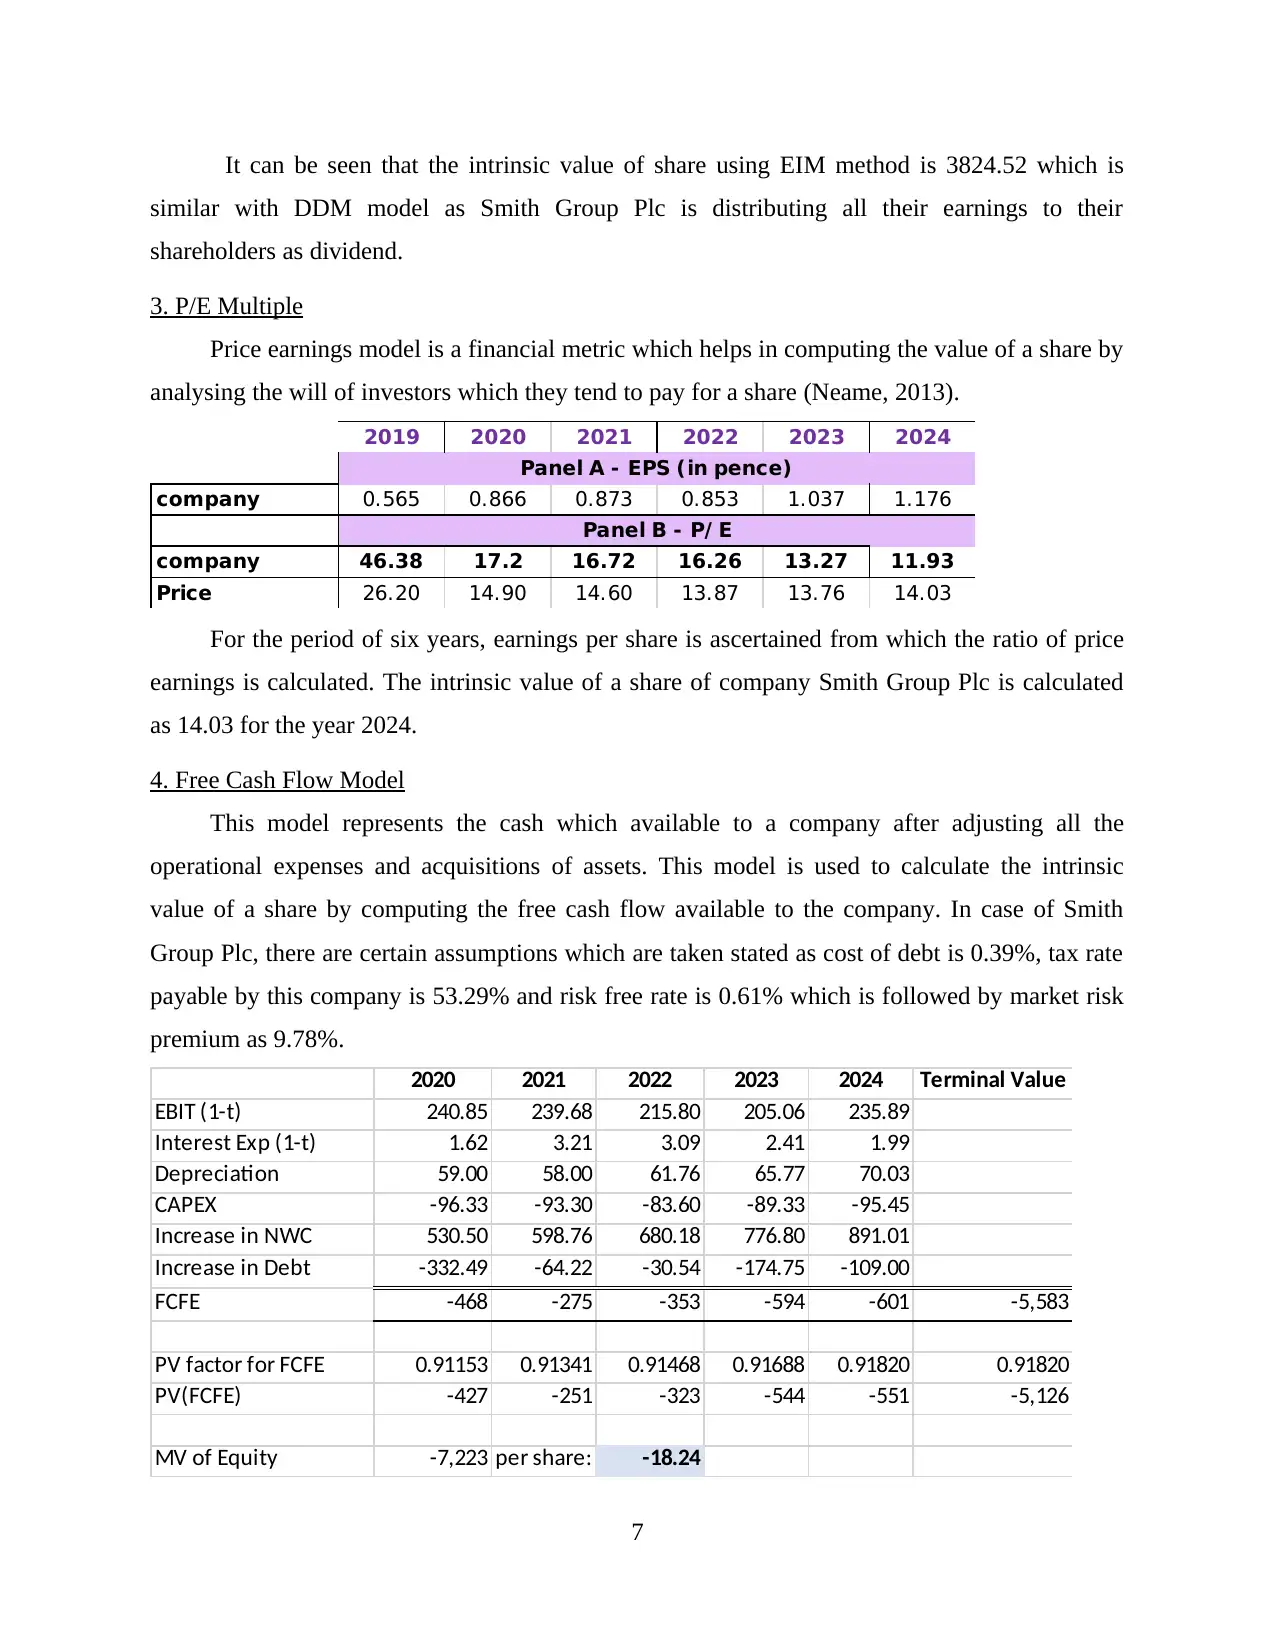
It can be seen that the intrinsic value of share using EIM method is 3824.52 which is
similar with DDM model as Smith Group Plc is distributing all their earnings to their
shareholders as dividend.
3. P/E Multiple
Price earnings model is a financial metric which helps in computing the value of a share by
analysing the will of investors which they tend to pay for a share (Neame, 2013).
2019 2020 2021 2022 2023 2024
company 0.565 0.866 0.873 0.853 1.037 1.176
company 46.38 17.2 16.72 16.26 13.27 11.93
Price 26.20 14.90 14.60 13.87 13.76 14.03
Panel A - EPS (in pence)
Panel B - P/ E
For the period of six years, earnings per share is ascertained from which the ratio of price
earnings is calculated. The intrinsic value of a share of company Smith Group Plc is calculated
as 14.03 for the year 2024.
4. Free Cash Flow Model
This model represents the cash which available to a company after adjusting all the
operational expenses and acquisitions of assets. This model is used to calculate the intrinsic
value of a share by computing the free cash flow available to the company. In case of Smith
Group Plc, there are certain assumptions which are taken stated as cost of debt is 0.39%, tax rate
payable by this company is 53.29% and risk free rate is 0.61% which is followed by market risk
premium as 9.78%.
2020 2021 2022 2023 2024 Terminal Value
EBIT (1-t) 240.85 239.68 215.80 205.06 235.89
Interest Exp (1-t) 1.62 3.21 3.09 2.41 1.99
Depreciation 59.00 58.00 61.76 65.77 70.03
CAPEX -96.33 -93.30 -83.60 -89.33 -95.45
Increase in NWC 530.50 598.76 680.18 776.80 891.01
Increase in Debt -332.49 -64.22 -30.54 -174.75 -109.00
FCFE -468 -275 -353 -594 -601 -5,583
PV factor for FCFE 0.91153 0.91341 0.91468 0.91688 0.91820 0.91820
PV(FCFE) -427 -251 -323 -544 -551 -5,126
MV of Equity -7,223 per share: -18.24
7
Paraphrase This Document
Need a fresh take? Get an instant paraphrase of this document with our AI Paraphraser
From the above numerical analysis, it can be seen that intrinsic value per share is
calculated as -18.24. This value is presenting a negative amount which is the result of non
availability of free cash flow for Smith Group Plc.
5. Critical discussion of the results
Intrinsic value is the measure of calculating worth of a share of an organisation. There are
various models by which intrinsic value can be calculated. In context of Smith Group Plc,
various models are used (Snowball 2013). The intrinsic value using the dividend discount model
and Earnings and Investments Model is similar as dividend are the only earnings which Smith
Group Plc is gaining. The reason behind deviation in the intrinsic value computed from different
models is the different assumptions which are made. In DDM model, it is assumed that both
dividend growth rate and return on equity will be constant forever. On the other hand, free cash
flow assumes that there always will be tax rate and risk free rate.
From the implementation of various models, it has been found that potential investors of
Smith Group Plc. should use dividend discount model while computing share price of this
company. The reason behind this recommendation is that DDM is most suitable model for
companies which regularly provide dividend to their shareholders.
PART C: Bond Valuation
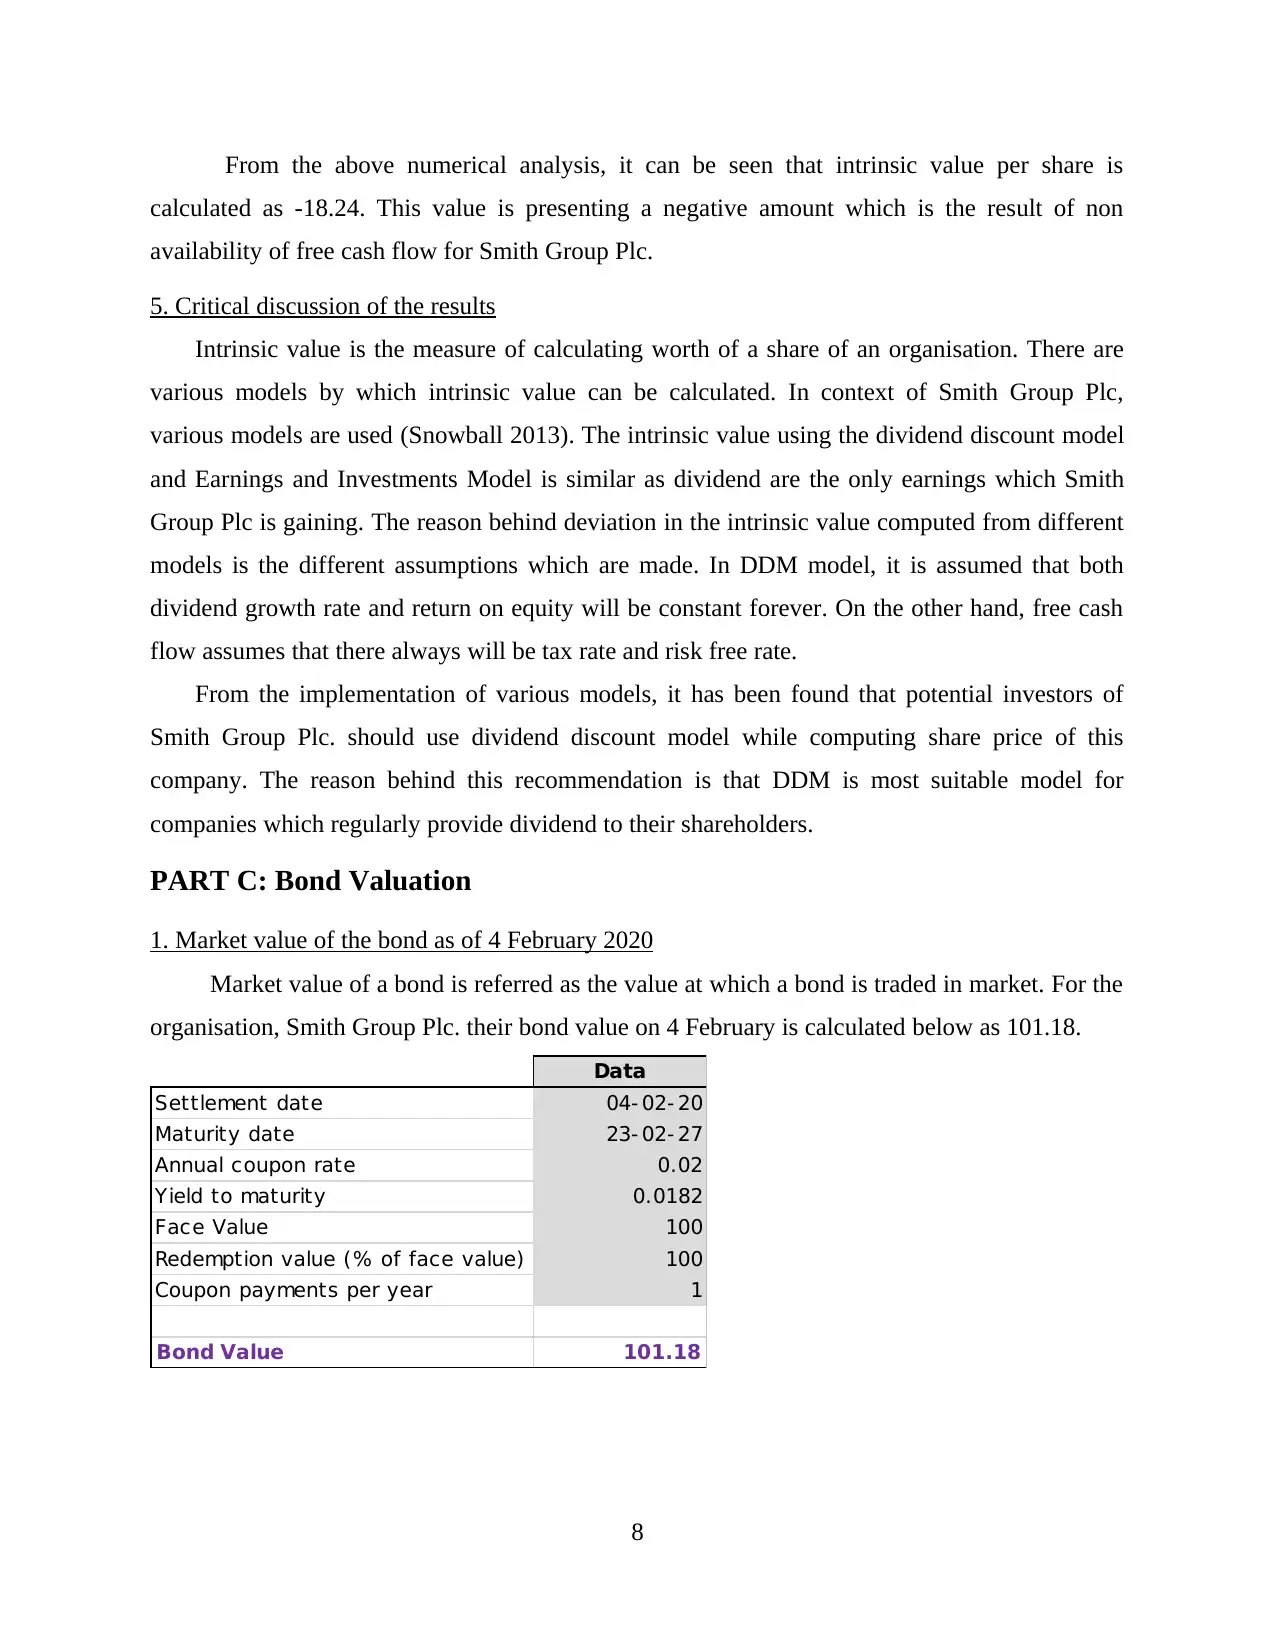
1. Market value of the bond as of 4 February 2020
Market value of a bond is referred as the value at which a bond is traded in market. For the
organisation, Smith Group Plc. their bond value on 4 February is calculated below as 101.18.
Data
Settlement date 04- 02- 20
Maturity date 23- 02- 27
Annual coupon rate 0.02
Yield to maturity 0.0182
Face Value 100
Redemption value (% of face value) 100
Coupon payments per year 1
Bond Value 101.18
8
calculated as -18.24. This value is presenting a negative amount which is the result of non
availability of free cash flow for Smith Group Plc.
5. Critical discussion of the results
Intrinsic value is the measure of calculating worth of a share of an organisation. There are
various models by which intrinsic value can be calculated. In context of Smith Group Plc,
various models are used (Snowball 2013). The intrinsic value using the dividend discount model
and Earnings and Investments Model is similar as dividend are the only earnings which Smith
Group Plc is gaining. The reason behind deviation in the intrinsic value computed from different
models is the different assumptions which are made. In DDM model, it is assumed that both
dividend growth rate and return on equity will be constant forever. On the other hand, free cash
flow assumes that there always will be tax rate and risk free rate.
From the implementation of various models, it has been found that potential investors of
Smith Group Plc. should use dividend discount model while computing share price of this
company. The reason behind this recommendation is that DDM is most suitable model for
companies which regularly provide dividend to their shareholders.
PART C: Bond Valuation
1. Market value of the bond as of 4 February 2020
Market value of a bond is referred as the value at which a bond is traded in market. For the
organisation, Smith Group Plc. their bond value on 4 February is calculated below as 101.18.
Data
Settlement date 04- 02- 20
Maturity date 23- 02- 27
Annual coupon rate 0.02
Yield to maturity 0.0182
Face Value 100
Redemption value (% of face value) 100
Coupon payments per year 1
Bond Value 101.18
8
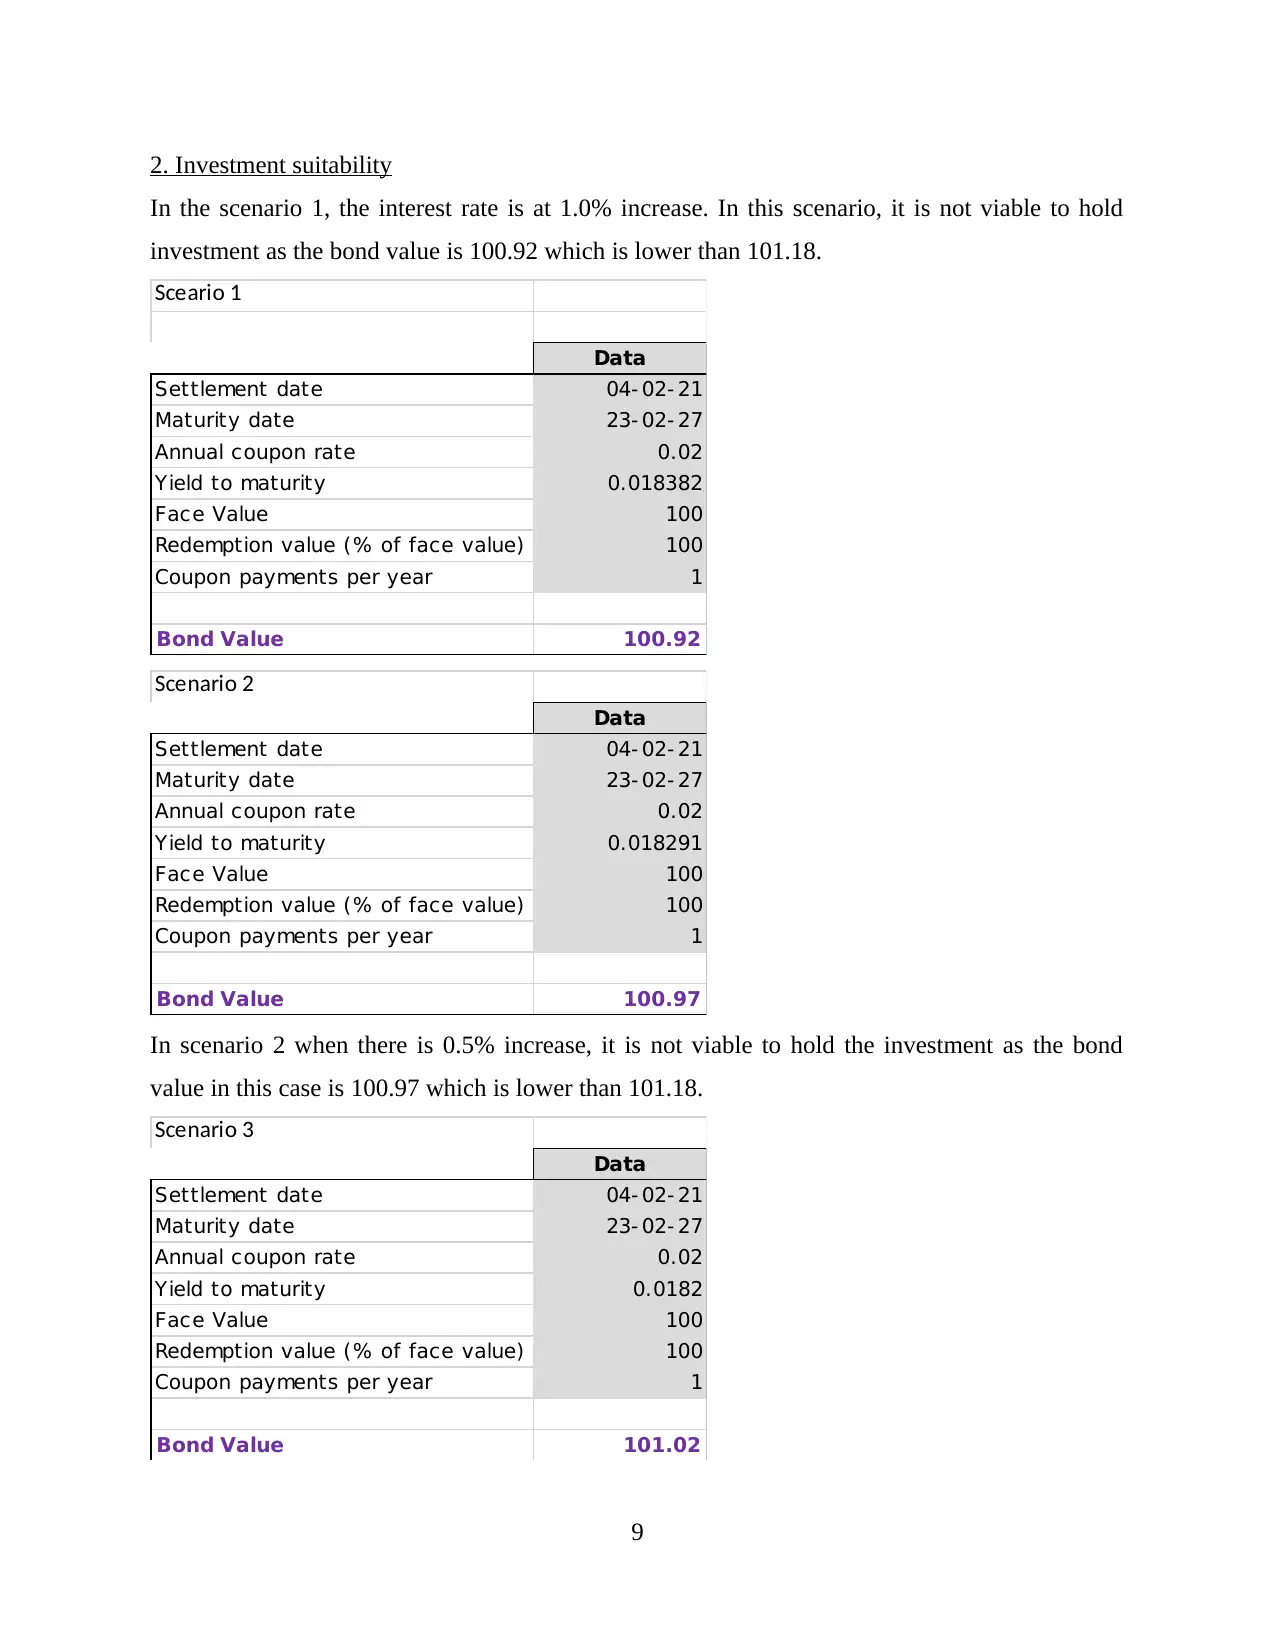
2. Investment suitability
In the scenario 1, the interest rate is at 1.0% increase. In this scenario, it is not viable to hold
investment as the bond value is 100.92 which is lower than 101.18.
Sceario 1
Data
Settlement date 04- 02- 21
Maturity date 23- 02- 27
Annual coupon rate 0.02
Yield to maturity 0.018382
Face Value 100
Redemption value (% of face value) 100
Coupon payments per year 1
Bond Value 100.92
Scenario 2
Data
Settlement date 04- 02- 21
Maturity date 23- 02- 27
Annual coupon rate 0.02
Yield to maturity 0.018291
Face Value 100
Redemption value (% of face value) 100
Coupon payments per year 1
Bond Value 100.97
In scenario 2 when there is 0.5% increase, it is not viable to hold the investment as the bond
value in this case is 100.97 which is lower than 101.18.
Scenario 3
Data
Settlement date 04- 02- 21
Maturity date 23- 02- 27
Annual coupon rate 0.02
Yield to maturity 0.0182
Face Value 100
Redemption value (% of face value) 100
Coupon payments per year 1
Bond Value 101.02
9
⊘ This is a preview!⊘
Do you want full access?
Subscribe today to unlock all pages.
Trusted by 1+ million students worldwide
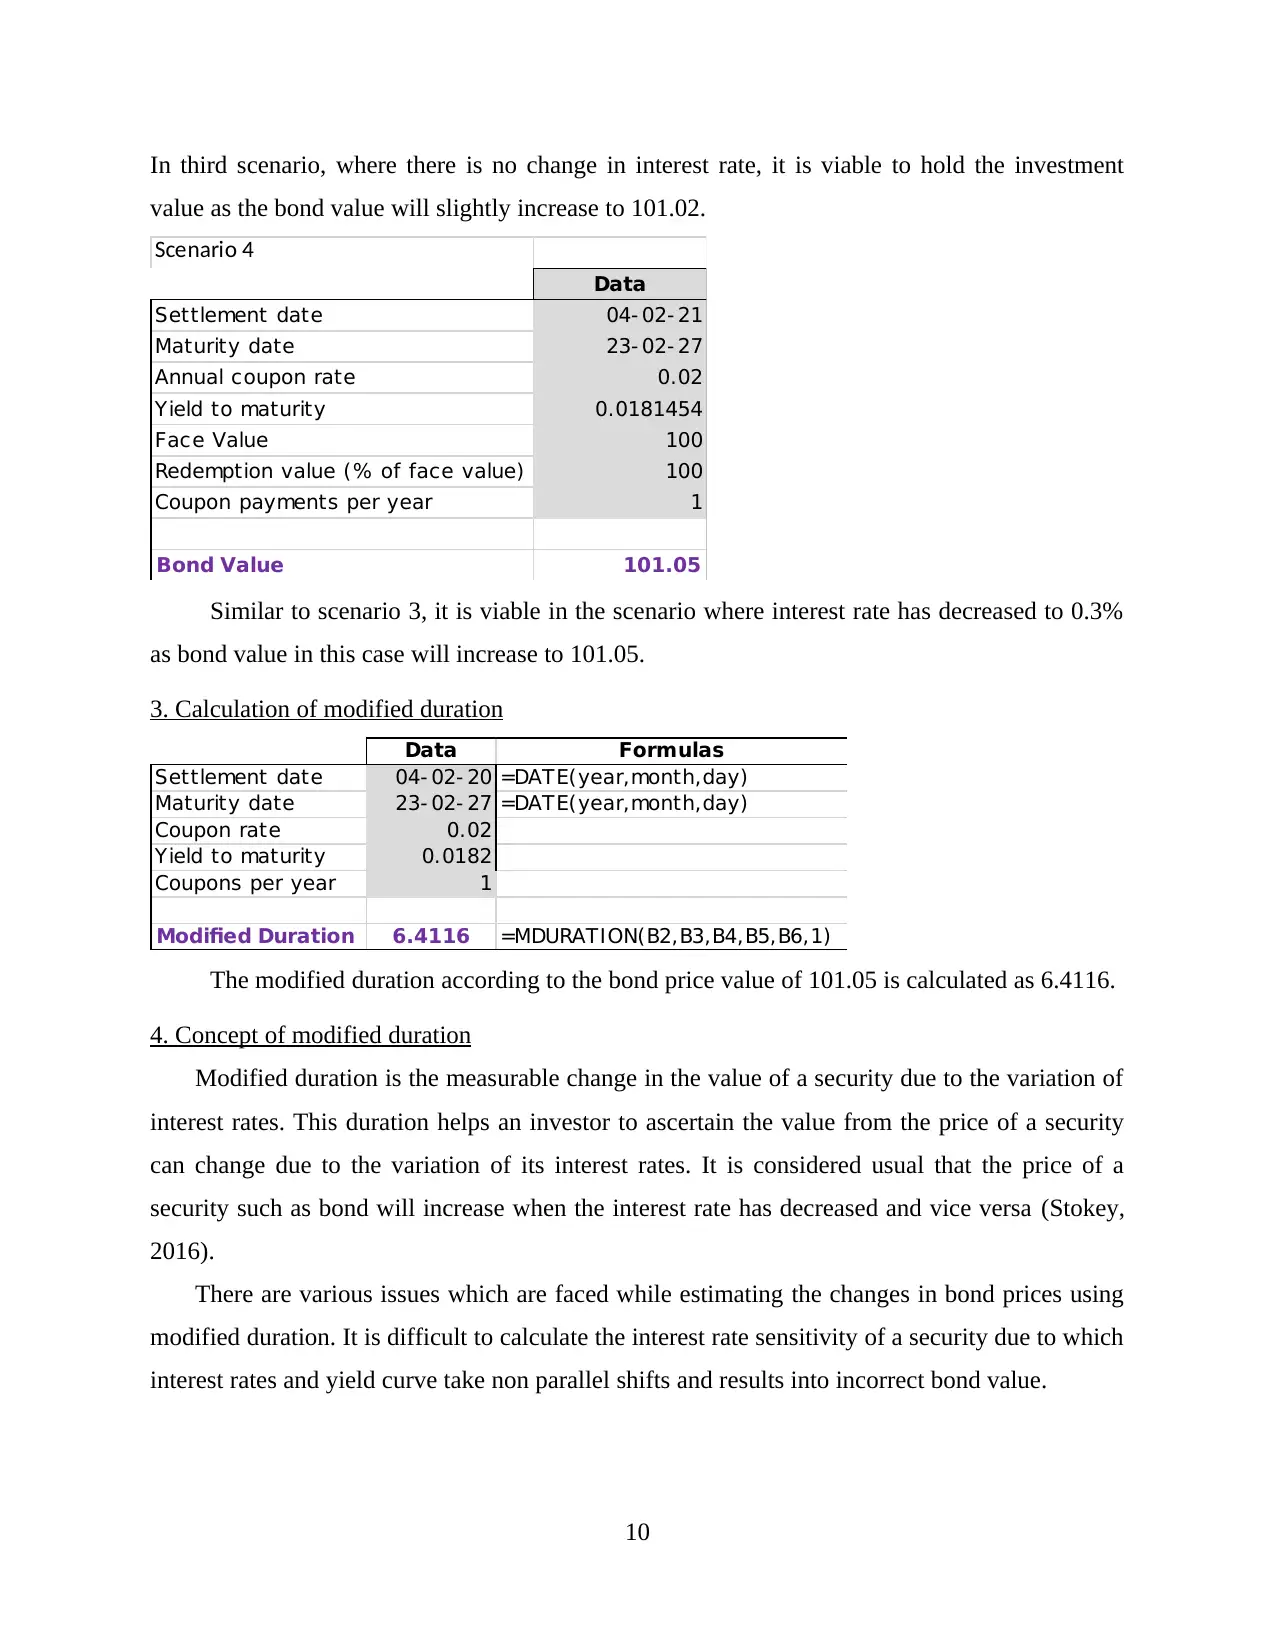
In third scenario, where there is no change in interest rate, it is viable to hold the investment
value as the bond value will slightly increase to 101.02.
Scenario 4
Data
Settlement date 04- 02- 21
Maturity date 23- 02- 27
Annual coupon rate 0.02
Yield to maturity 0.0181454
Face Value 100
Redemption value (% of face value) 100
Coupon payments per year 1
Bond Value 101.05
Similar to scenario 3, it is viable in the scenario where interest rate has decreased to 0.3%
as bond value in this case will increase to 101.05.
3. Calculation of modified duration
Data Formulas
Settlement date 04- 02- 20 =DATE(year,month,day)
Maturity date 23- 02- 27 =DATE(year,month,day)
Coupon rate 0.02
Yield to maturity 0.0182
Coupons per year 1
Modified Duration 6.4116 =MDURATION(B2,B3,B4,B5,B6,1)
The modified duration according to the bond price value of 101.05 is calculated as 6.4116.
4. Concept of modified duration
Modified duration is the measurable change in the value of a security due to the variation of
interest rates. This duration helps an investor to ascertain the value from the price of a security
can change due to the variation of its interest rates. It is considered usual that the price of a
security such as bond will increase when the interest rate has decreased and vice versa (Stokey,
2016).
There are various issues which are faced while estimating the changes in bond prices using
modified duration. It is difficult to calculate the interest rate sensitivity of a security due to which
interest rates and yield curve take non parallel shifts and results into incorrect bond value.
10
Paraphrase This Document
Need a fresh take? Get an instant paraphrase of this document with our AI Paraphraser
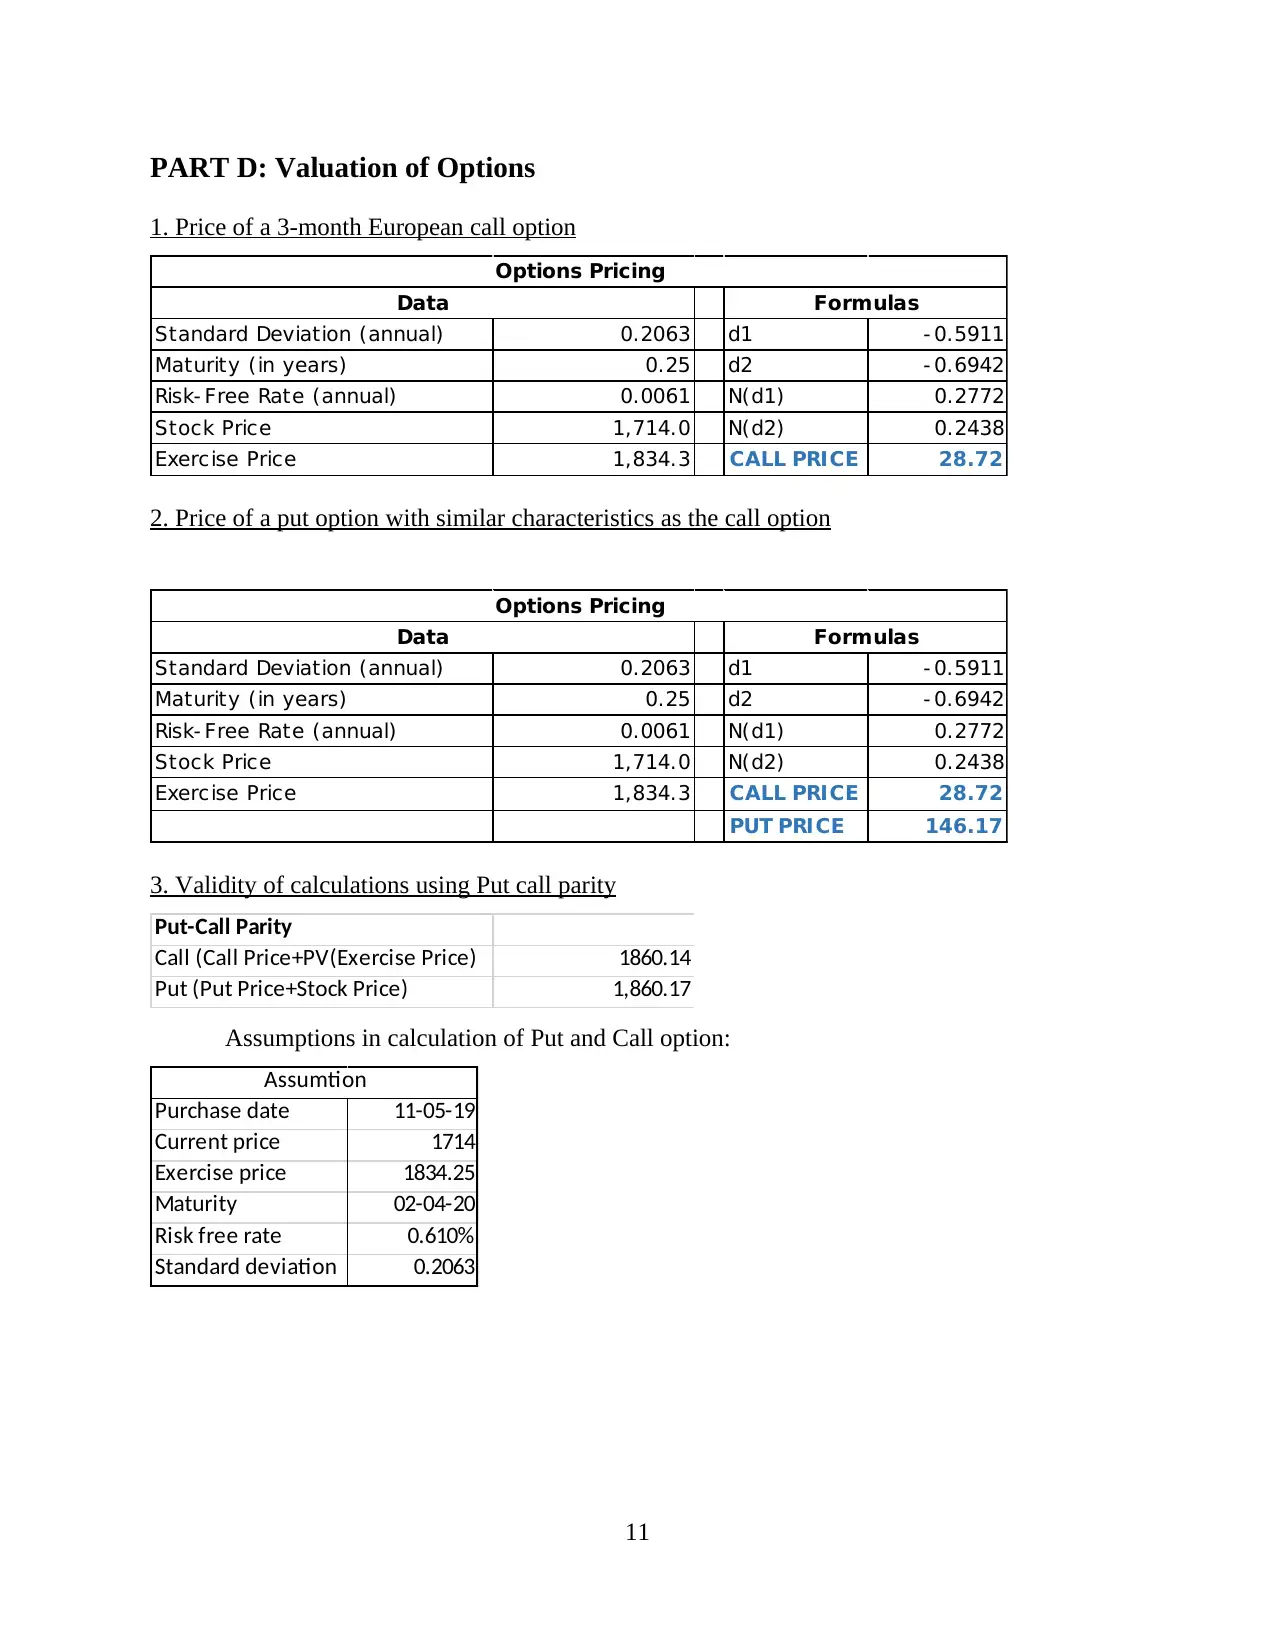
PART D: Valuation of Options
1. Price of a 3-month European call option
Standard Deviation (annual) 0.2063 d1 - 0.5911
Maturity (in years) 0.25 d2 - 0.6942
Risk- Free Rate (annual) 0.0061 N(d1) 0.2772
Stock Price 1,714.0 N(d2) 0.2438
Exercise Price 1,834.3 CALL PRICE 28.72
Options Pricing
Data Formulas
2. Price of a put option with similar characteristics as the call option
Standard Deviation (annual) 0.2063 d1 - 0.5911
Maturity (in years) 0.25 d2 - 0.6942
Risk- Free Rate (annual) 0.0061 N(d1) 0.2772
Stock Price 1,714.0 N(d2) 0.2438
Exercise Price 1,834.3 CALL PRICE 28.72
PUT PRICE 146.17
Options Pricing
Data Formulas
3. Validity of calculations using Put call parity
Put-Call Parity
Call (Call Price+PV(Exercise Price) 1860.14
Put (Put Price+Stock Price) 1,860.17
Assumptions in calculation of Put and Call option:
Purchase date 11-05-19
Current price 1714
Exercise price 1834.25
Maturity 02-04-20
Risk free rate 0.610%
Standard deviation 0.2063
Assumtion
11
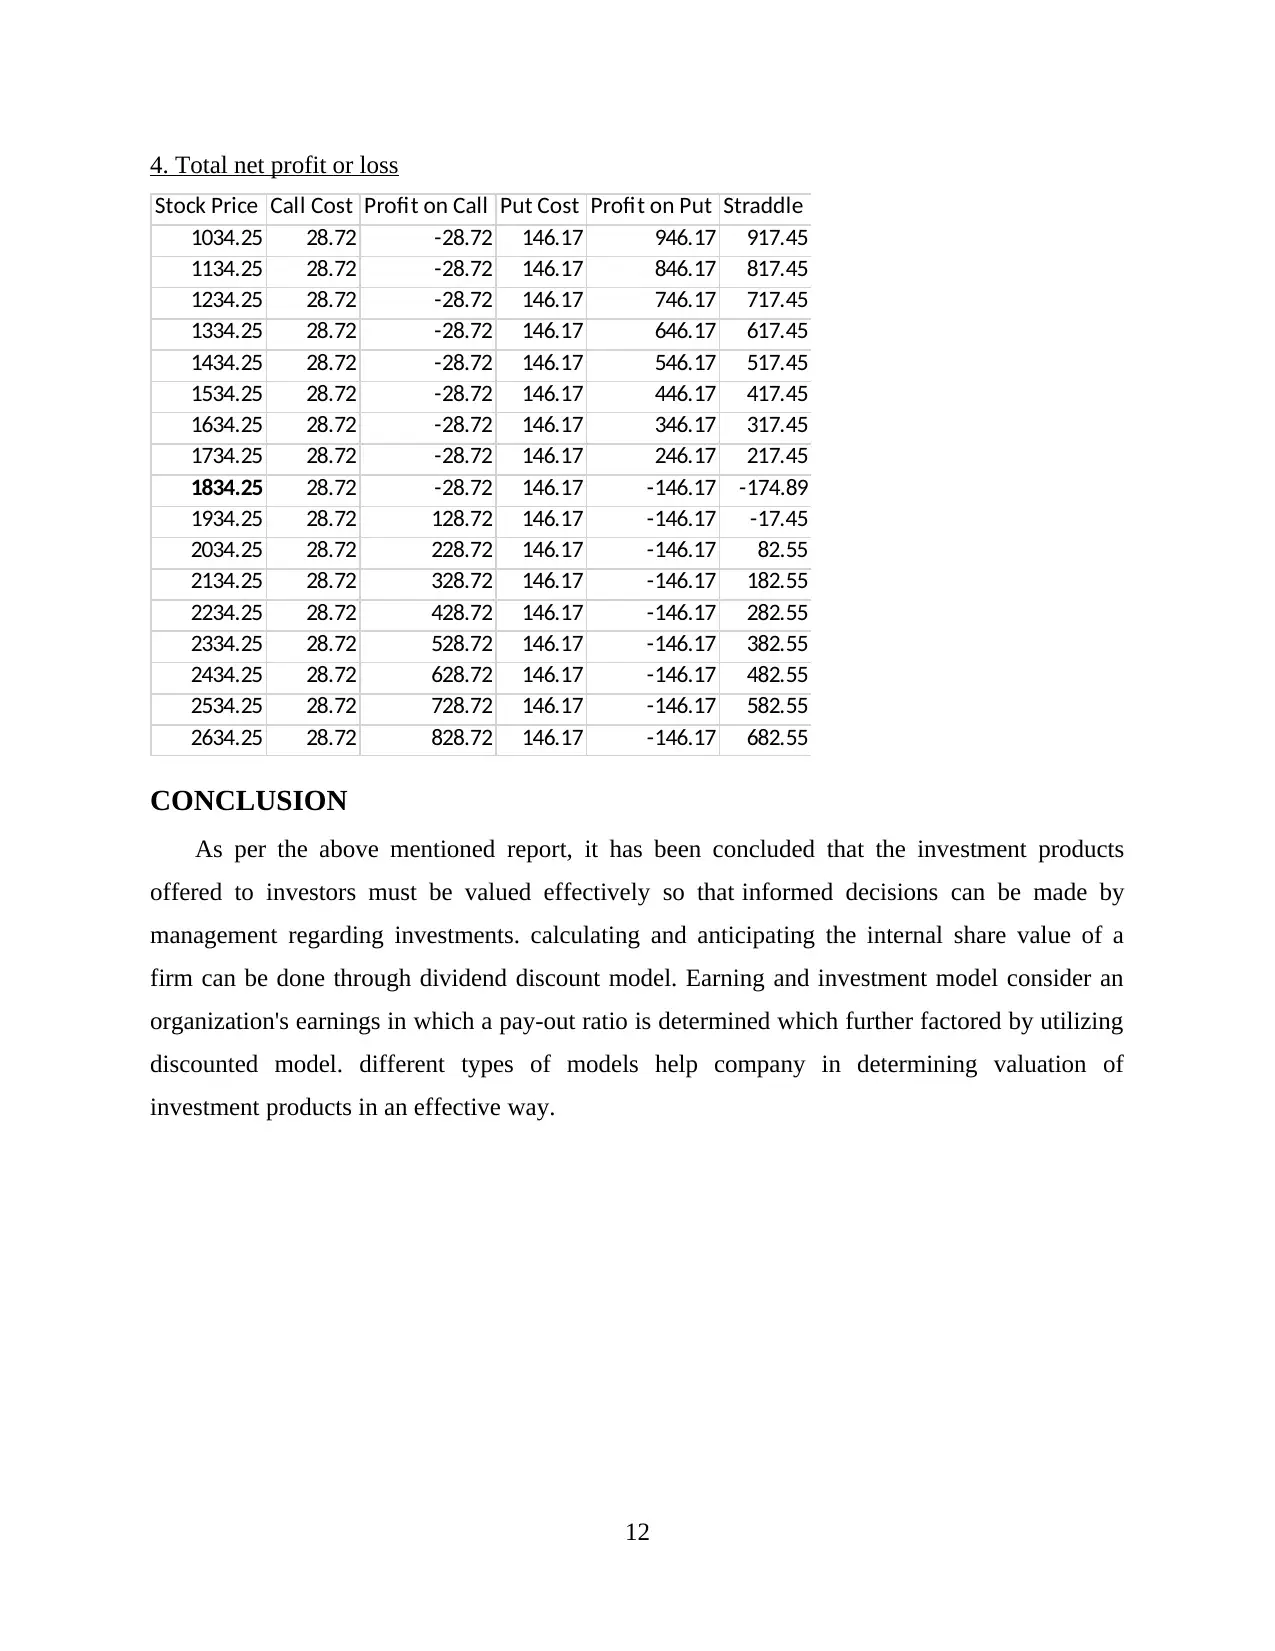
4. Total net profit or loss
Stock Price Call Cost Profit on Call Put Cost Profit on Put Straddle
1034.25 28.72 -28.72 146.17 946.17 917.45
1134.25 28.72 -28.72 146.17 846.17 817.45
1234.25 28.72 -28.72 146.17 746.17 717.45
1334.25 28.72 -28.72 146.17 646.17 617.45
1434.25 28.72 -28.72 146.17 546.17 517.45
1534.25 28.72 -28.72 146.17 446.17 417.45
1634.25 28.72 -28.72 146.17 346.17 317.45
1734.25 28.72 -28.72 146.17 246.17 217.45
1834.25 28.72 -28.72 146.17 -146.17 -174.89
1934.25 28.72 128.72 146.17 -146.17 -17.45
2034.25 28.72 228.72 146.17 -146.17 82.55
2134.25 28.72 328.72 146.17 -146.17 182.55
2234.25 28.72 428.72 146.17 -146.17 282.55
2334.25 28.72 528.72 146.17 -146.17 382.55
2434.25 28.72 628.72 146.17 -146.17 482.55
2534.25 28.72 728.72 146.17 -146.17 582.55
2634.25 28.72 828.72 146.17 -146.17 682.55
CONCLUSION
As per the above mentioned report, it has been concluded that the investment products
offered to investors must be valued effectively so that informed decisions can be made by
management regarding investments. calculating and anticipating the internal share value of a
firm can be done through dividend discount model. Earning and investment model consider an
organization's earnings in which a pay-out ratio is determined which further factored by utilizing
discounted model. different types of models help company in determining valuation of
investment products in an effective way.
12
⊘ This is a preview!⊘
Do you want full access?
Subscribe today to unlock all pages.
Trusted by 1+ million students worldwide
1 out of 13
Related Documents


Your All-in-One AI-Powered Toolkit for Academic Success.
+13062052269
info@desklib.com
Available 24*7 on WhatsApp / Email
![[object Object]](/_next/static/media/star-bottom.7253800d.svg)
Unlock your academic potential
Copyright © 2020–2026 A2Z Services. All Rights Reserved. Developed and managed by ZUCOL.