Detailed Valuation Report: Nike's Financial Performance
VerifiedAdded on 2019/09/19
|22
|3201
|503
Report
AI Summary
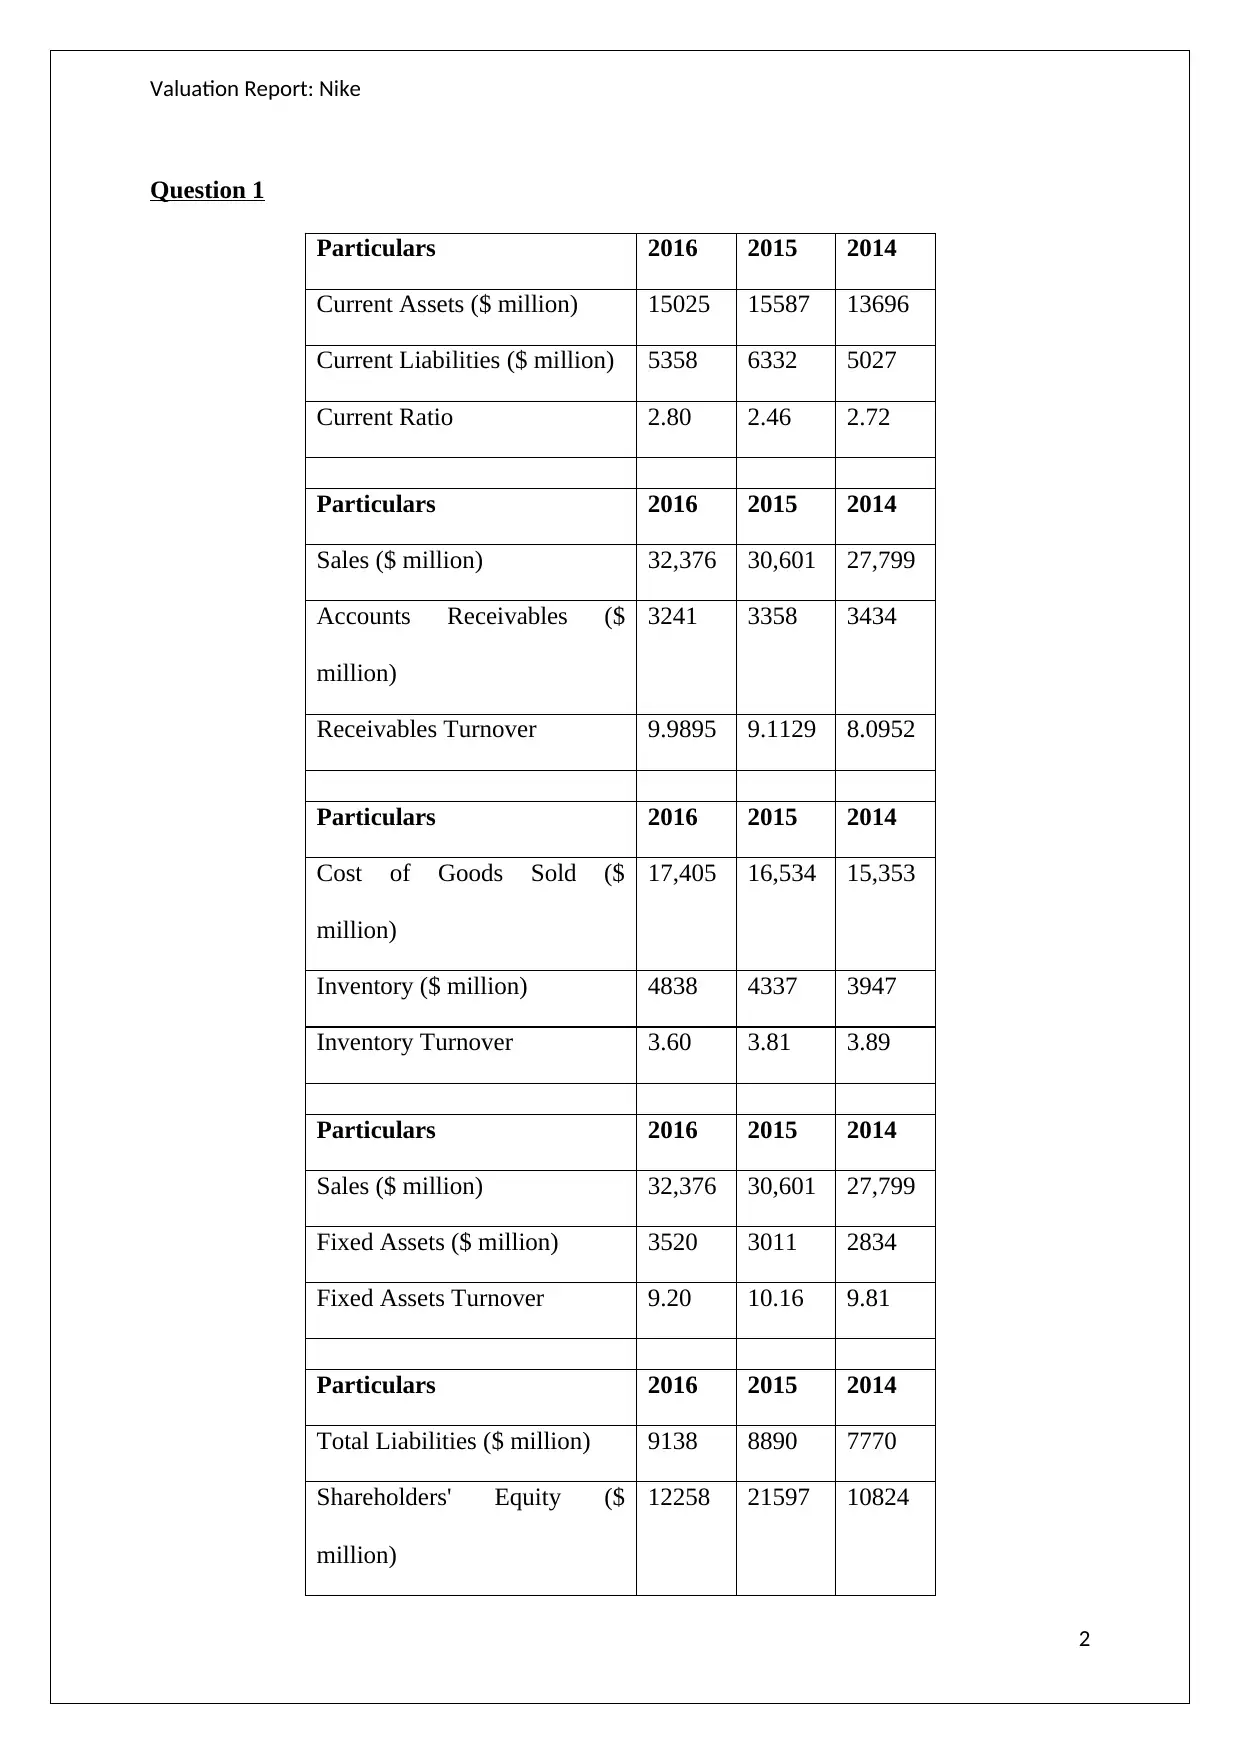
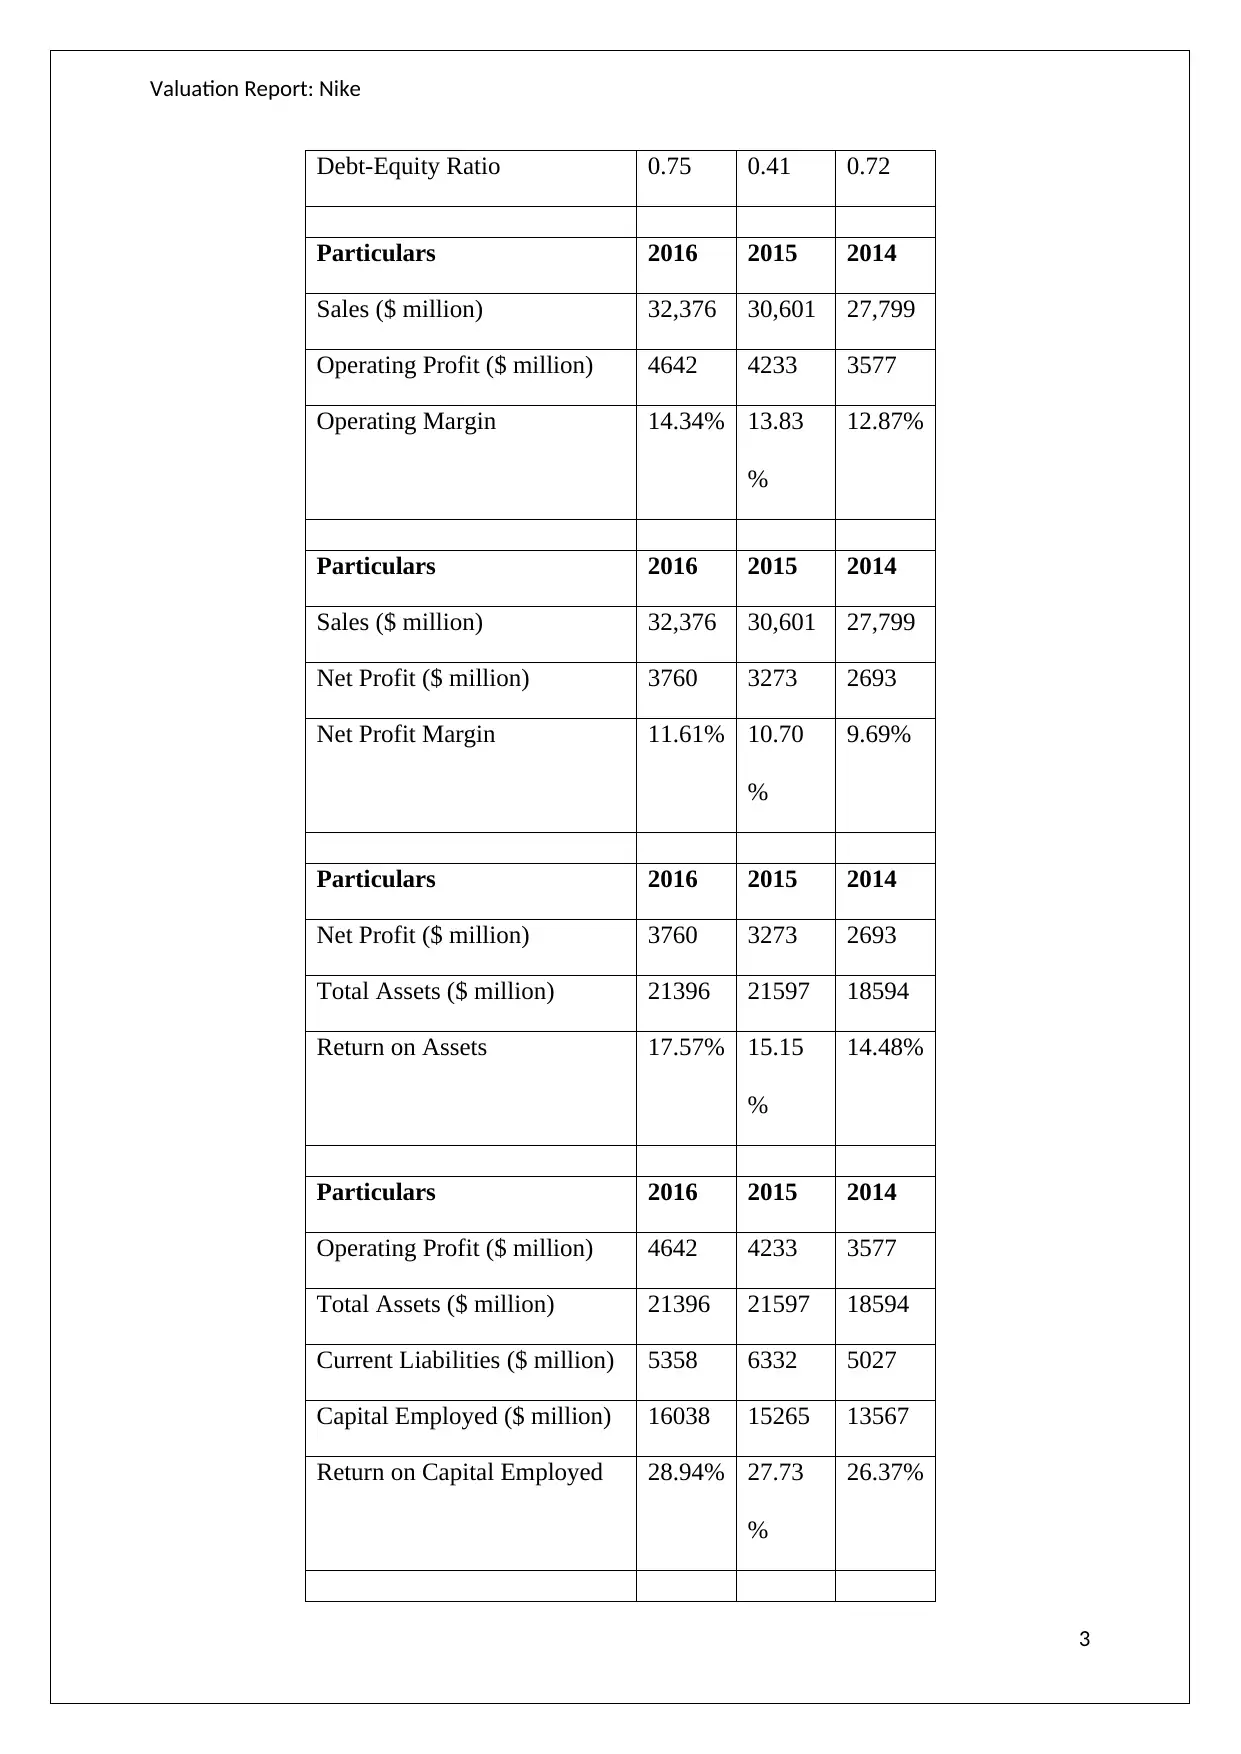
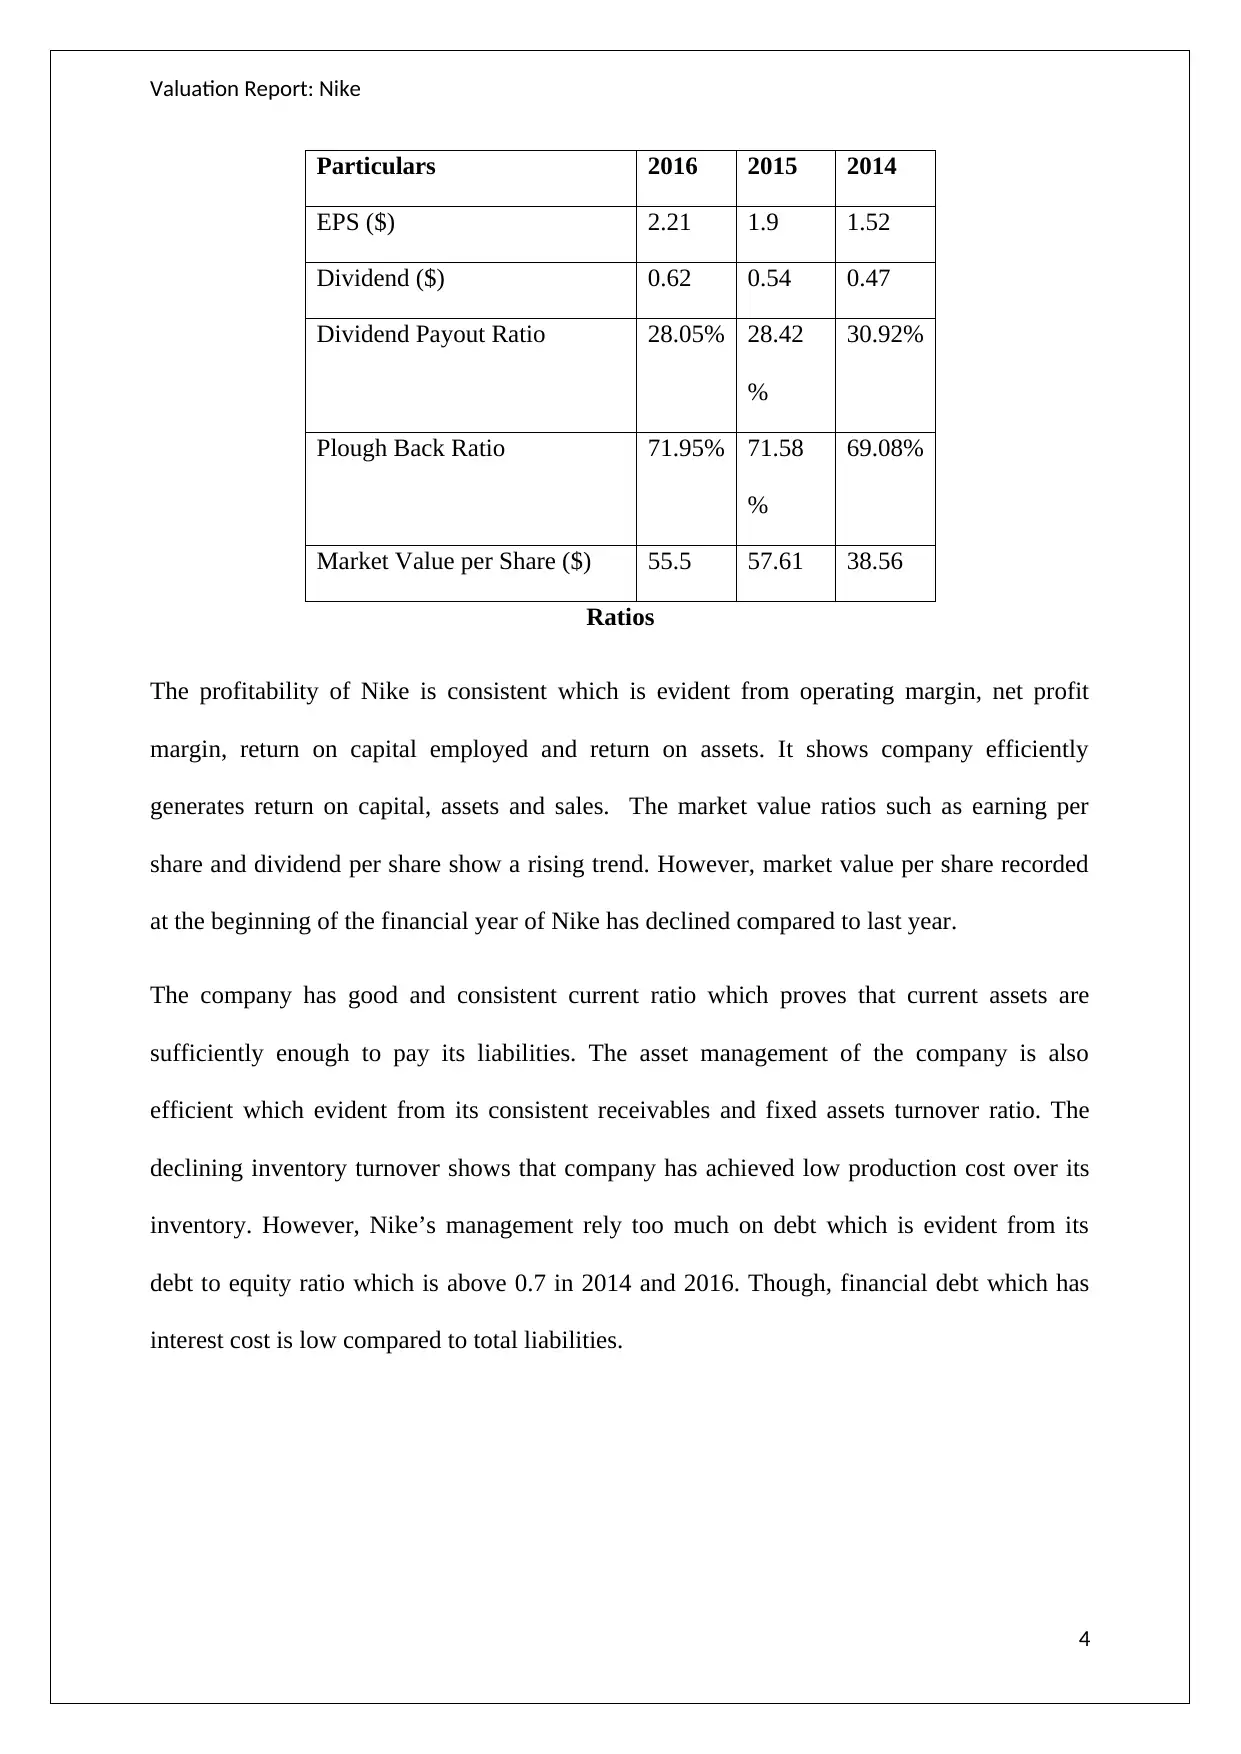
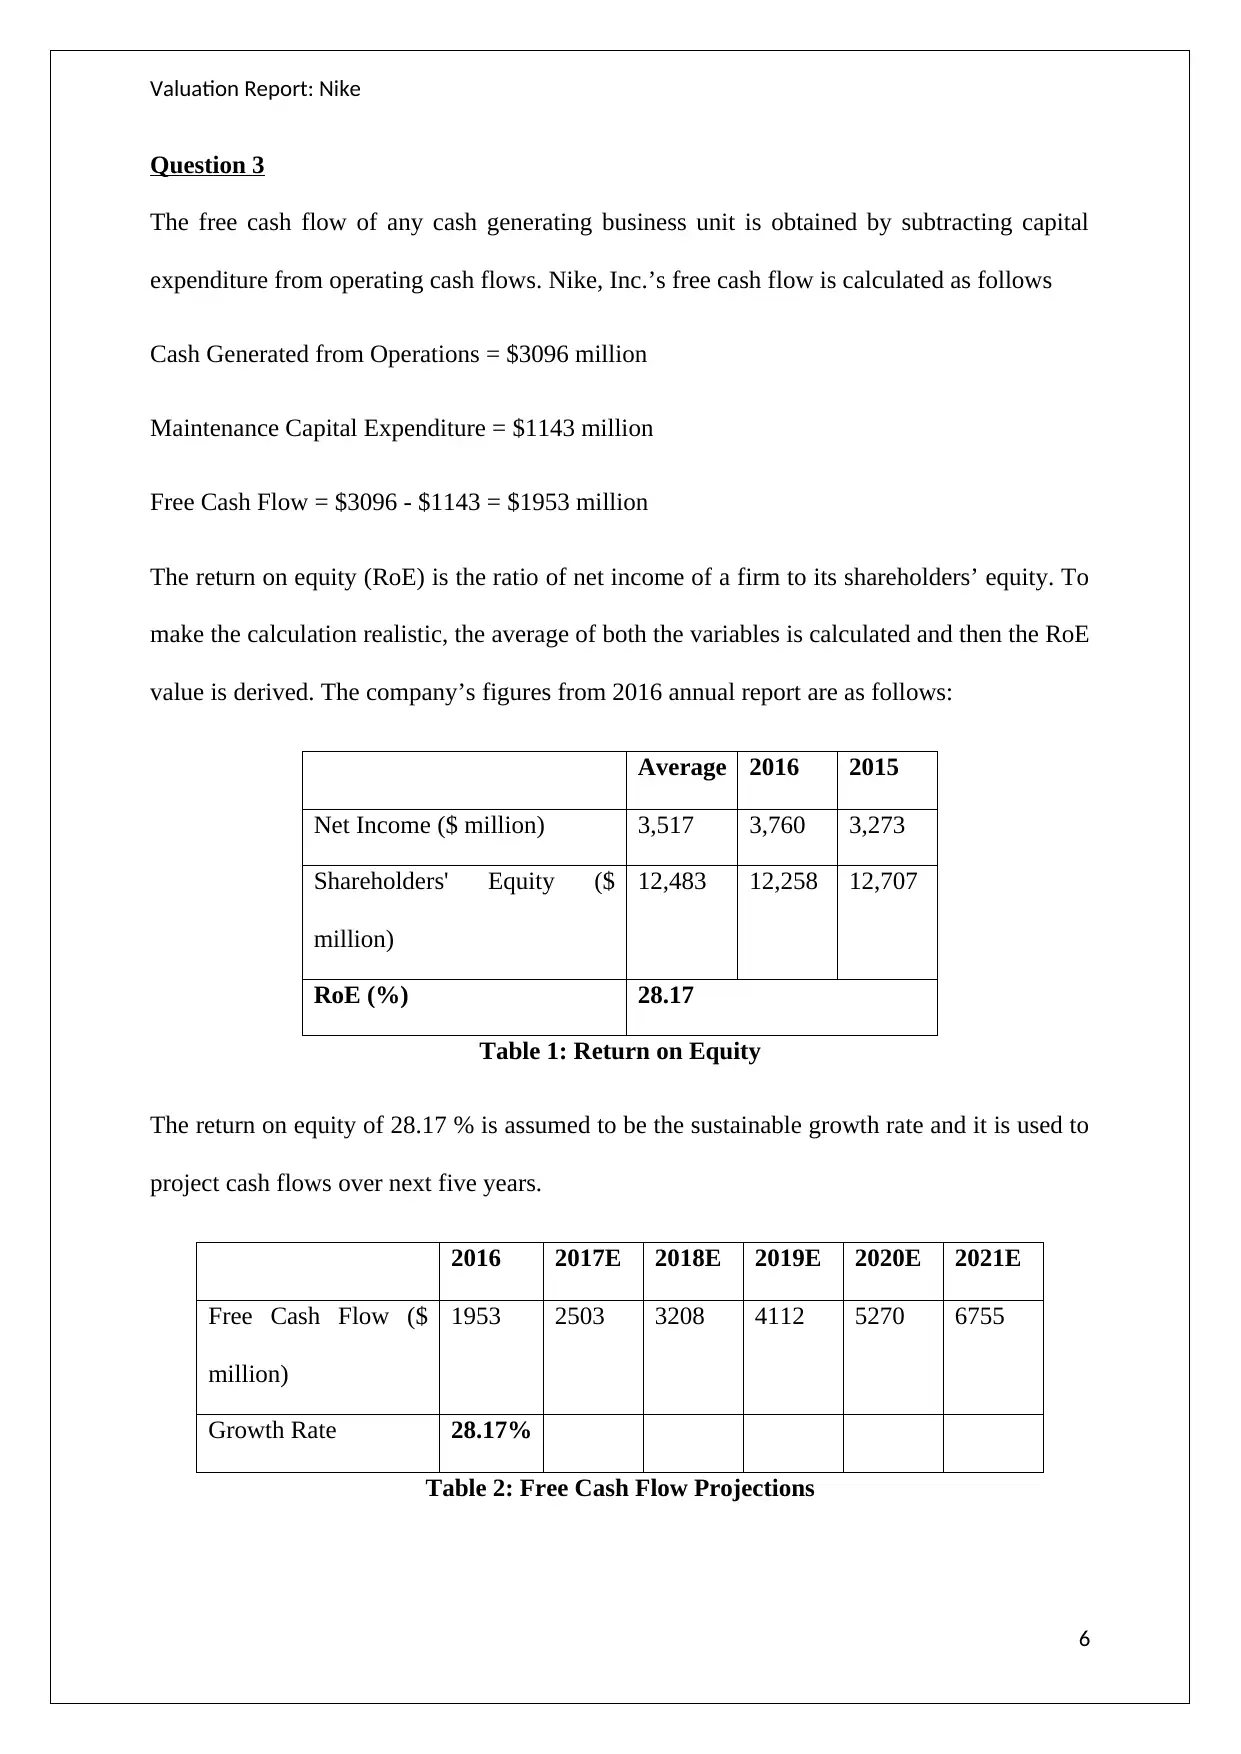
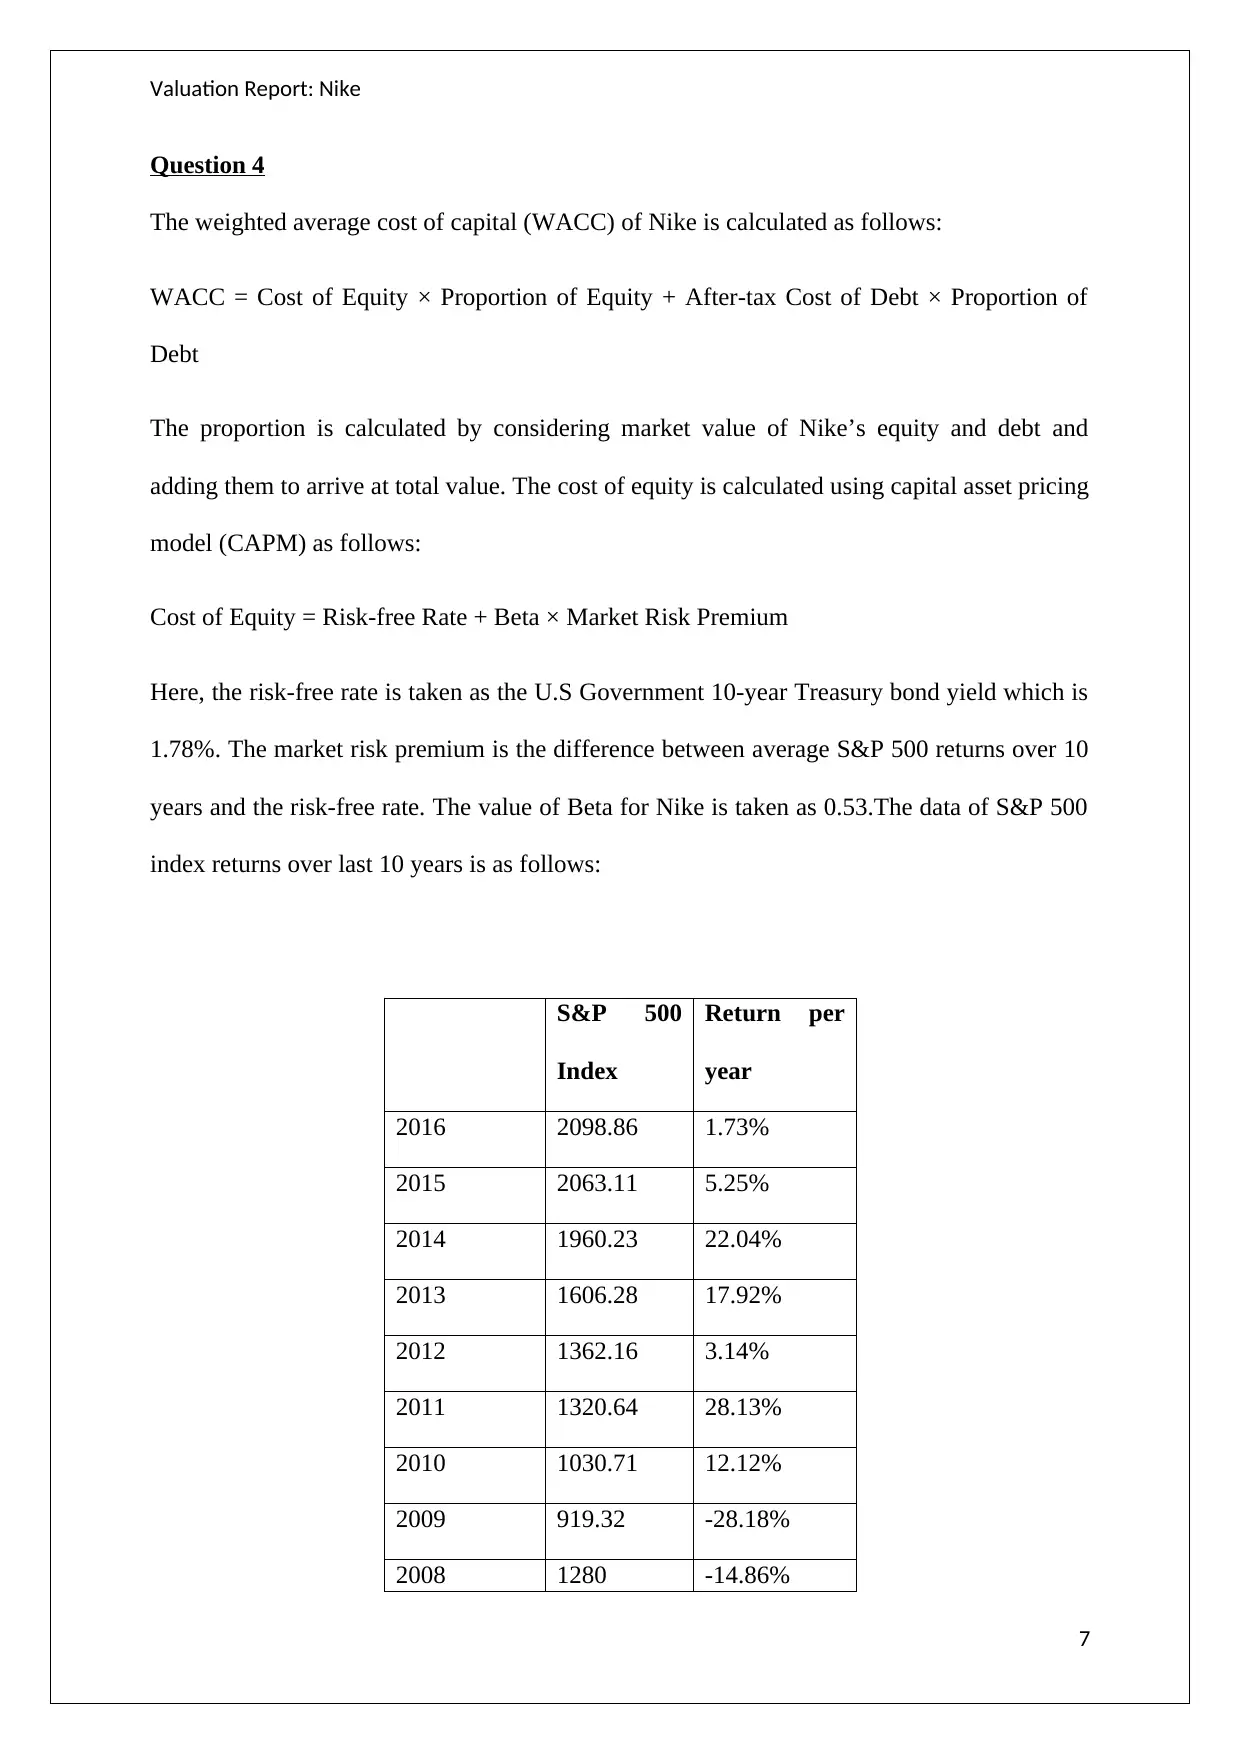
This report presents a comprehensive valuation analysis of Nike, Inc., covering various financial aspects. It begins with an overview of Nike's financial ratios, including current, receivables, inventory, and fixed assets turnover, along with profitability and market value ratios from 2014 to 2016, highlighting consistent profitability and efficient asset management. The report then calculates Nike's free cash flow and projects it over the next five years, estimating the return on equity. The weighted average cost of capital (WACC) is determined using the Capital Asset Pricing Model (CAPM), considering the risk-free rate, beta, and market risk premium, along with the cost of debt. The terminal value is calculated, and the firm's total value is derived by summing the present value of free cash flows and the terminal value. Sensitivity analysis is performed to assess the impact of changes in the terminal value. The intrinsic value per share is calculated, followed by an evaluation of Economic Value Added (EVA) and Market Value Added (MVA) to assess Nike's operating and market performance. The report concludes with a discussion of Nike's financial health and value creation for stakeholders.
1 out of 22
Related Documents


Your All-in-One AI-Powered Toolkit for Academic Success.
+13062052269
info@desklib.com
Available 24*7 on WhatsApp / Email
![[object Object]](/_next/static/media/star-bottom.7253800d.svg)
Copyright © 2020–2026 A2Z Services. All Rights Reserved. Developed and managed by ZUCOL.