Mathematics Homework: Venn Diagram Application and Analysis of Sets

Verified

Added on  2023/05/29

|3
|502
|206
Homework Assignment
AI Summary
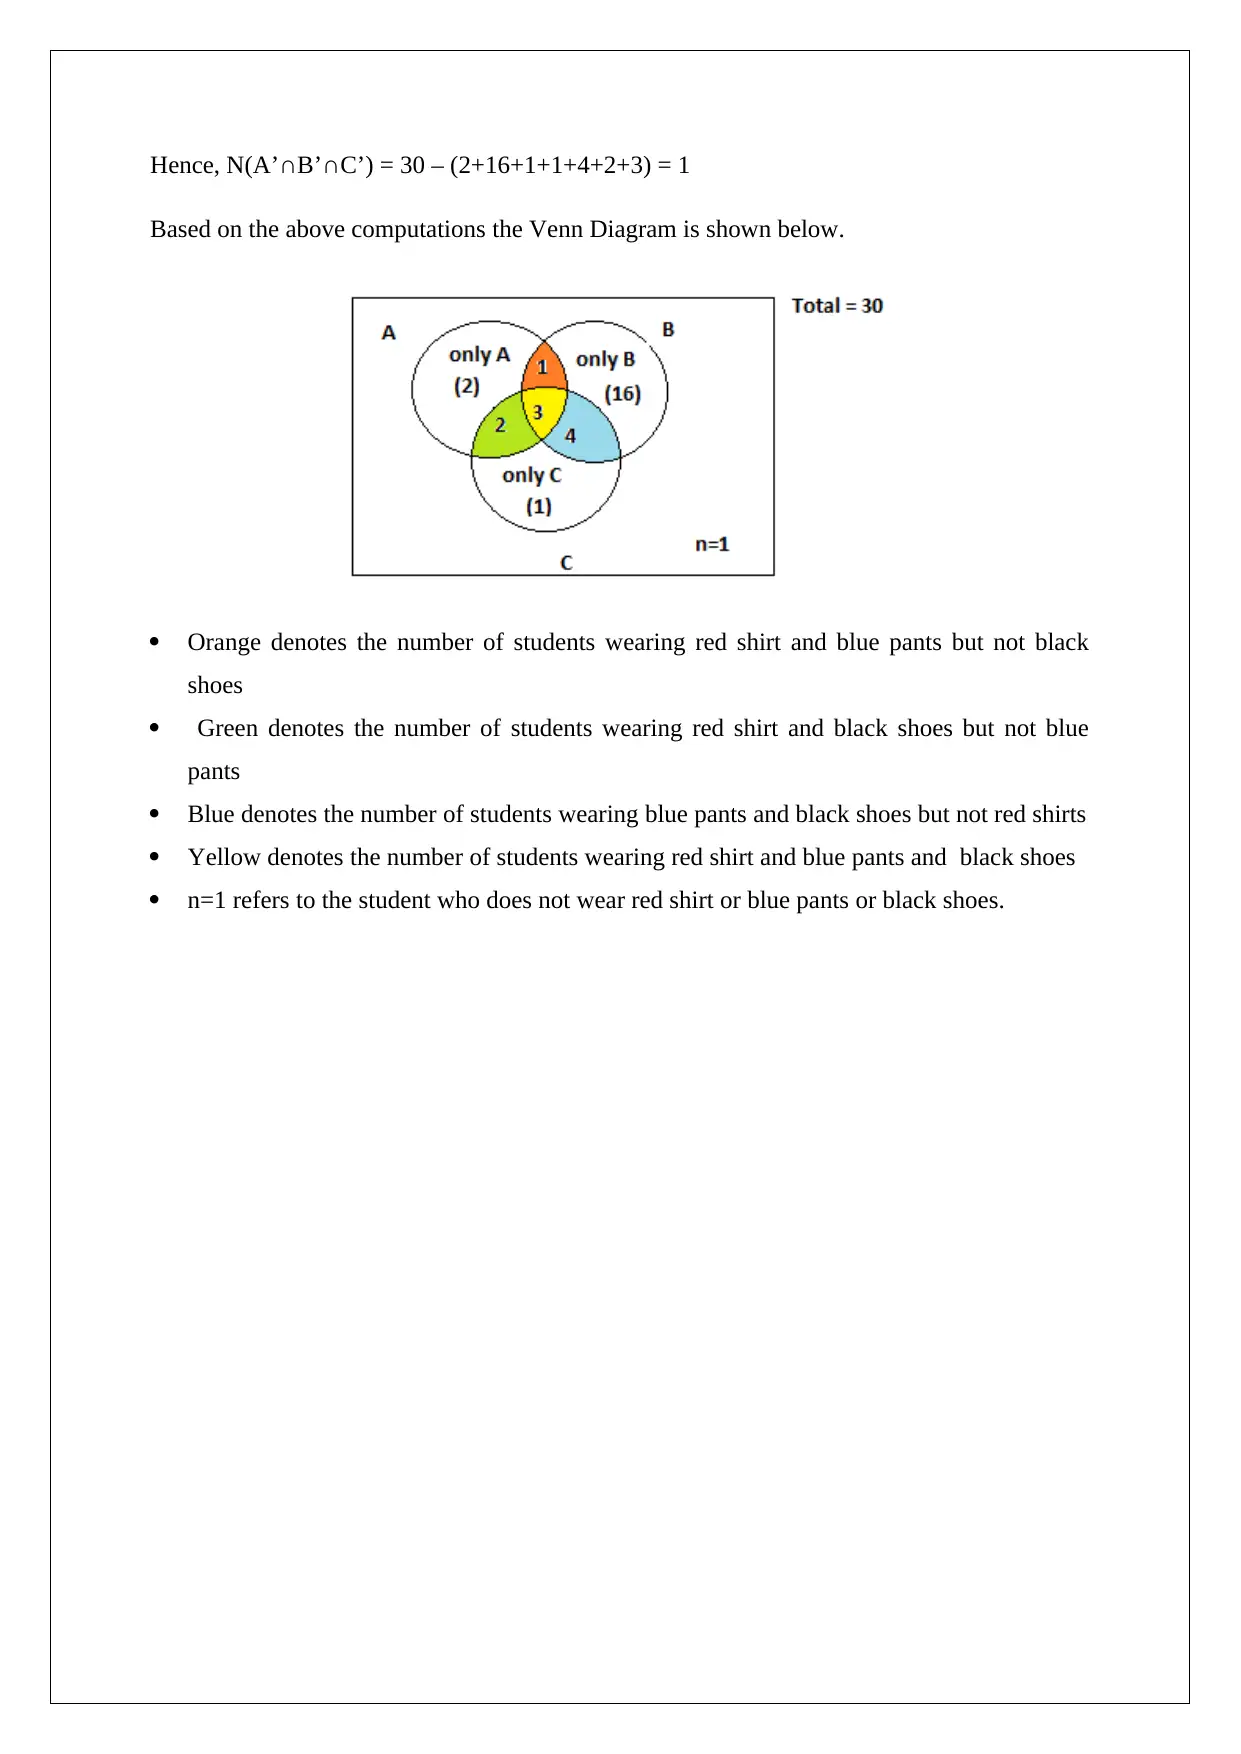
This mathematics homework assignment presents a detailed solution for a Venn diagram problem. The problem involves analyzing the attire of students (red shirts, blue pants, and black shoes) using set theory. Given data on the number of students in each category and their intersections, the solution computes the number of students in various combinations using set operations. Calculations include finding the number of students wearing specific combinations of clothing items, and those not wearing any of the specified items. The solution culminates in a complete Venn diagram illustrating the distribution of students across the different sets, demonstrating the application of set theory to a real-world scenario. The solution also confirms that the sum of all elements in the diagram equals the total number of students.
Document Page
Mathematics
STUDENT Id /name
[Pick the date]
tabler-icon-diamond-filled.svg

Paraphrase This Document

Need a fresh take? Get an instant paraphrase of this document with our AI Paraphraser
Document Page
Let event A highlight the number of students wearing red shirt
Let event B highlight the number of students wearing blue pants
Let event C highlight the number of students wearing black shoes
The following data has been provided to facilitate creation of the Venn Diagram for the given
situation.
N(A) = 8 (i.e. number of elements belonging to set A is 8)
N(B) = 24
N(C) = 10
N(A∩B∩C) = 3
N(A∩B) = 4
N(B∩C) = 7
N(A∩C) = 5
Based on the given information, the following computation may be performed.
N(A∩B∩C’) = N(A∩B) - N(A∩B∩C) = 4-3 = 1
N(B∩C∩A’) = N(B∩C) - N(A∩B∩C) = 7-3 = 4
N(A∩C∩B’) = N(A∩C) - N(A∩B∩C) = 5-3 = 2
N(A∩B’∩C’) = N(A) - N(A∩B∩C’) - N(A∩C∩B’) - N(A∩B∩C) = 8 – 1-2-3 = 2
N(B∩C’∩A’) = N(B) - - N(A∩B∩C’)- N(B∩C∩A’) - N(A∩B∩C) = 24-1-4-3 = 16
N(C∩A’∩B’) = N(C) - - N(B∩C∩A’) - N(A∩C∩B’) - N(A∩B∩C) = 10-4-2-3= 1
Also, since the total number of students is 30, hence the sum of all the elements in the Venn
diagram should 30.
Hence, N(A∩B’∩C’) + N(B∩C’∩A’) + N(C∩A’∩B’) + N(A∩B∩C’) + N(B∩C∩A’) +
N(A∩C∩B’) + N(A∩B∩C) + N(A’∩B’∩C’) = 30
2+16+1+1+4+2+3 + N(A’∩B’∩C’) = 30
Document Page
Hence, N(A’∩B’∩C’) = 30 – (2+16+1+1+4+2+3) = 1
Based on the above computations the Venn Diagram is shown below.
Orange denotes the number of students wearing red shirt and blue pants but not black
shoes
Green denotes the number of students wearing red shirt and black shoes but not blue
pants
Blue denotes the number of students wearing blue pants and black shoes but not red shirts
Yellow denotes the number of students wearing red shirt and blue pants and black shoes
n=1 refers to the student who does not wear red shirt or blue pants or black shoes.
chevron_up_icon
1 out of 3
circle_padding
hide_on_mobile
zoom_out_icon
[object Object]