Mathematics Solution: Venn Diagram Analysis of Student Attire

Verified

Added on  2023/05/29

|3
|502
|375
Homework Assignment
AI Summary
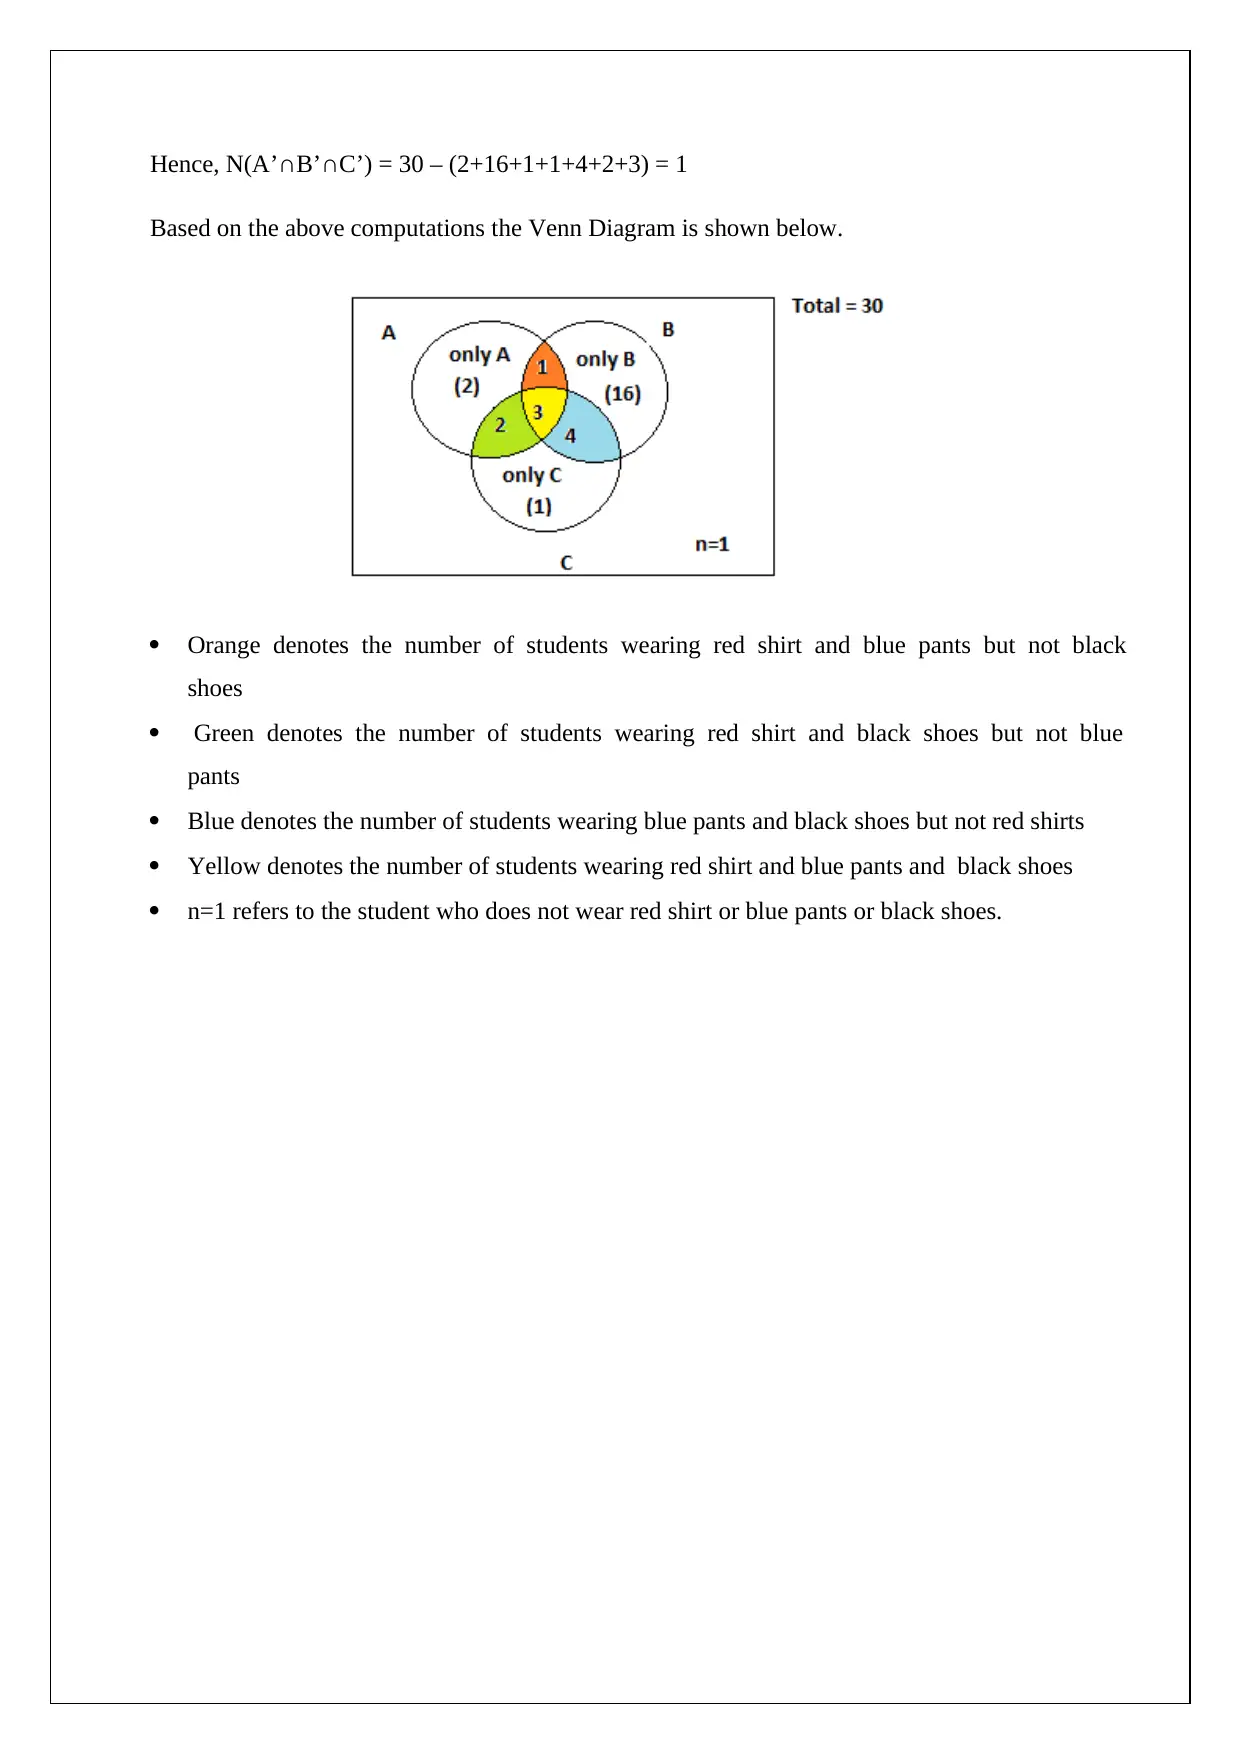
This assignment solution demonstrates the application of Venn diagrams to analyze data related to student attire. The problem involves determining the number of students wearing red shirts, blue pants, and black shoes, with various intersections of these attributes provided. The solution meticulously calculates the number of students in each region of the Venn diagram, including those wearing only certain items and those wearing none of the specified items. By using set theory principles and the given data, the solution constructs a complete Venn diagram, illustrating the distribution of students based on their attire. The final step involves verifying the total number of students to ensure the accuracy of the diagram. This document is available on Desklib, where students can find more solved assignments and study resources.
Document Page
Mathematics
STUDENT Id /name
[Pick the date]
tabler-icon-diamond-filled.svg

Paraphrase This Document

Need a fresh take? Get an instant paraphrase of this document with our AI Paraphraser
Document Page
Let event A highlight the number of students wearing red shirt
Let event B highlight the number of students wearing blue pants
Let event C highlight the number of students wearing black shoes
The following data has been provided to facilitate creation of the Venn Diagram for the given
situation.
N(A) = 8 (i.e. number of elements belonging to set A is 8)
N(B) = 24
N(C) = 10
N(A∩B∩C) = 3
N(A∩B) = 4
N(B∩C) = 7
N(A∩C) = 5
Based on the given information, the following computation may be performed.
N(A∩B∩C’) = N(A∩B) - N(A∩B∩C) = 4-3 = 1
N(B∩C∩A’) = N(B∩C) - N(A∩B∩C) = 7-3 = 4
N(A∩C∩B’) = N(A∩C) - N(A∩B∩C) = 5-3 = 2
N(A∩B’∩C’) = N(A) - N(A∩B∩C’) - N(A∩C∩B’) - N(A∩B∩C) = 8 – 1-2-3 = 2
N(B∩C’∩A’) = N(B) - - N(A∩B∩C’)- N(B∩C∩A’) - N(A∩B∩C) = 24-1-4-3 = 16
N(C∩A’∩B’) = N(C) - - N(B∩C∩A’) - N(A∩C∩B’) - N(A∩B∩C) = 10-4-2-3= 1
Also, since the total number of students is 30, hence the sum of all the elements in the Venn
diagram should 30.
Hence, N(A∩B’∩C’) + N(B∩C’∩A’) + N(C∩A’∩B’) + N(A∩B∩C’) + N(B∩C∩A’) +
N(A∩C∩B’) + N(A∩B∩C) + N(A’∩B’∩C’) = 30
2+16+1+1+4+2+3 + N(A’∩B’∩C’) = 30
Document Page
Hence, N(A’∩B’∩C’) = 30 – (2+16+1+1+4+2+3) = 1
Based on the above computations the Venn Diagram is shown below.
Orange denotes the number of students wearing red shirt and blue pants but not black
shoes
Green denotes the number of students wearing red shirt and black shoes but not blue
pants
Blue denotes the number of students wearing blue pants and black shoes but not red shirts
Yellow denotes the number of students wearing red shirt and blue pants and black shoes
n=1 refers to the student who does not wear red shirt or blue pants or black shoes.
chevron_up_icon
1 out of 3
circle_padding
hide_on_mobile
zoom_out_icon
[object Object]