Weka Assignment: Data Exploration and Visualization Techniques
VerifiedAdded on 2022/09/17
|11
|517
|35
Practical Assignment
AI Summary
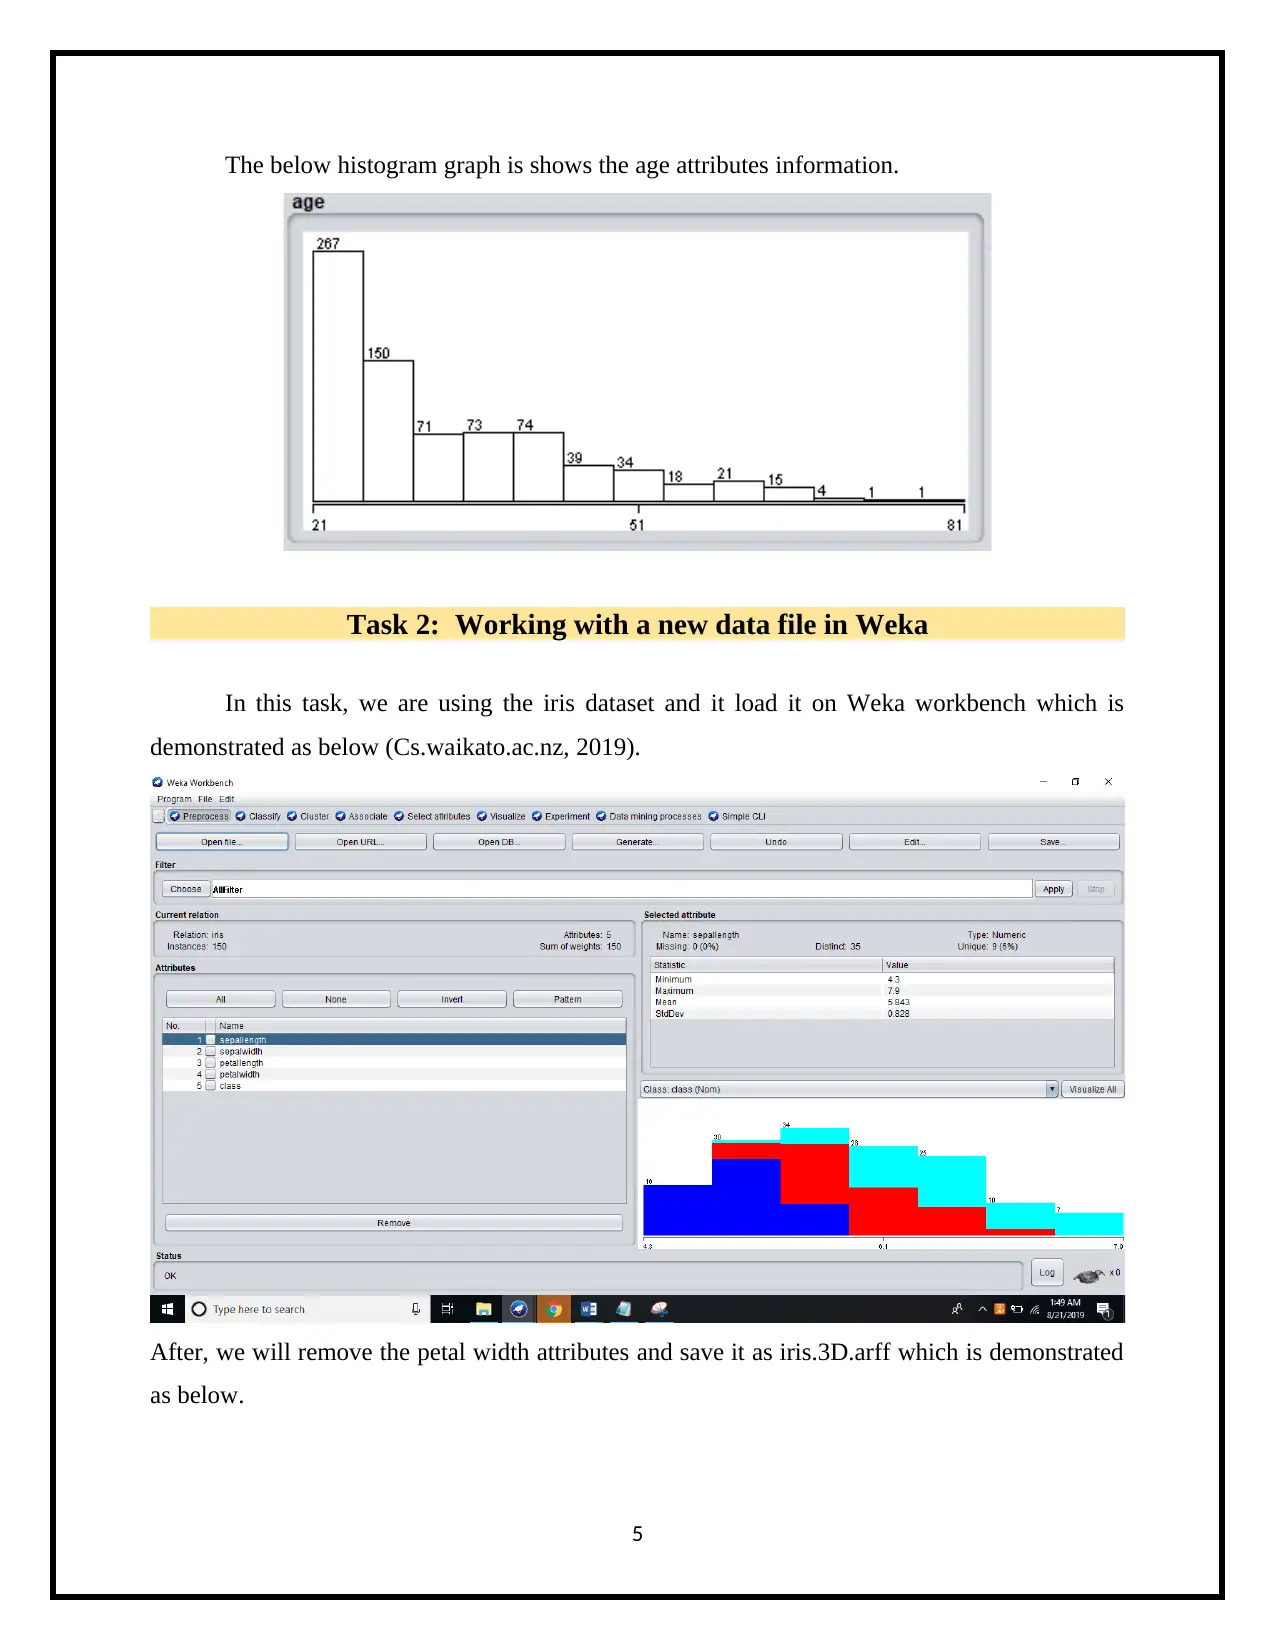
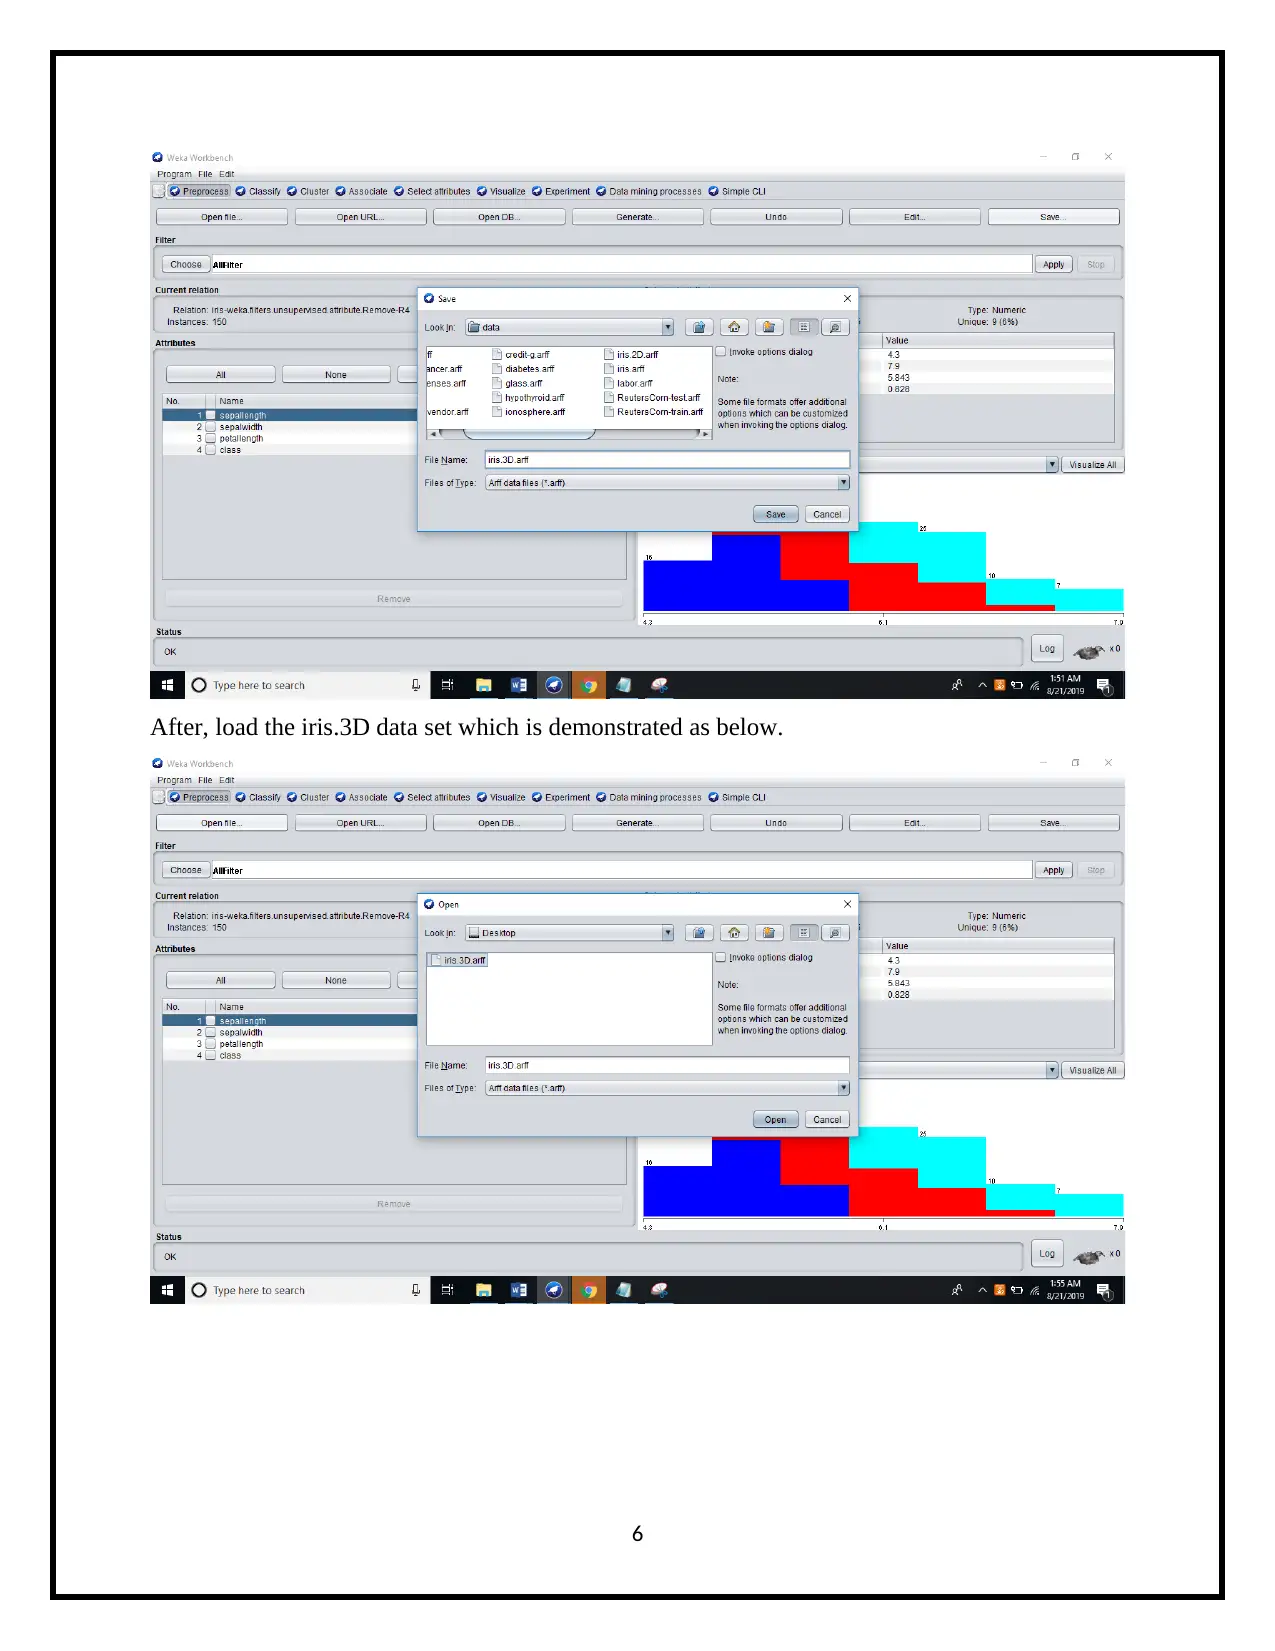
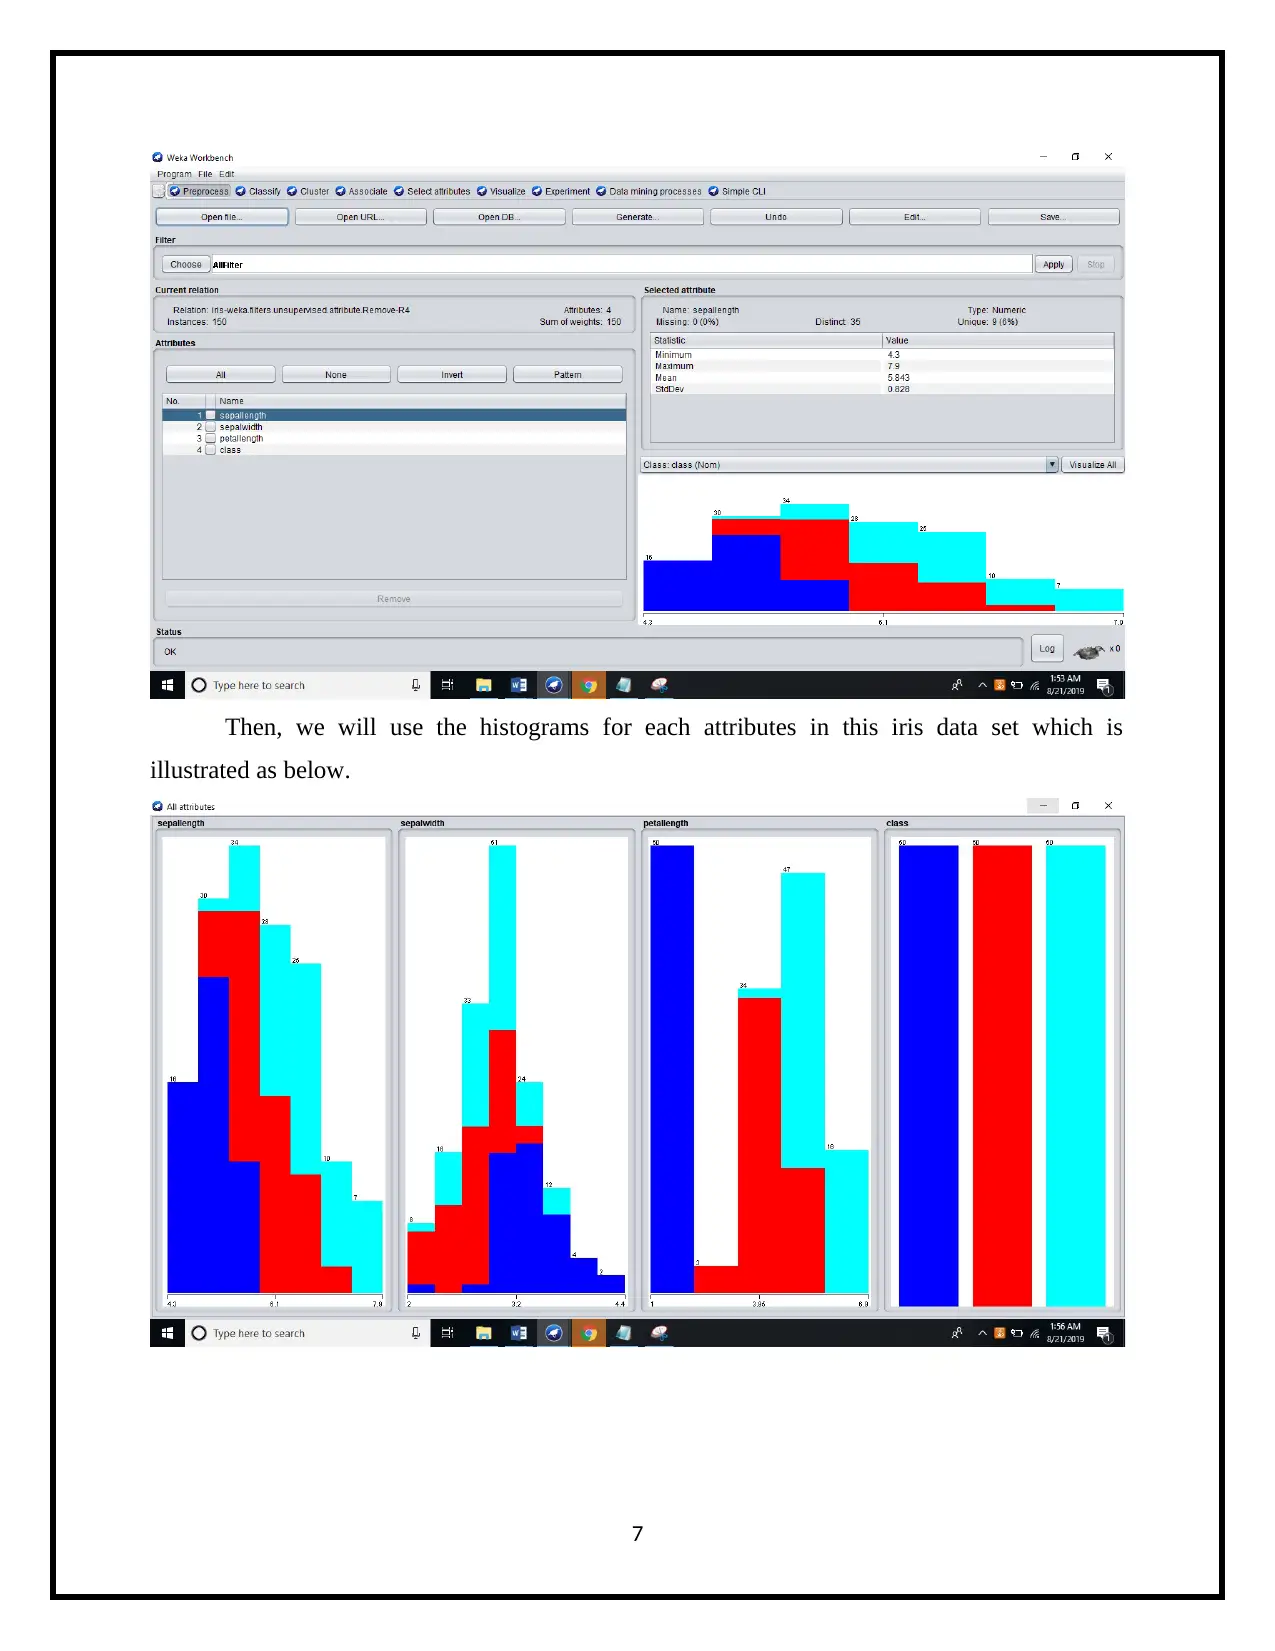
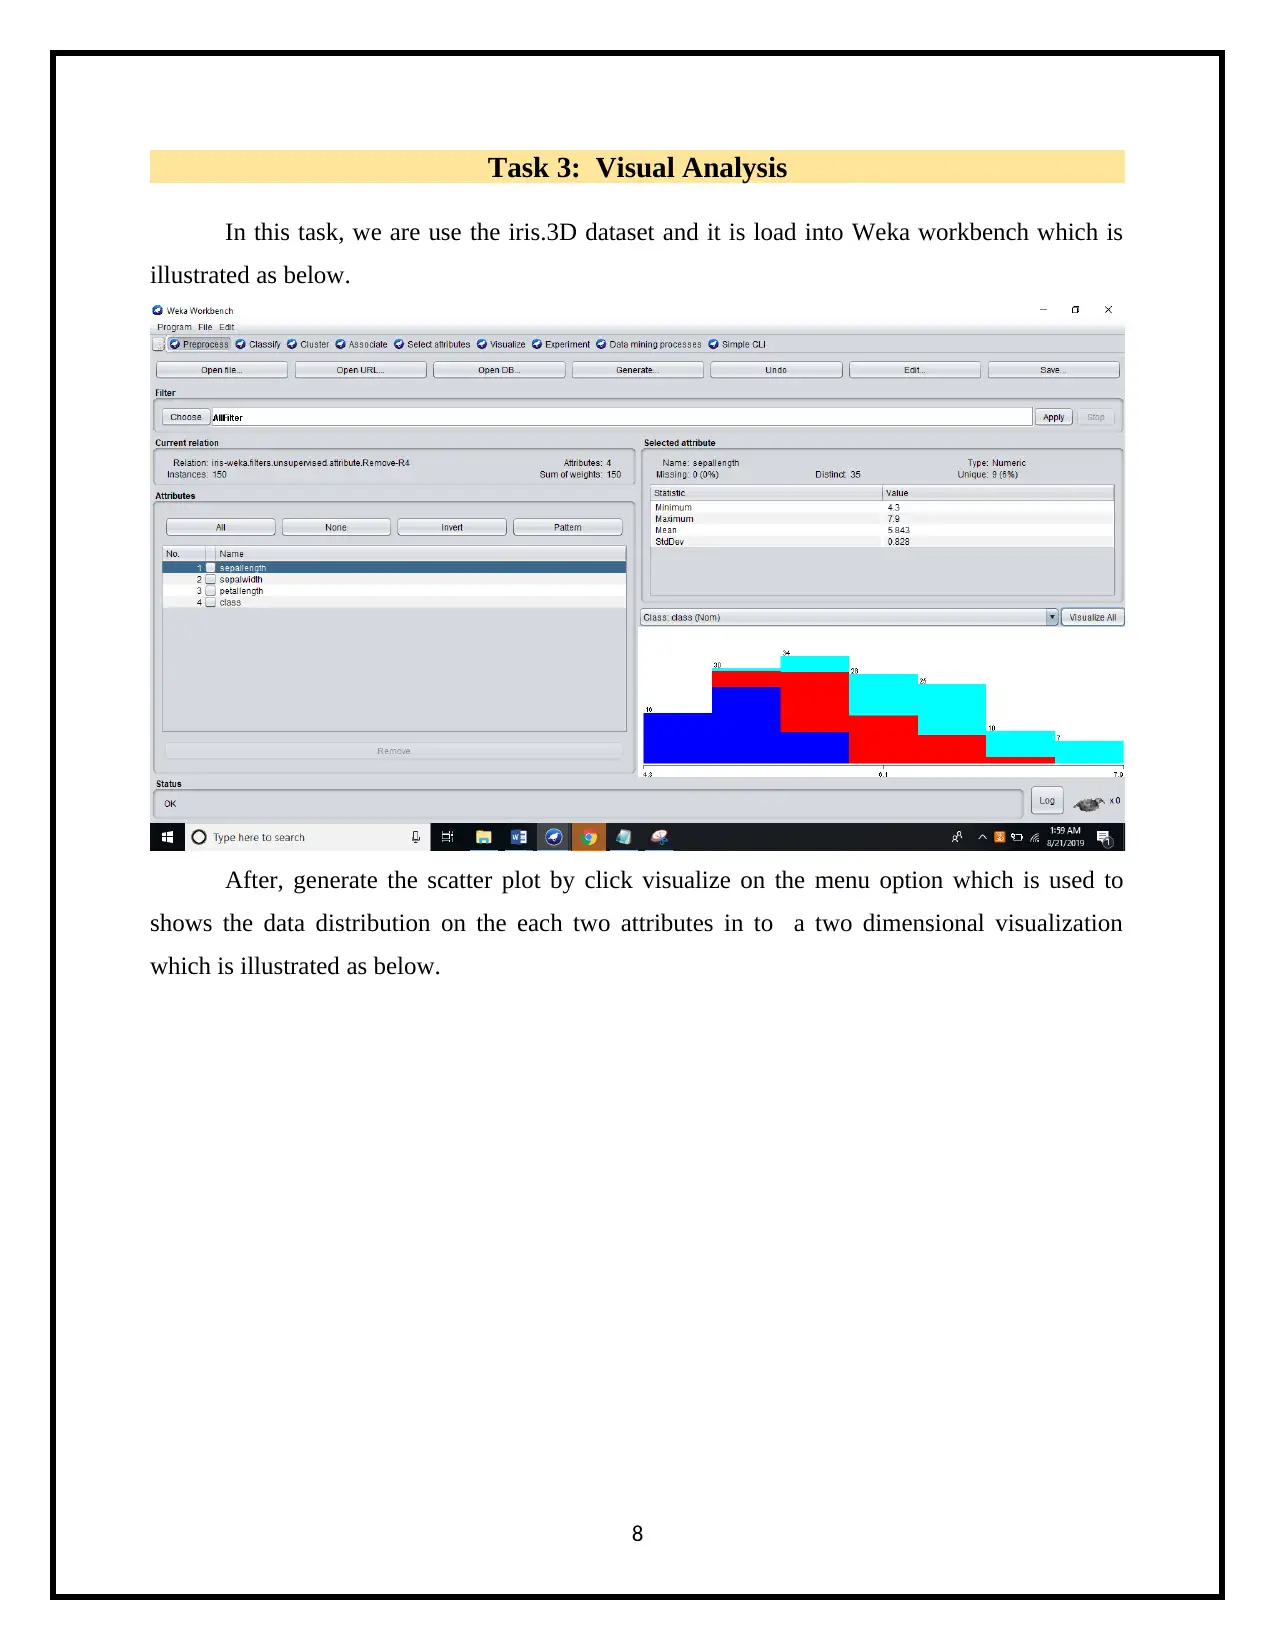
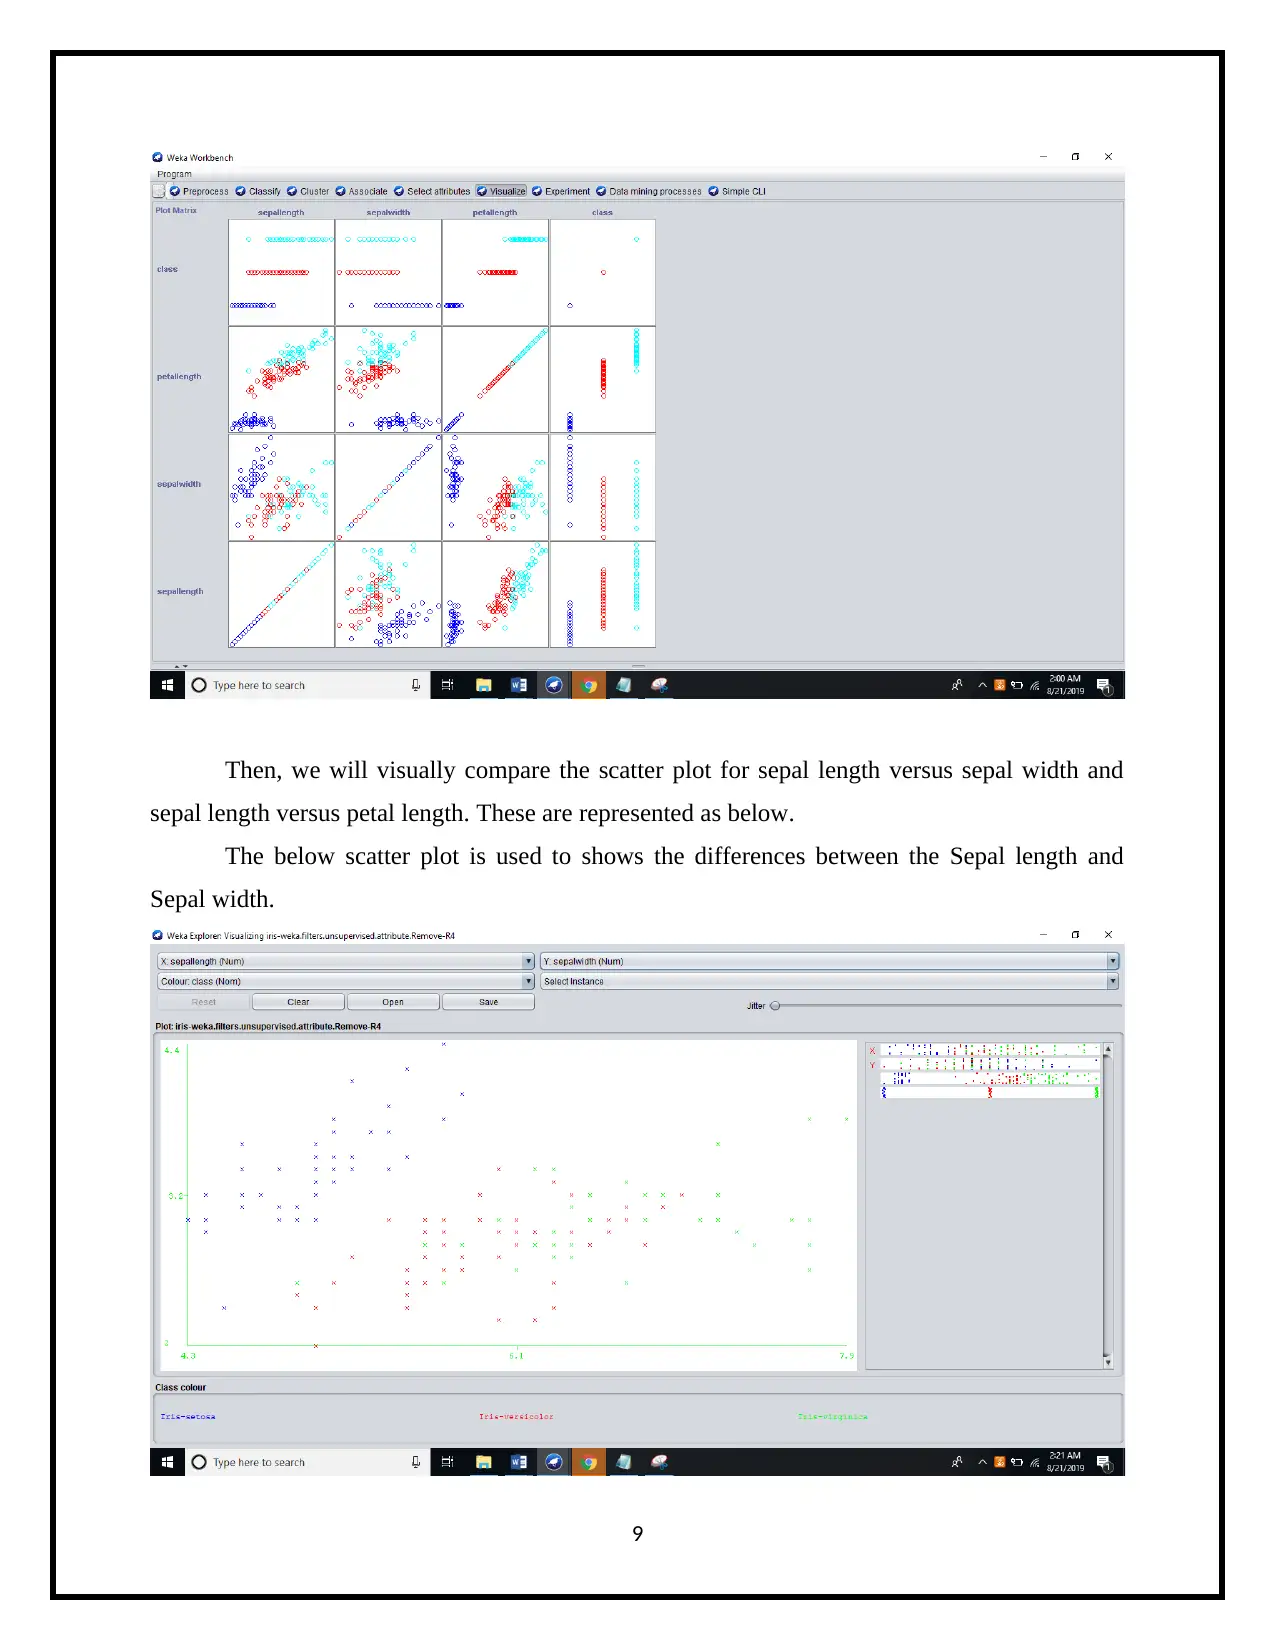
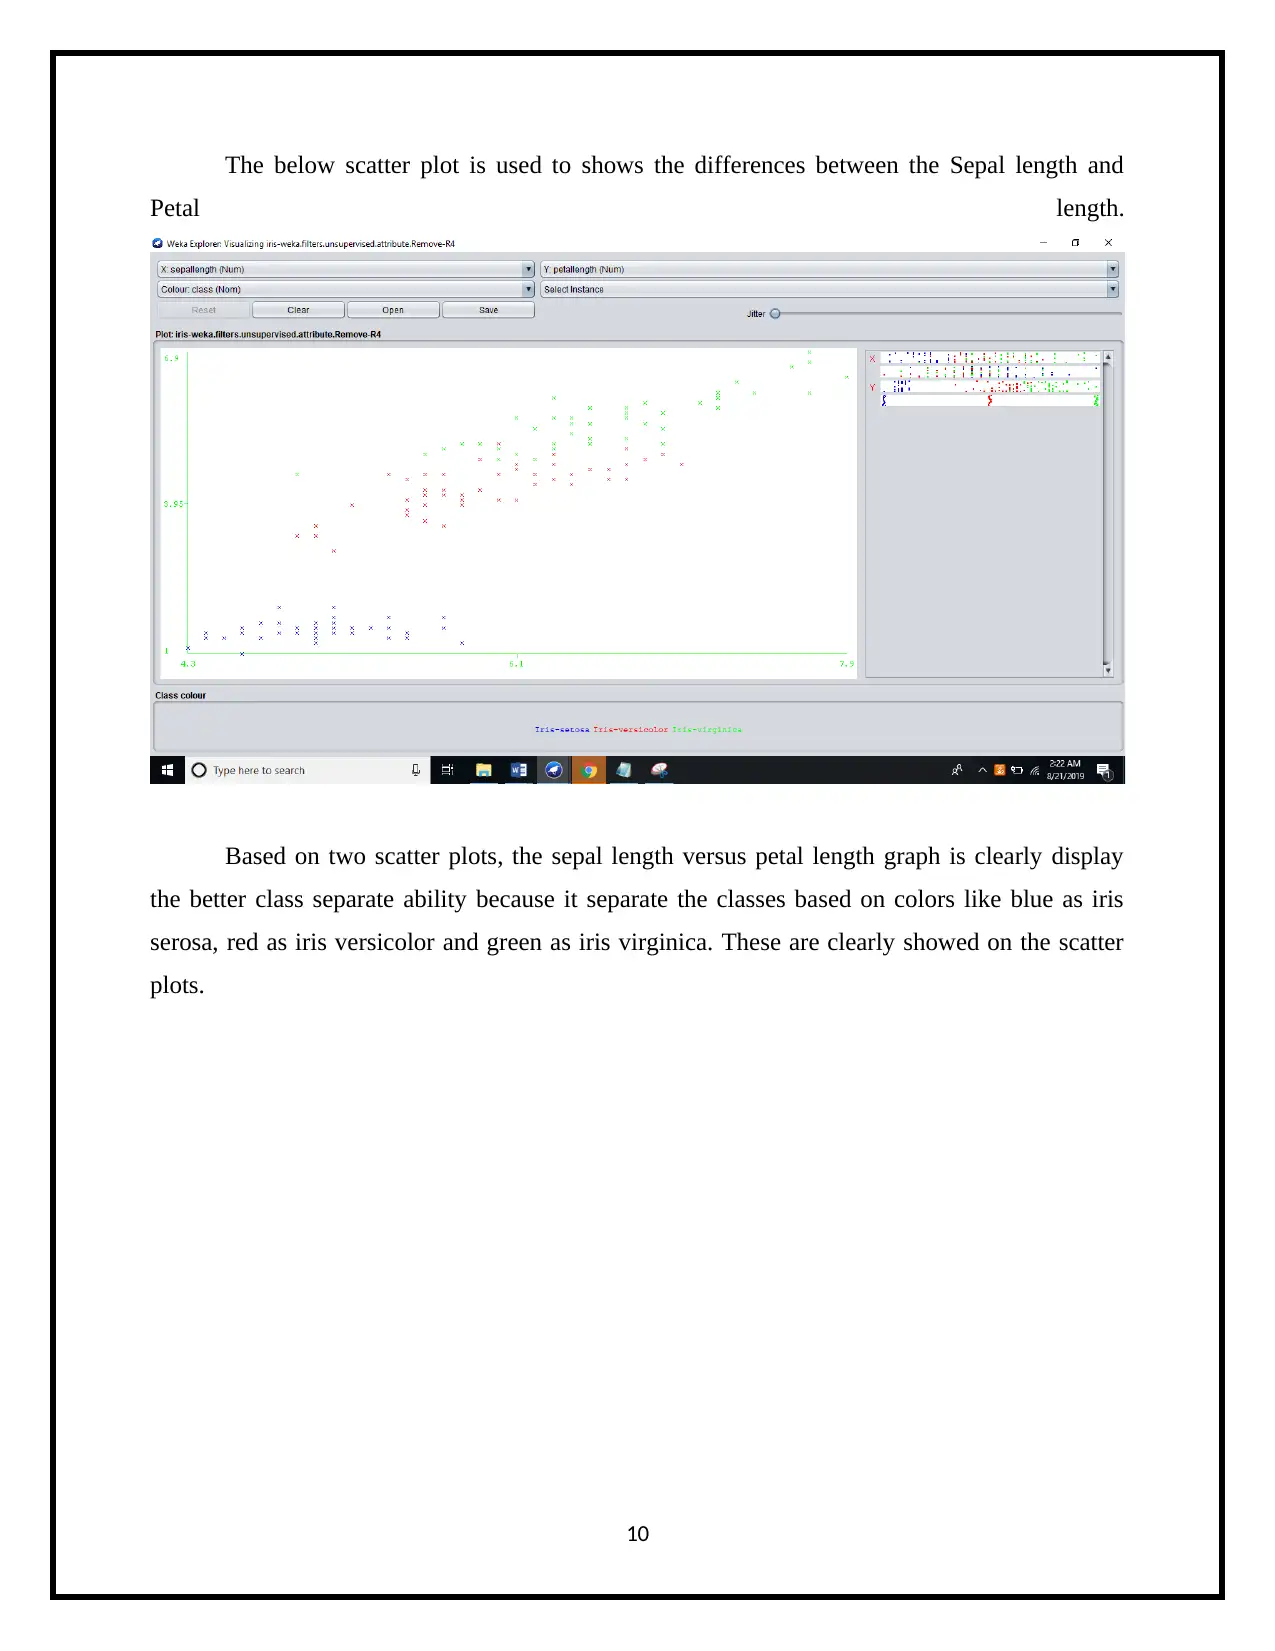
This assignment solution demonstrates data exploration and analysis using the Weka workbench. It begins by loading and analyzing the diabetes dataset, determining the number of instances, attributes, and classes, and uses histograms to visualize age group distributions. The solution then involves creating a new .arff file from the iris dataset, removing the 'petal_width' attribute, and exploring the modified dataset. Histograms are generated for each attribute of the iris dataset. Finally, the solution performs visual analysis using scatter plots to compare the distributions of sepal length versus sepal width and sepal length versus petal length, highlighting the class separation capabilities of the scatter plots.
1 out of 11