Visualization and Statistical Analysis of Real World Dataset
Added on 2022-12-22
23 Pages2931 Words1 Views
Visualization and statistical analysis of a real world dataset

EXECUTIVE SUMMARY
In accordance of project report this can be summarized that data set has been taken of 80
different houses including various kinds of characteristics like price, type of house and many
more. The objective of project report is to do detailed analysis on housing market in post code
B17 United Kingdom. This analysis has been done by a research company which acts as an
estate agency. The report also abstracts about various kinds of visualization models, descriptive
statistical analysis etc.
Contents
EXECUTIVE SUMMARY.........................................................................................................................2
MAIN BODY..............................................................................................................................................4
REFERENCES..........................................................................................................................................20

MAIN BODY
1. A description of the problem, the source of your data.
Description of problem- The problem in such data set is related to finding different aspect
of houses which need to consider like number of bedrooms, bathrooms and many more.
In addition to this, it was quite difficult to assess a reliable source through which data can
be gathered in an effective manner.
Source of data- The data has been taken from an appropriate website which is
rightmove.com. This site is known to gather data related to real state including various
kinds of aspects.
Sampling method: Random sampling is a method where the likelihood of being selected
is proportional to each sample. A randomly selected sample is intended to reflect the
entire population unequivocally (Chambers, 2018). If the survey does not constitute the
populace for any purposes, the difference is known as random errors. Random sample
gathering information about a population is one of the easiest types. Each representative
of the subset has an equal chance of being chosen as part of the testing phase under
random selection.
2. Produce at least three visualization methods.
The graphical interface of facts and statistics is the data visualization. Data analysis
applications provide better terms to see and interpret trends, outlines and trends of data
by using graphic elements such as tables, diagrams and charts (Schabenberger and
Gotway, 2017).
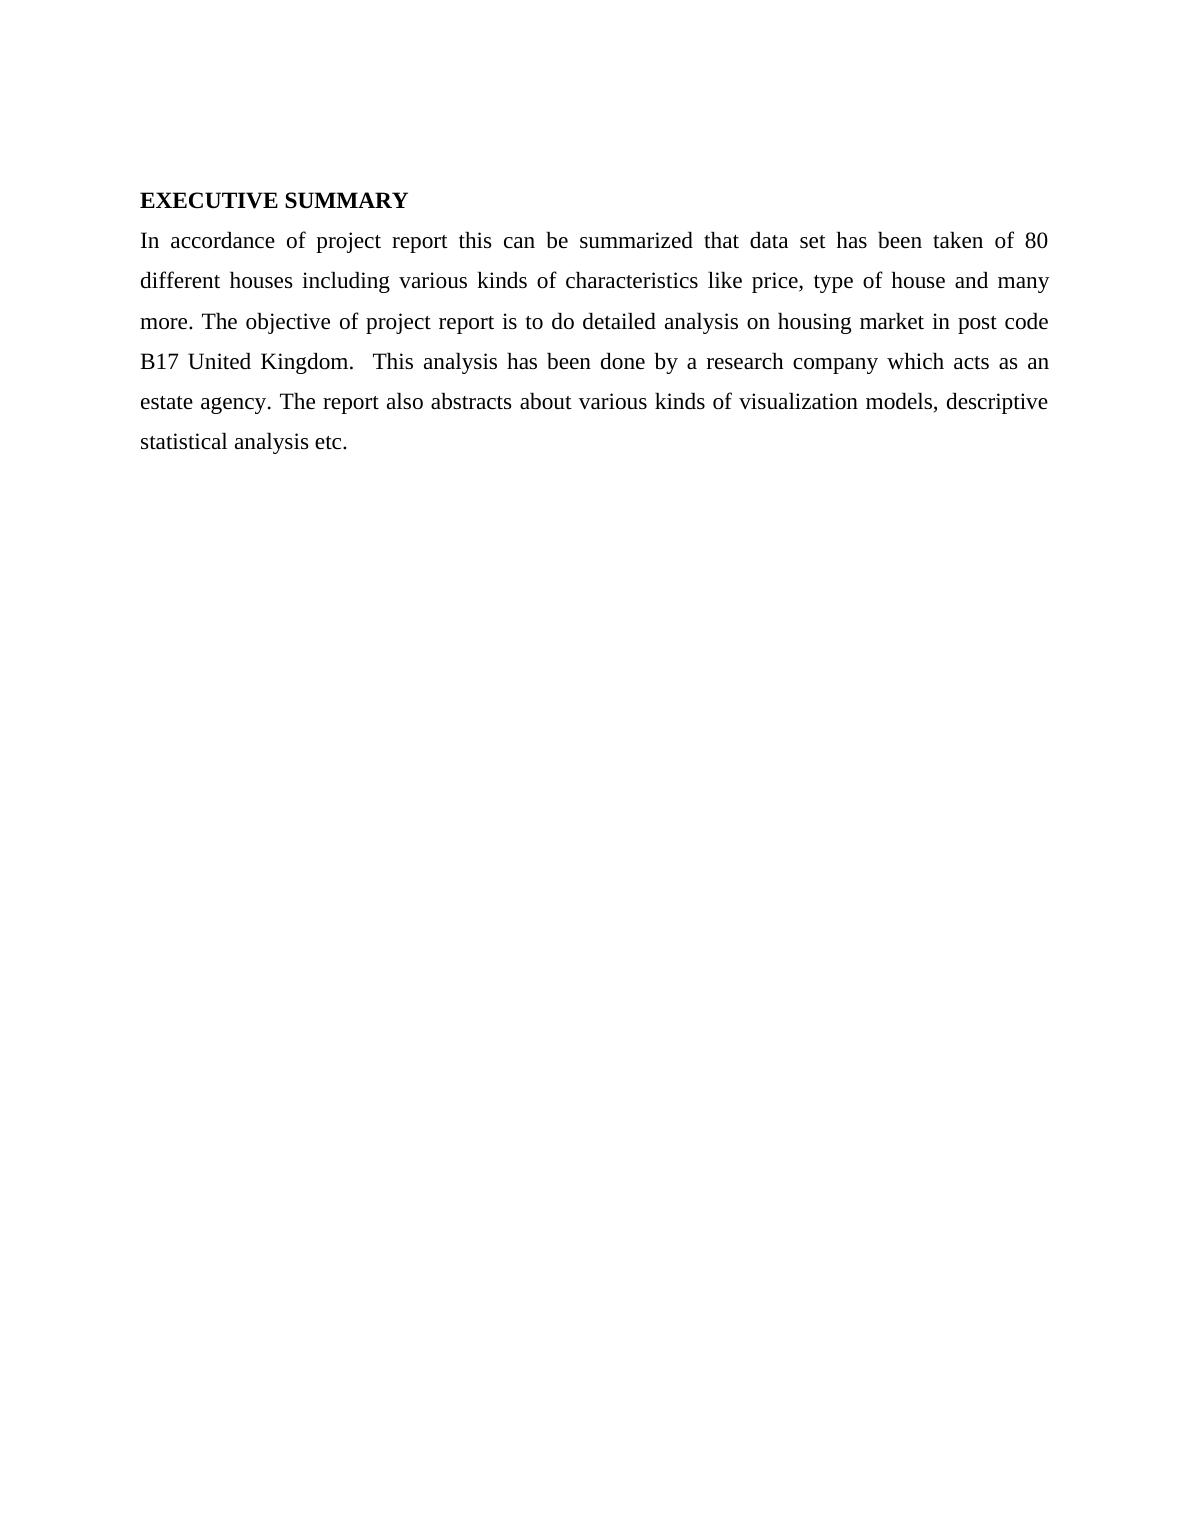
Scatter chart- A scatter plot is a plot form or statistical diagram, which displays values for
two variables usually for a data set by using linear combinations. A more vector can be
shown if the points are coded.
1. A description of the problem, the source of your data.
Description of problem- The problem in such data set is related to finding different aspect
of houses which need to consider like number of bedrooms, bathrooms and many more.
In addition to this, it was quite difficult to assess a reliable source through which data can
be gathered in an effective manner.
Source of data- The data has been taken from an appropriate website which is
rightmove.com. This site is known to gather data related to real state including various
kinds of aspects.
Sampling method: Random sampling is a method where the likelihood of being selected
is proportional to each sample. A randomly selected sample is intended to reflect the
entire population unequivocally (Chambers, 2018). If the survey does not constitute the
populace for any purposes, the difference is known as random errors. Random sample
gathering information about a population is one of the easiest types. Each representative
of the subset has an equal chance of being chosen as part of the testing phase under
random selection.
2. Produce at least three visualization methods.
The graphical interface of facts and statistics is the data visualization. Data analysis
applications provide better terms to see and interpret trends, outlines and trends of data
by using graphic elements such as tables, diagrams and charts (Schabenberger and
Gotway, 2017).
Scatter chart- A scatter plot is a plot form or statistical diagram, which displays values for
two variables usually for a data set by using linear combinations. A more vector can be
shown if the points are coded.
0 1 2 3 4 5 6 7 8 9 10
0
2
4
6
8
10
12
Scatter chart
Series2 Bedroom
Washroom Distance from railway station
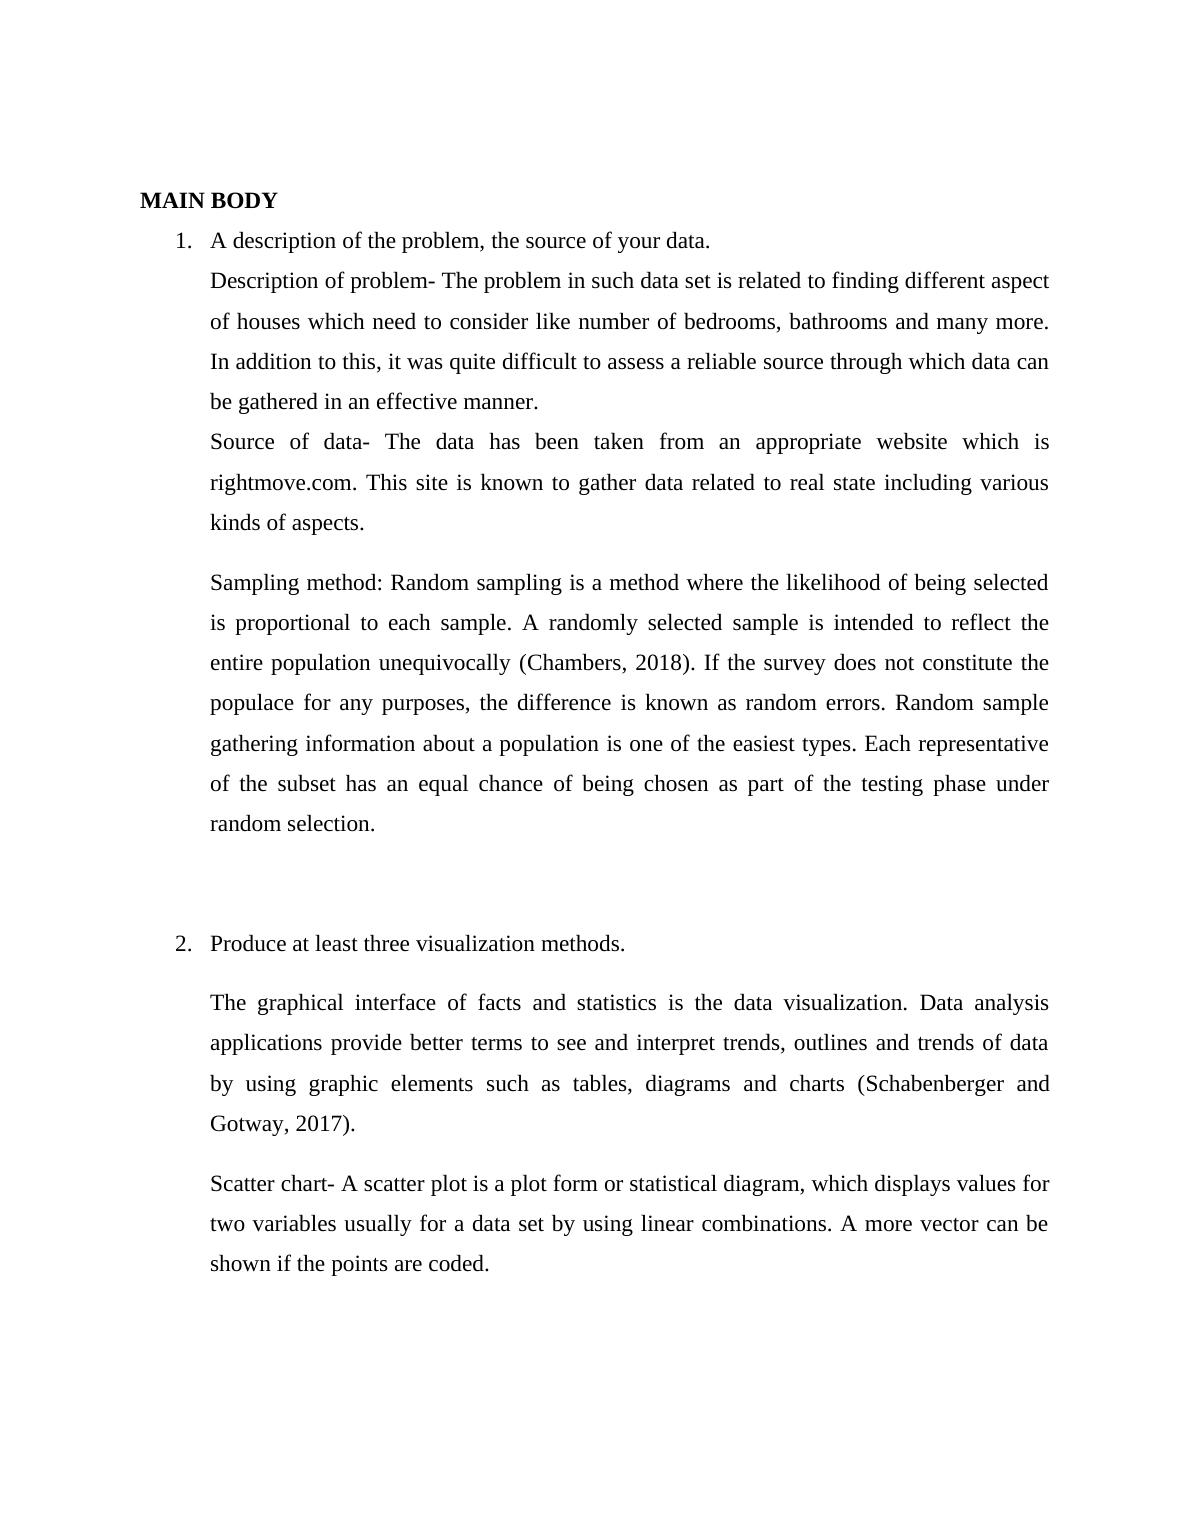
Line chart- A diagram is a type of diagram used to denote time-changing details. We
draw line diagrams using multiple point lines connected. We call it a map of the rows, too
(Miles, Huberman and Saldaña, 2018). The line diagram consists of 2 axes, the axis "x"
and the axis "y." The x-axis is defined as the lateral axis.
End
terrace Semi
detached Detached Semi
detached Semi
detached Semi
detached End
terrace Semi
detached Terraced
0
2
4
6
8
10
12
Line chart
Series1 Bedroom
Washroom Distance from railway station
Pie chart- A pie diagram is a circle graphic that is separated into divides to show a
quantity. The phase margin of each piece of a pie map is equal to the amount of the pie.
0
2
4
6
8
10
12
Scatter chart
Series2 Bedroom
Washroom Distance from railway station
Line chart- A diagram is a type of diagram used to denote time-changing details. We
draw line diagrams using multiple point lines connected. We call it a map of the rows, too
(Miles, Huberman and Saldaña, 2018). The line diagram consists of 2 axes, the axis "x"
and the axis "y." The x-axis is defined as the lateral axis.
End
terrace Semi
detached Detached Semi
detached Semi
detached Semi
detached End
terrace Semi
detached Terraced
0
2
4
6
8
10
12
Line chart
Series1 Bedroom
Washroom Distance from railway station
Pie chart- A pie diagram is a circle graphic that is separated into divides to show a
quantity. The phase margin of each piece of a pie map is equal to the amount of the pie.
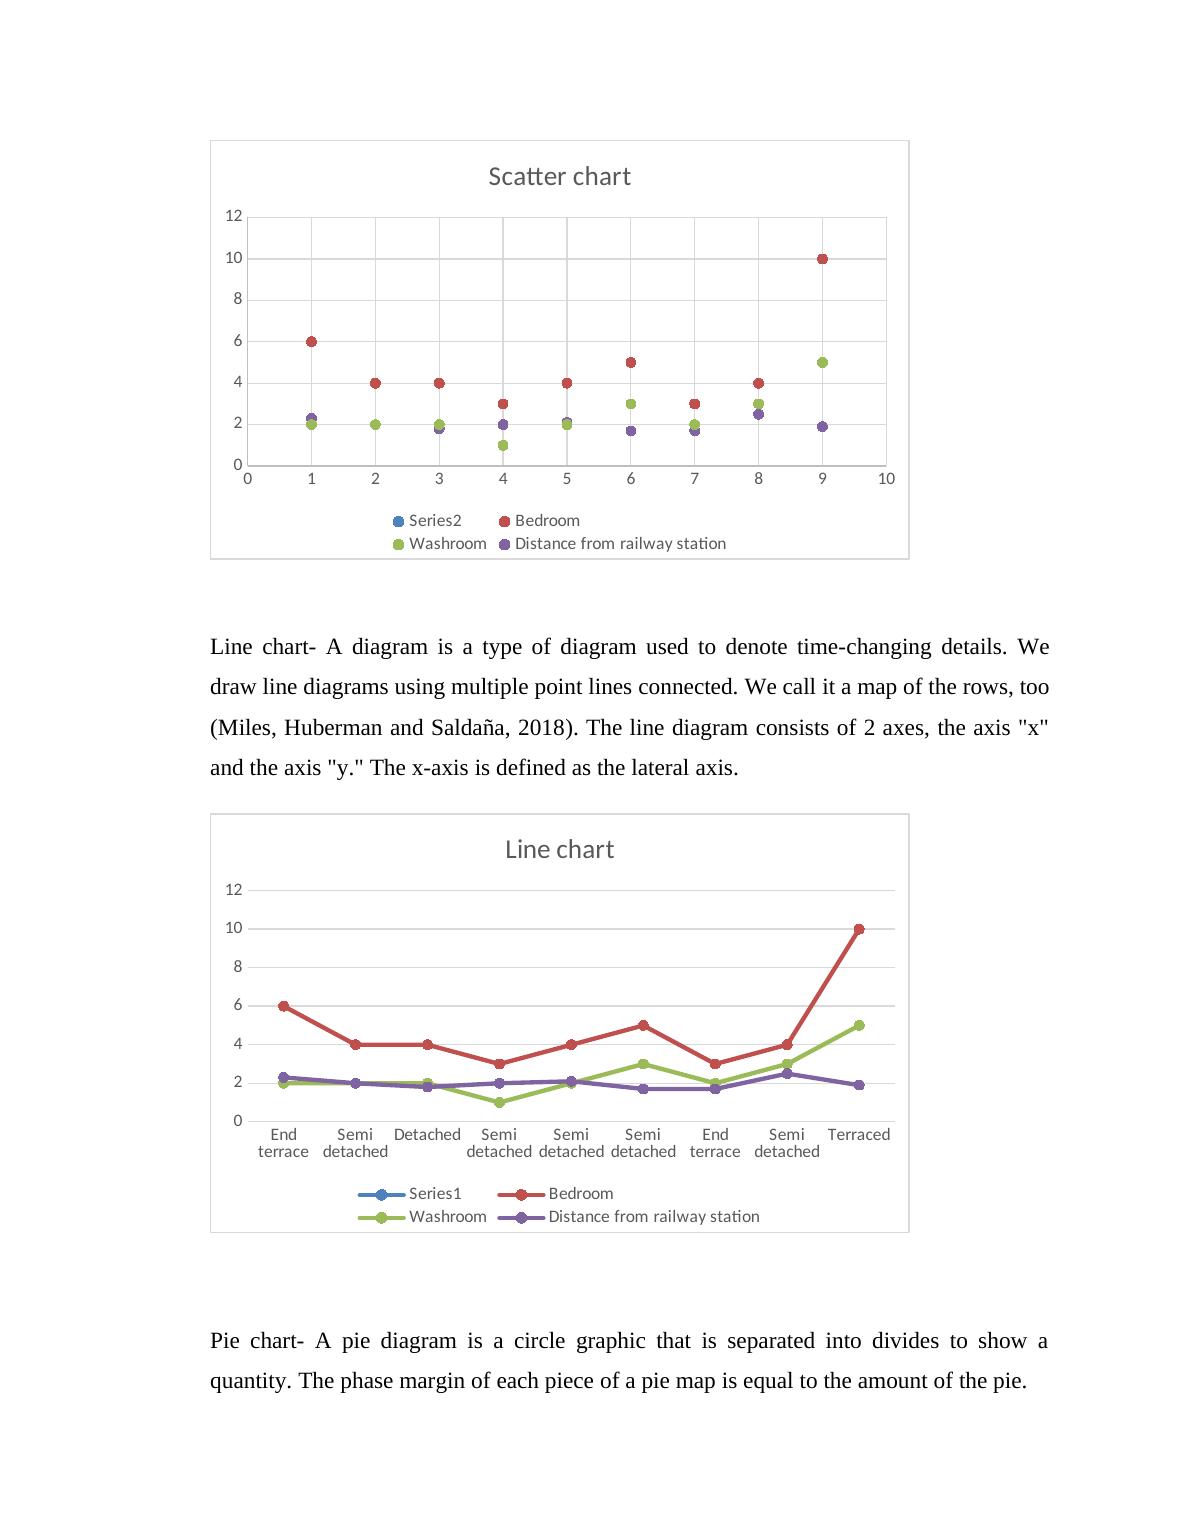
Pie chart
End terrace Semi detached Detached Semi detached Semi detached
Semi detached End terrace Semi detached Terraced
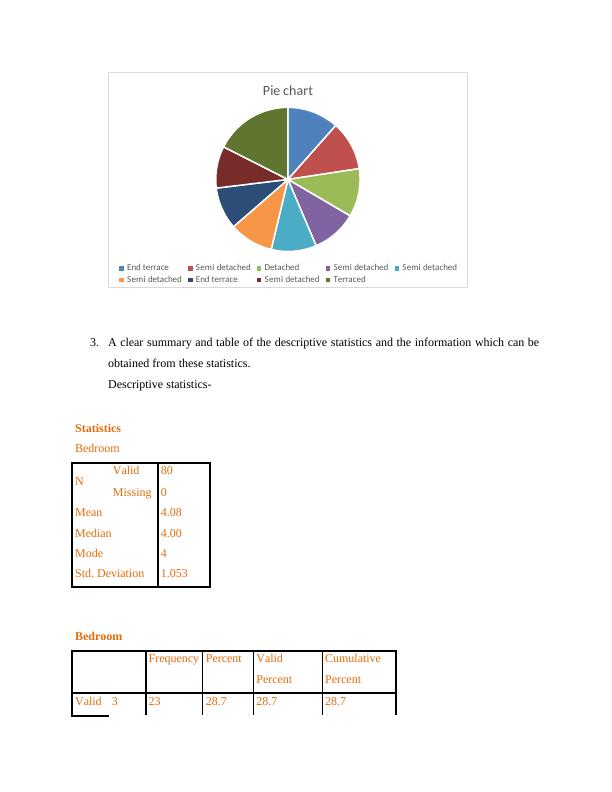
3. A clear summary and table of the descriptive statistics and the information which can be
obtained from these statistics.
Descriptive statistics-
Statistics
Bedroom
N Valid 80
Missing 0
Mean 4.08
Median 4.00
Mode 4
Std. Deviation 1.053
Bedroom
Frequency Percent Valid
Percent
Cumulative
Percent
Valid 3 23 28.7 28.7 28.7
End terrace Semi detached Detached Semi detached Semi detached
Semi detached End terrace Semi detached Terraced
3. A clear summary and table of the descriptive statistics and the information which can be
obtained from these statistics.
Descriptive statistics-
Statistics
Bedroom
N Valid 80
Missing 0
Mean 4.08
Median 4.00
Mode 4
Std. Deviation 1.053
Bedroom
Frequency Percent Valid
Percent
Cumulative
Percent
Valid 3 23 28.7 28.7 28.7
End of preview
Want to access all the pages? Upload your documents or become a member.
Related Documents
Visualization and Statistical Analysis of Real World Datasetlg...
|21
|2996
|37
Applied Statistics on letting of property in Nottingham, UKlg...
|16
|1455
|21
Statistics for Management - Doclg...
|20
|3814
|22
BU1007 - Data Analysis - Individual Reportlg...
|18
|1606
|65
Numeracy and Data Analysis - Doclg...
|8
|1389
|321
Case Study of Business Decision Makinglg...
|21
|4358
|46