Data Science: Visualizing Insurance Fraud Claim Data in R

Verified

Added on  2022/08/20

|4
|430
|16
Homework Assignment
AI Summary
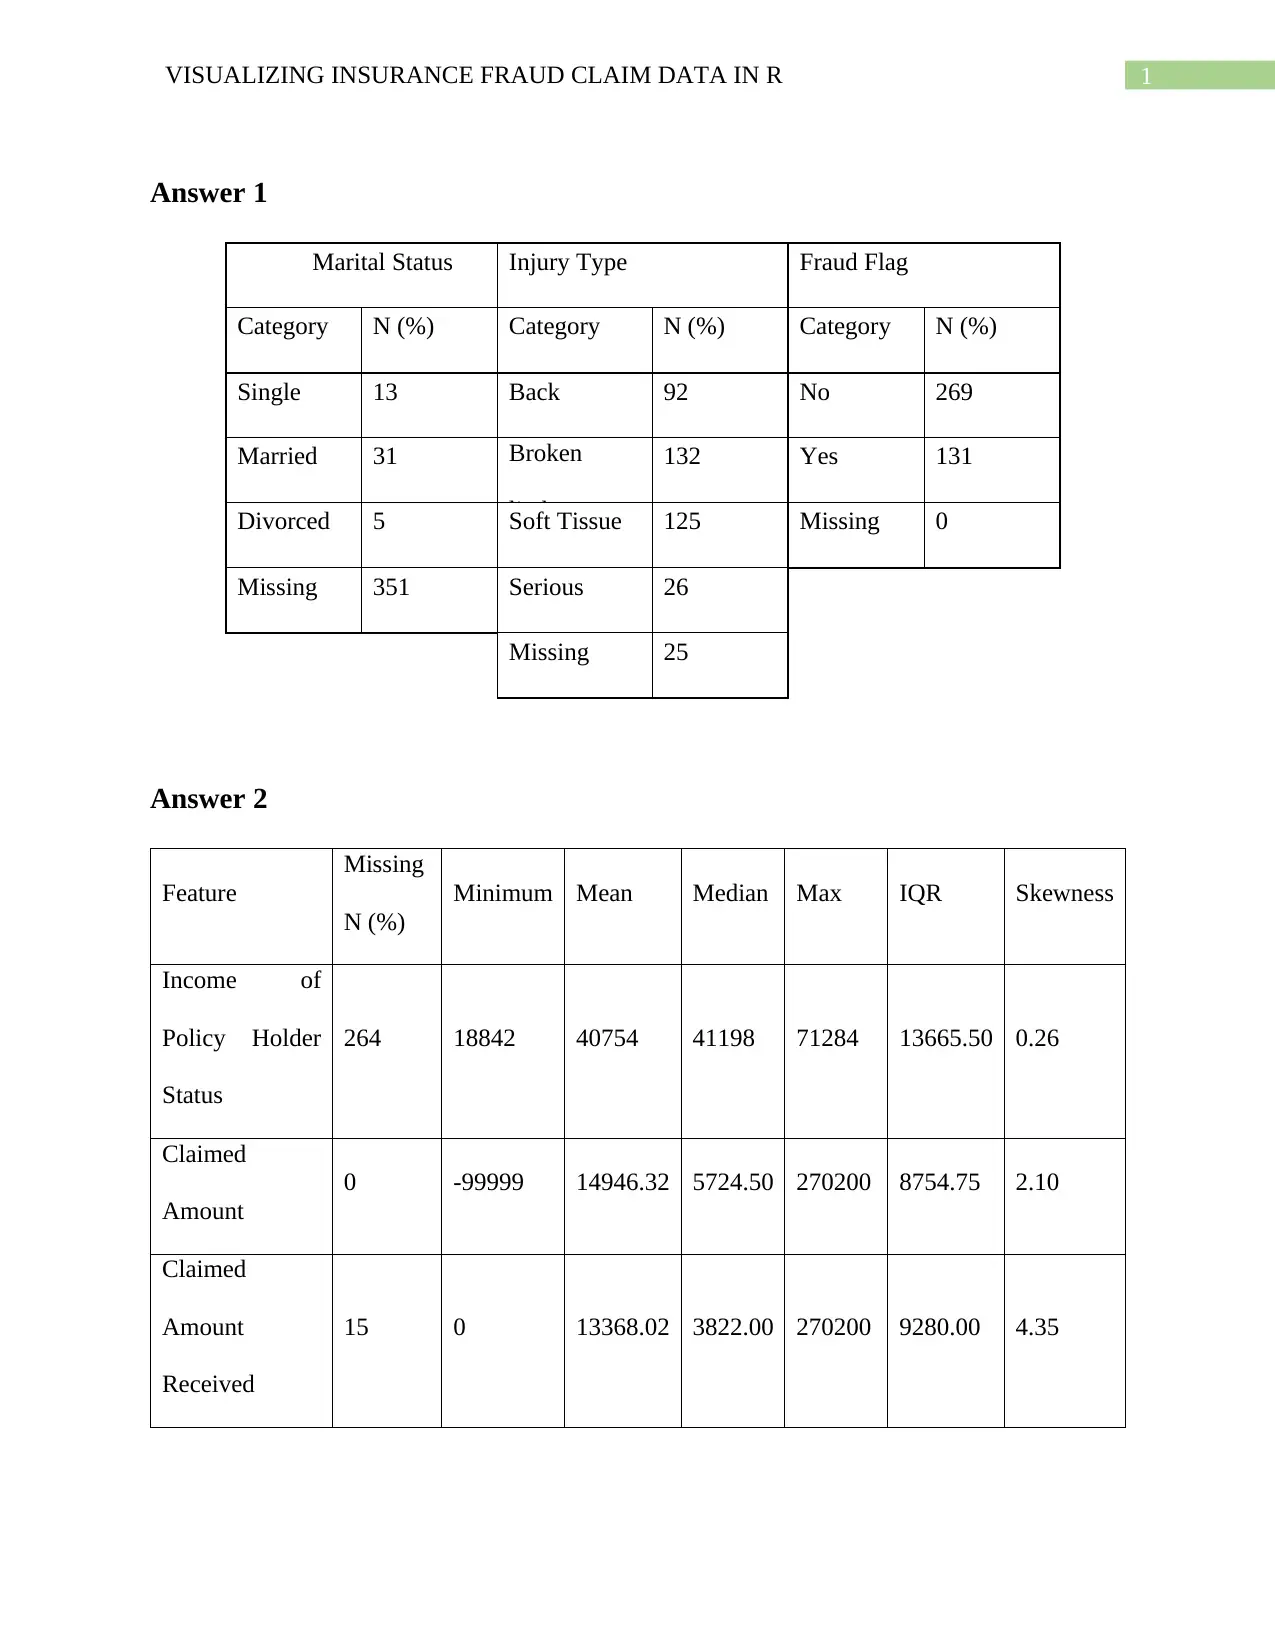
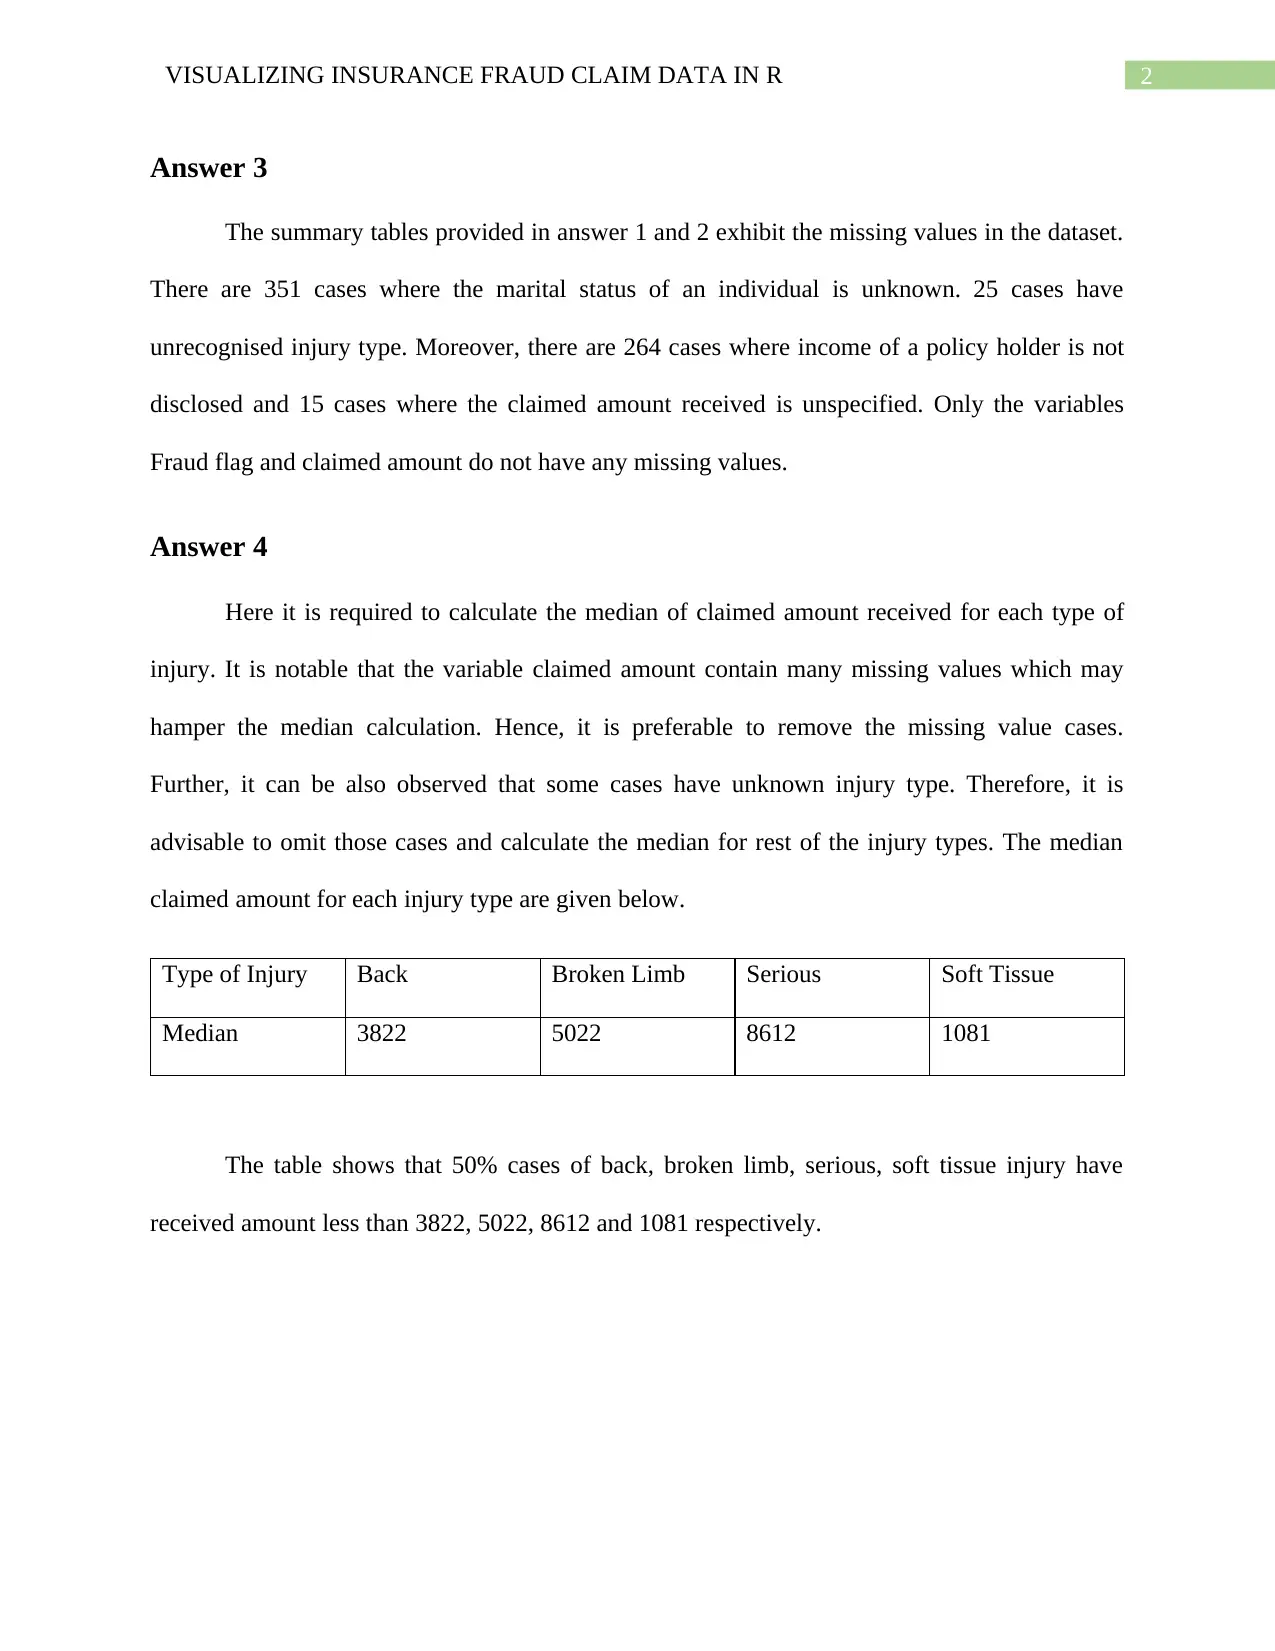
This assignment involves analyzing insurance fraud claim data using the R programming language. The task includes importing a dataset, creating a sub-sample based on a student ID, and completing a table for categorical features such as marital status, injury type, and fraud flag. The analysis also requires calculating and interpreting descriptive statistics, including missing values, minimum, mean, median, maximum, interquartile range, and skewness for variables like income and claimed amounts. Furthermore, the assignment involves calculating the median of the claimed amount received for each injury type, addressing missing data, and providing a comprehensive statistical analysis of the insurance claim dataset.
Document Page
Running Head: VISUALIZING INSURANCE FRAUD CLAIM DATA IN R
VISUALIZING INSURANCE FRAUD CLAIM DATA IN R
Name of the Student:
Name of the University:
Author Note:
tabler-icon-diamond-filled.svg

Paraphrase This Document

Need a fresh take? Get an instant paraphrase of this document with our AI Paraphraser
Document Page
1VISUALIZING INSURANCE FRAUD CLAIM DATA IN R
Answer 1
Marital Status Injury Type Fraud Flag
Category N (%) Category N (%) Category N (%)
Single 13 Back 92 No 269
Married 31 Broken
limbs
132 Yes 131
Divorced 5 Soft Tissue 125 Missing 0
Missing 351 Serious 26
Missing 25
Answer 2
Feature
Missing
N (%)
Minimum Mean Median Max IQR Skewness
Income of
Policy Holder
Status
264 18842 40754 41198 71284 13665.50 0.26
Claimed
Amount
0 -99999 14946.32 5724.50 270200 8754.75 2.10
Claimed
Amount
Received
15 0 13368.02 3822.00 270200 9280.00 4.35
Document Page
2VISUALIZING INSURANCE FRAUD CLAIM DATA IN R
Answer 3
The summary tables provided in answer 1 and 2 exhibit the missing values in the dataset.
There are 351 cases where the marital status of an individual is unknown. 25 cases have
unrecognised injury type. Moreover, there are 264 cases where income of a policy holder is not
disclosed and 15 cases where the claimed amount received is unspecified. Only the variables
Fraud flag and claimed amount do not have any missing values.
Answer 4
Here it is required to calculate the median of claimed amount received for each type of
injury. It is notable that the variable claimed amount contain many missing values which may
hamper the median calculation. Hence, it is preferable to remove the missing value cases.
Further, it can be also observed that some cases have unknown injury type. Therefore, it is
advisable to omit those cases and calculate the median for rest of the injury types. The median
claimed amount for each injury type are given below.
Type of Injury Back Broken Limb Serious Soft Tissue
Median 3822 5022 8612 1081
The table shows that 50% cases of back, broken limb, serious, soft tissue injury have
received amount less than 3822, 5022, 8612 and 1081 respectively.
Document Page
3VISUALIZING INSURANCE FRAUD CLAIM DATA IN R
Bibliography
Navarro, D. (2015). Learning statistics with R. Lulu. com.
Plonsky, L. (2015). Statistical power, p values, descriptive statistics, and effect sizes: A “back-
to-basics” approach to advancing quantitative methods in L2 research. In Advancing quantitative
methods in second language research (pp. 23-45). Routledge.
chevron_up_icon
1 out of 4
circle_padding
hide_on_mobile
zoom_out_icon
[object Object]