Water Management: Statistical Analysis and Coastal Engineering Report
VerifiedAdded on 2023/01/12
|10
|1242
|21
Report
AI Summary
This report delves into various aspects of water management, encompassing statistical techniques for river discharge analysis, coastal defense strategies, and the effects of changes in mean sea level. The report begins with an examination of empirical frequency distributions, time-series analysis, and series homogeneity tests, highlighting their limitations in flood risk management. It then explores different types of natural and artificial coastal defense schemes, such as managed retreat, hold the line techniques, and dune stabilization, evaluating their suitability for different coastal environments. Furthermore, the report investigates the likely effects of changes in mean sea level on coastal engineering design, emphasizing the increasing risk of floods and the need for more precautionary measures. The report includes an analysis of annual flood peak values using the Grigorten’s plotting position formula and flood frequency graphs, employing Gumbel extreme methods to estimate flood magnitude for various return periods. The findings are crucial for economic design in hydraulic structures and for formulating strategies to prevent property damage and protect lives. The report is contributed by a student and is available on Desklib, a platform offering AI-based study tools and resources for students.
Water management
Paraphrase This Document
Need a fresh take? Get an instant paraphrase of this document with our AI Paraphraser
Contents
Contents...........................................................................................................................................2
MAIN BODY..................................................................................................................................1
Q1. (a) Various statistical techniques useful in river discharge analysis with limitations in
reference to flood risk management............................................................................................1
Q2. (a) Types of natural and artificial coastal defence schemes with suitability analysis for
adoption in coastal environments................................................................................................1
Managed Retreat:........................................................................................................................1
Q2. (d) Likely effects of change in Mean Sea Level in coastal engineering design...................2
Task 2...............................................................................................................................................2
(1).................................................................................................................................................2
(b).................................................................................................................................................2
(c).................................................................................................................................................5
REFERENCES................................................................................................................................7

⊘ This is a preview!⊘
Do you want full access?
Subscribe today to unlock all pages.

Trusted by 1+ million students worldwide
MAIN BODY
Q1. (a) Various statistical techniques useful in river discharge analysis with limitations in
reference to flood risk management.
Empirical frequency distributions:
One of the methods for studying the variability of water flow through streams is by flow
duration curves that can be regarded as standard output from hydrological data analysis.
However, it is clear that no single distribution can represent equally the population of annual
floods everywhere which is why personal judgement becomes a limitation of this method.
Time-series analysis:
This method is used to test the homogeneity, variability or trend of a streamflow series or
to get an insight into the features or characteristics of the series (McCuen, 2016). Limitation of
this method is that there may be some abnormal event that happened in the past which is likely to
effect the outcomes significantly, so attention needs to be paid to all such details.
Series homogeneity tests:
Series homogeneity tests are also applied to streamflow data to check the relevance of the
series but it should be kept in mind that inhomogeneity of the records may arise due to many
reasons such as data error, climate change, changes in river regulation etcetera.
Q2. (a) Types of natural and artificial coastal defence schemes with suitability analysis for
adoption in coastal environments.
Managed Retreat:
It is an alternative to construction of coastal structures which allows an area of land to
erode. This technique is often used as a response to an increase in sea-level when the land near
the sea is low in value. Land is allowed to erode and flood which helps in creation of new
shoreline habitats. The process may continue for years.
Hold the line:
Holding the line techniques generally refers to hardening of shorelines using rock
constructions and permanent concrete. For example, creating groynes, seawalls or rock armours
to protect the coasts. Rock armour refers to large rocks placed at the shoreline to protect the area
beyond however these have a limited lifespan and are not suitable in storm conditions (Gallien,
1
Paraphrase This Document
Need a fresh take? Get an instant paraphrase of this document with our AI Paraphraser
Sanders and Flick, 2014). These techniques are cost-effective, require very little maintenance
and are amongst the most common ones.
Dune stabilization:
Stabilization of dunes helps in protection of beaches by collecting windblown sand and
increasing the process of natural beach formation. It makes use of public amenities such as car
parking areas, footpaths etcetera to mitigate erosion and removal of sand by human activities.
Q2. (d) Likely effects of change in Mean Sea Level in coastal engineering design.
Sea level refers to the mean height of the ocean’s surface between low and high tide.
Climate change is one of the main reason behind the rise in the sea-level over the past few years.
Global warming has caused the glaciers Arctic region to melt due to which the water level in the
sea increases. Polar regions will warm even more quickly due to arctic-ice melting (Shennan
Milne and Bradley, 2012). Thus, warming leads to sea-based ice melting which leads to even
more warming. It affects significantly the way coastal regions are designed since the risk of flood
also increases with the rise in sea level. More precautionary measures are being included in the
coastal-engineering designs.
Task 2
(1)
(b)
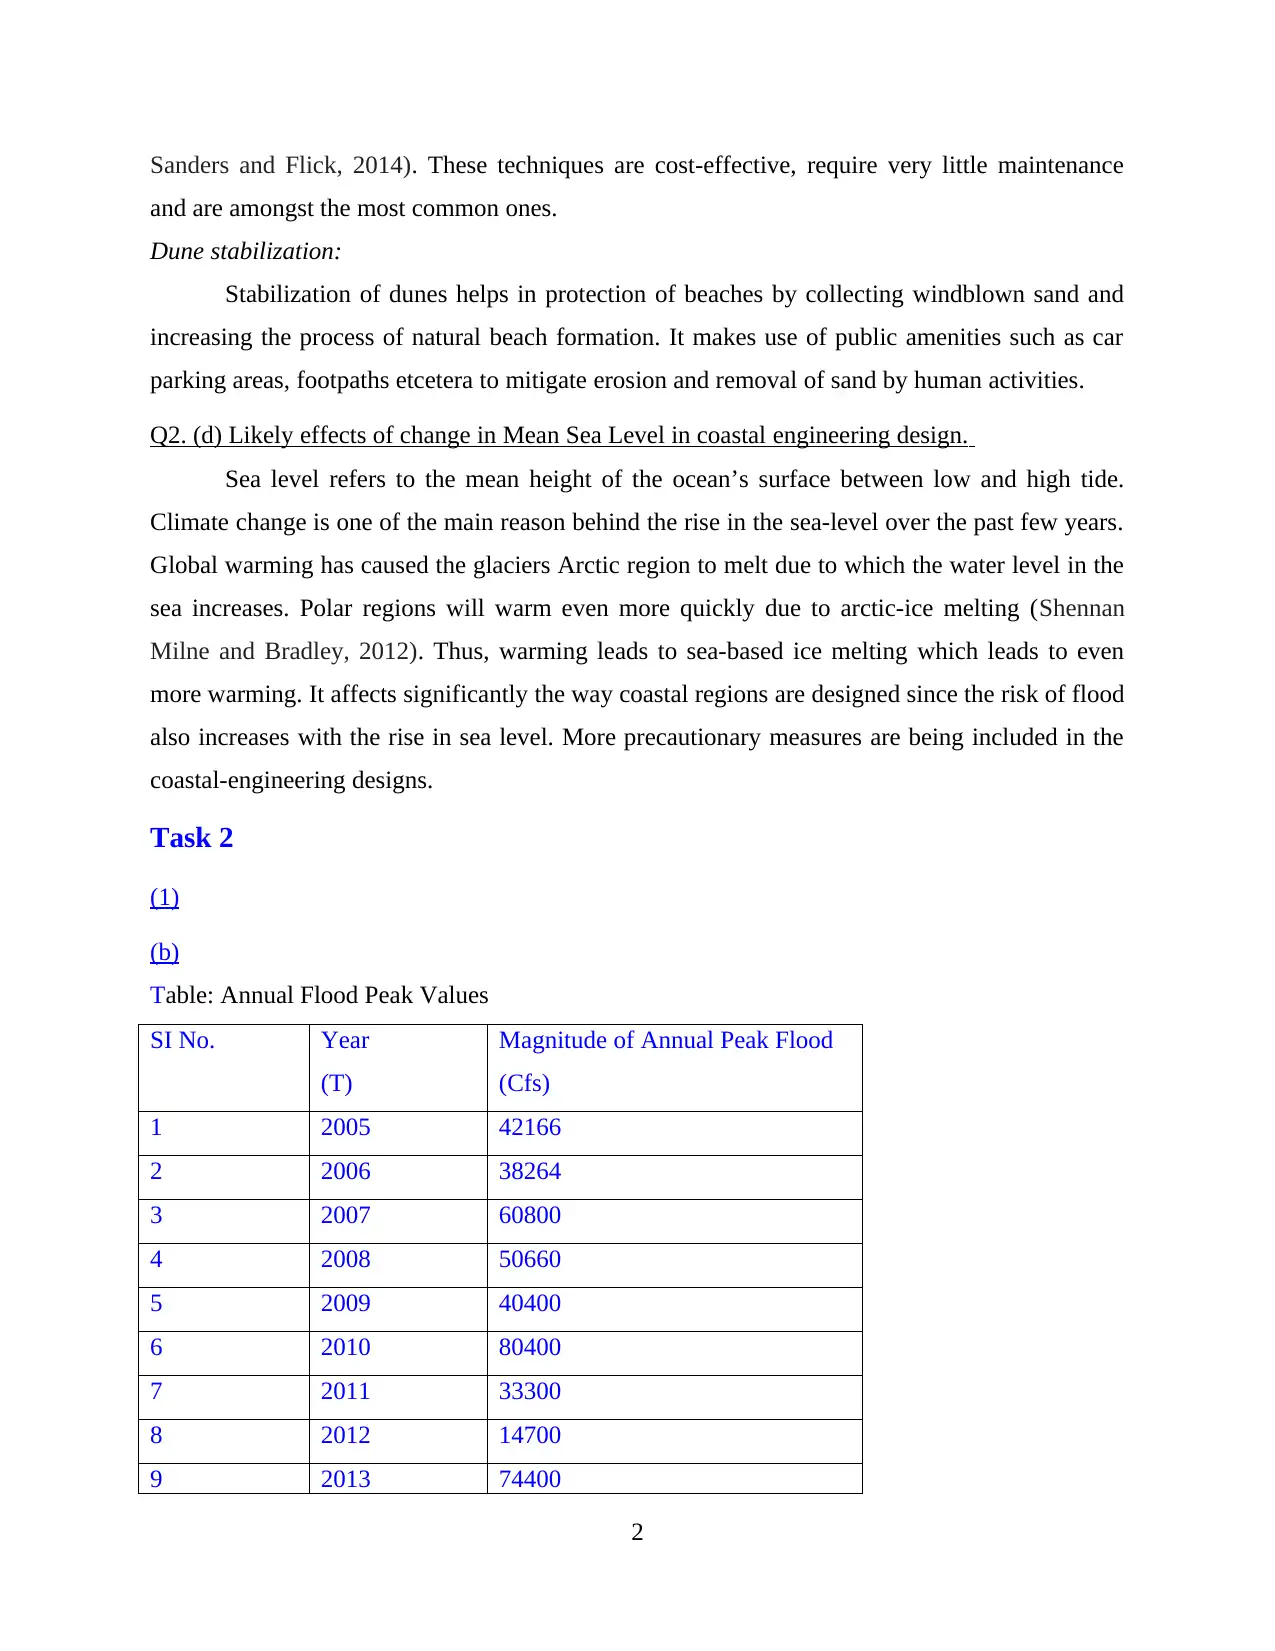
Table: Annual Flood Peak Values
SI No. Year
(T)
Magnitude of Annual Peak Flood
(Cfs)
1 2005 42166
2 2006 38264
3 2007 60800
4 2008 50660
5 2009 40400
6 2010 80400
7 2011 33300
8 2012 14700
9 2013 74400
2
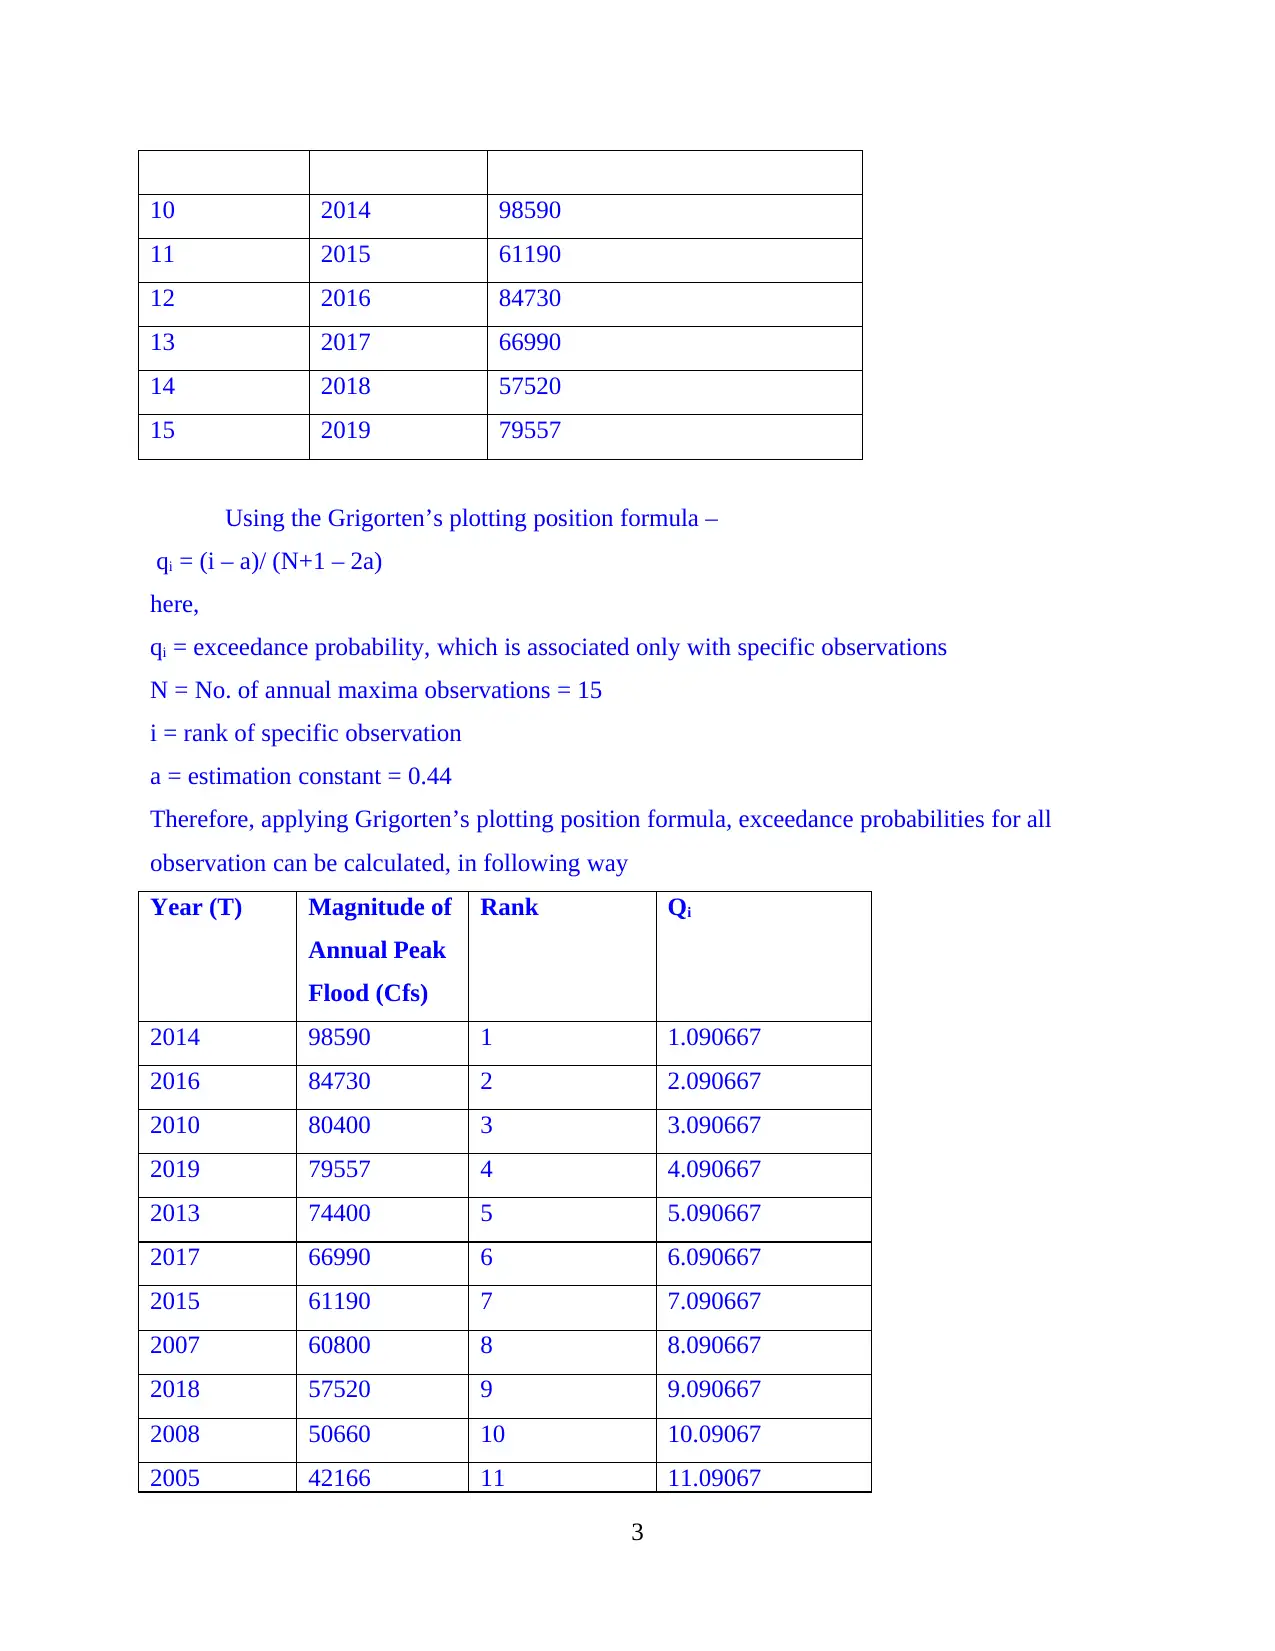
10 2014 98590
11 2015 61190
12 2016 84730
13 2017 66990
14 2018 57520
15 2019 79557
Using the Grigorten’s plotting position formula –
qi = (i – a)/ (N+1 – 2a)
here,
qi = exceedance probability, which is associated only with specific observations
N = No. of annual maxima observations = 15
i = rank of specific observation
a = estimation constant = 0.44
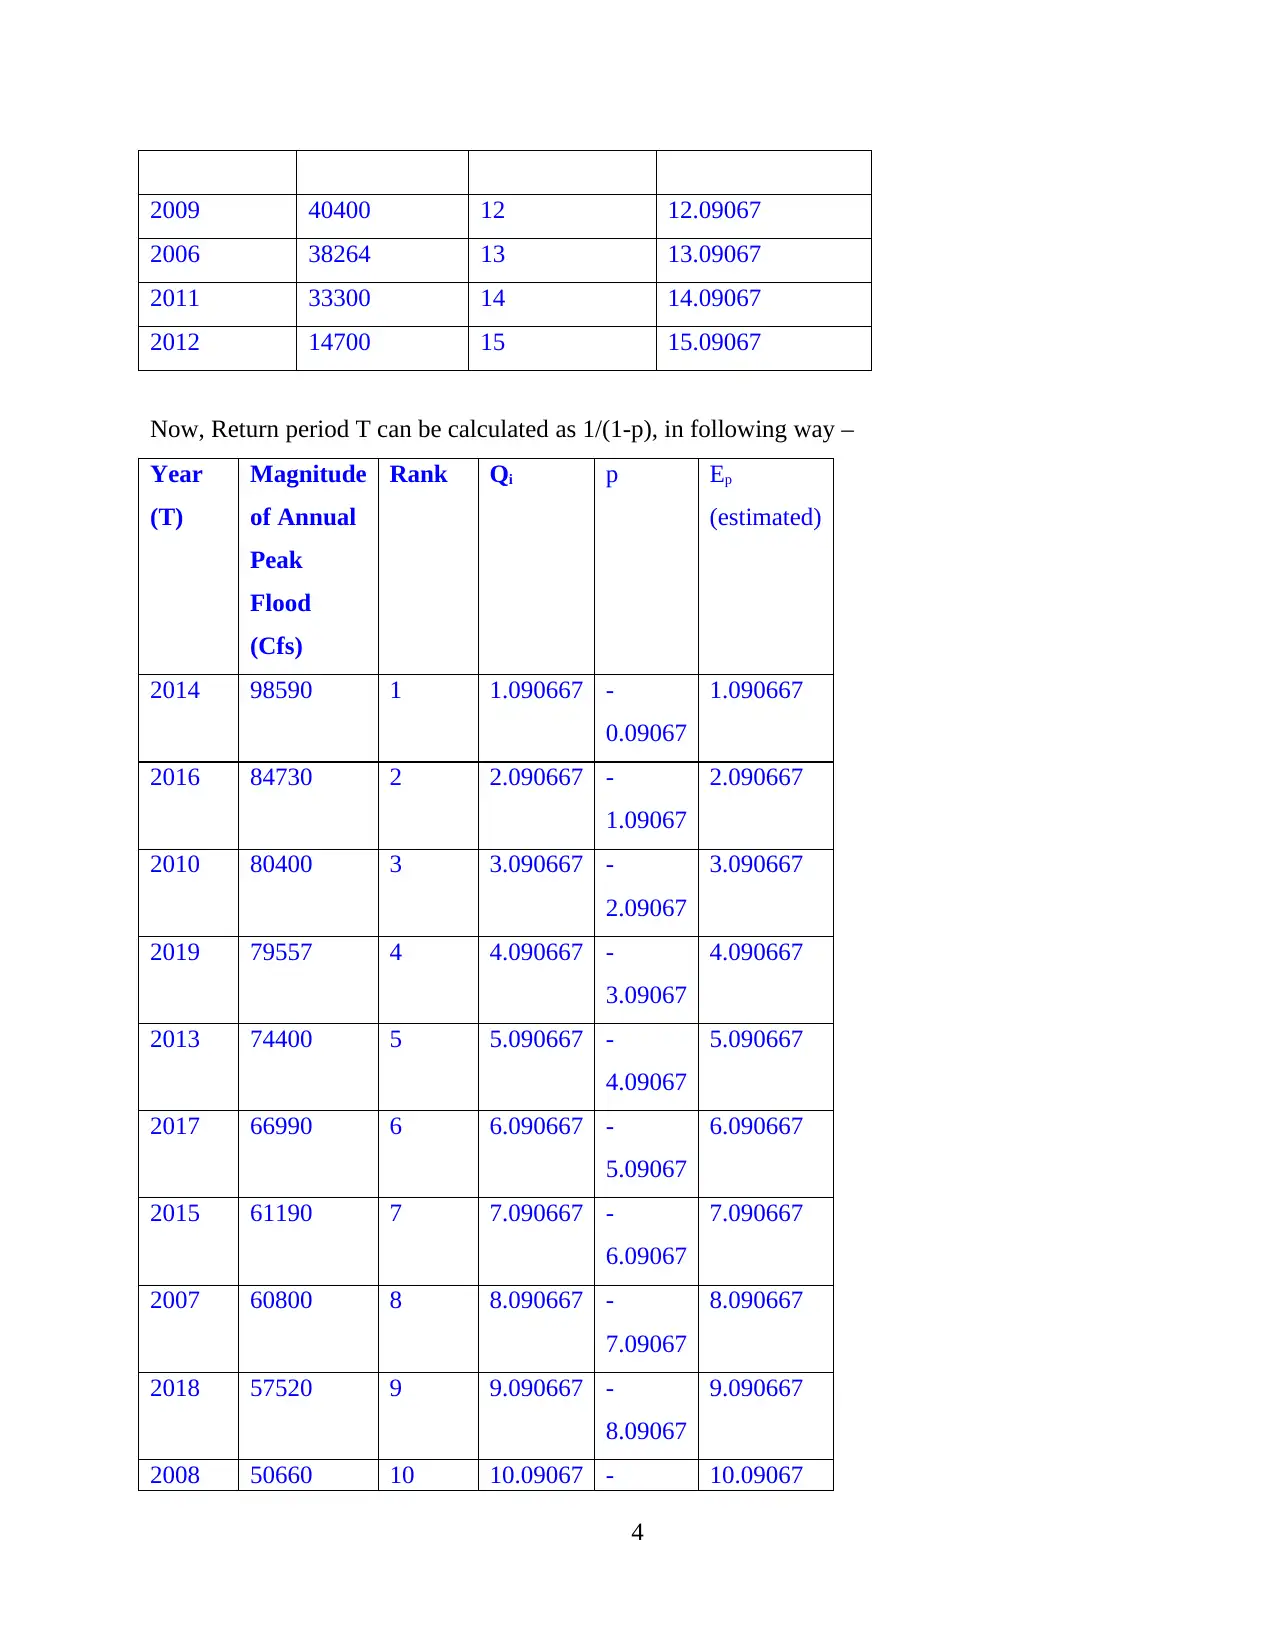
Therefore, applying Grigorten’s plotting position formula, exceedance probabilities for all
observation can be calculated, in following way
Year (T) Magnitude of
Annual Peak
Flood (Cfs)
Rank Qi
2014 98590 1 1.090667
2016 84730 2 2.090667
2010 80400 3 3.090667
2019 79557 4 4.090667
2013 74400 5 5.090667
2017 66990 6 6.090667
2015 61190 7 7.090667
2007 60800 8 8.090667
2018 57520 9 9.090667
2008 50660 10 10.09067
2005 42166 11 11.09067
3
⊘ This is a preview!⊘
Do you want full access?
Subscribe today to unlock all pages.

Trusted by 1+ million students worldwide
2009 40400 12 12.09067
2006 38264 13 13.09067
2011 33300 14 14.09067
2012 14700 15 15.09067
Now, Return period T can be calculated as 1/(1-p), in following way –
Year
(T)
Magnitude
of Annual
Peak
Flood
(Cfs)
Rank Qi p Ep
(estimated)
2014 98590 1 1.090667 -
0.09067
1.090667
2016 84730 2 2.090667 -
1.09067
2.090667
2010 80400 3 3.090667 -
2.09067
3.090667
2019 79557 4 4.090667 -
3.09067
4.090667
2013 74400 5 5.090667 -
4.09067
5.090667
2017 66990 6 6.090667 -
5.09067
6.090667
2015 61190 7 7.090667 -
6.09067
7.090667
2007 60800 8 8.090667 -
7.09067
8.090667
2018 57520 9 9.090667 -
8.09067
9.090667
2008 50660 10 10.09067 - 10.09067
4
Paraphrase This Document
Need a fresh take? Get an instant paraphrase of this document with our AI Paraphraser
9.09067
2005 42166 11 11.09067 -
10.0907
11.09067
2009 40400 12 12.09067 -
11.0907
12.09067
2006 38264 13 13.09067 -
12.0907
13.09067
2011 33300 14 14.09067 -
13.0907
14.09067
2012 14700 15 15.09067 -
14.0907
15.09067
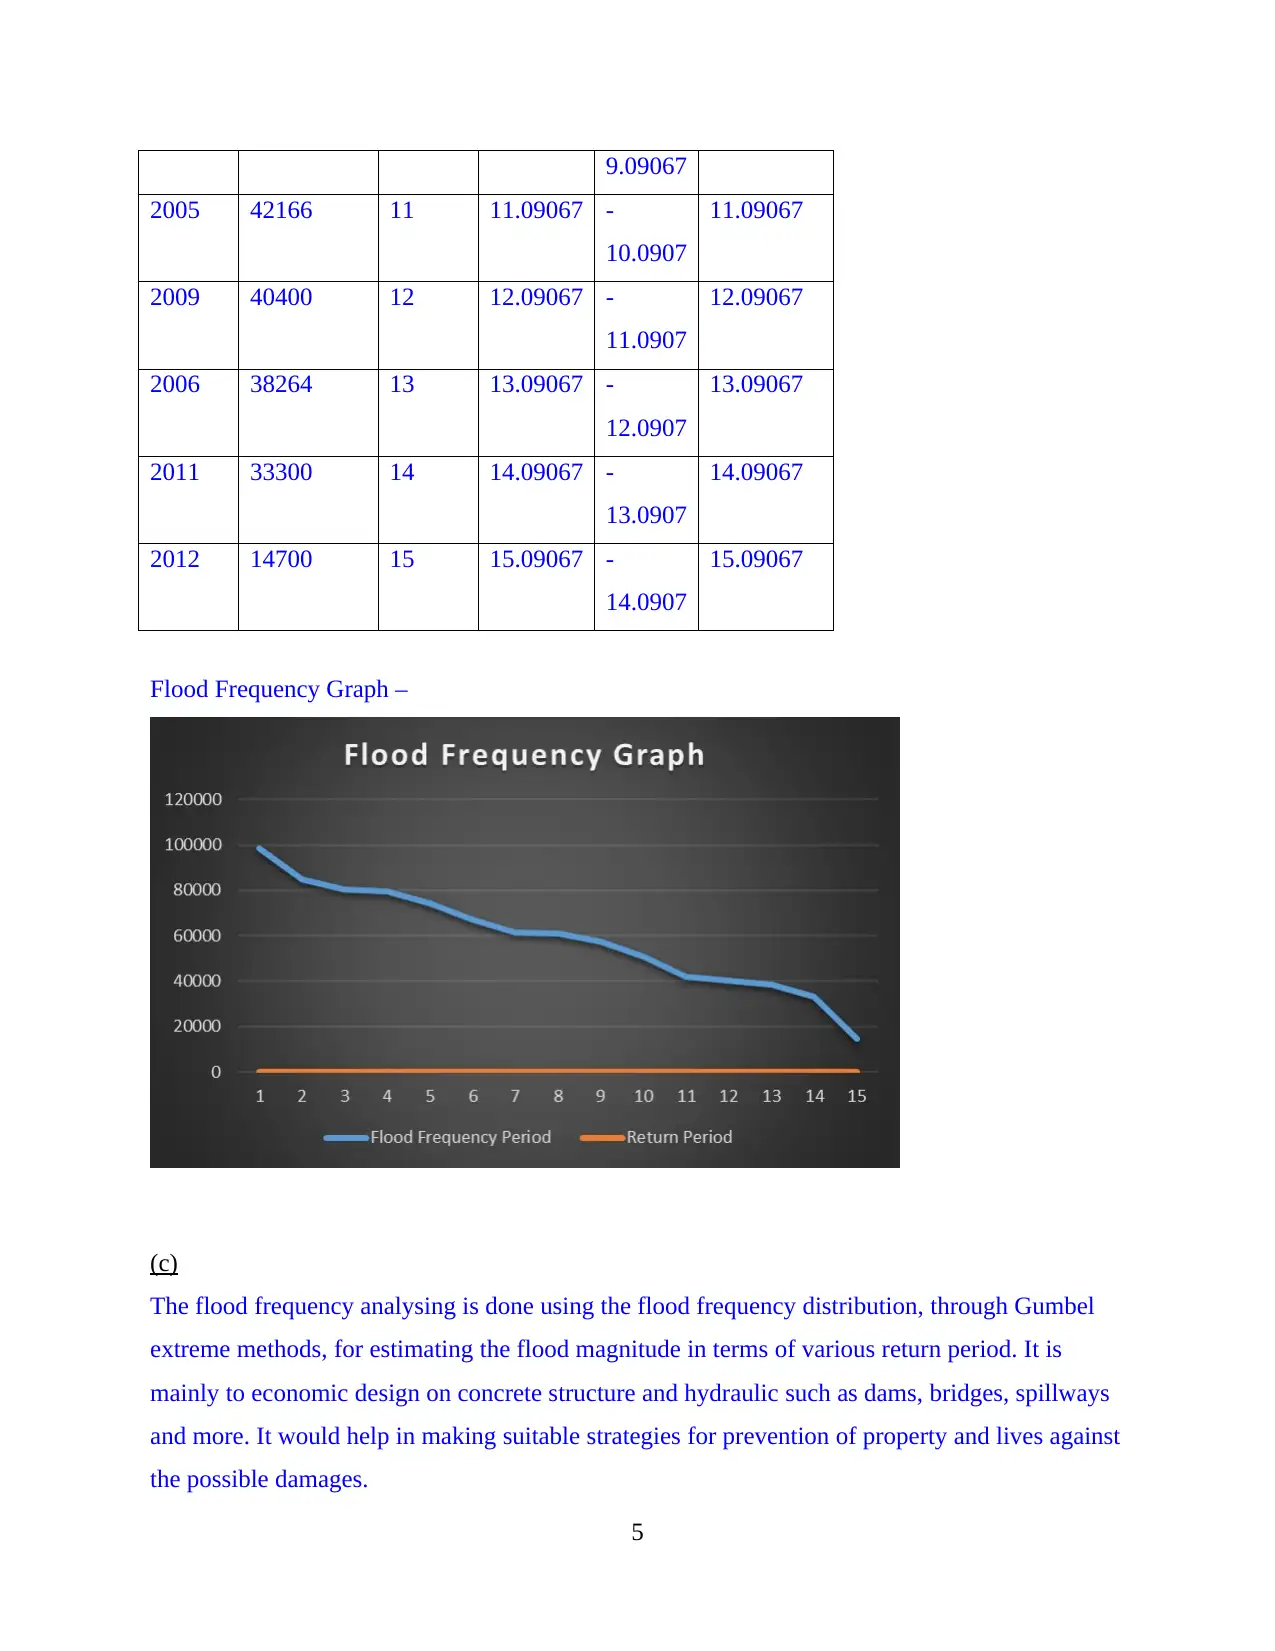
Flood Frequency Graph –
(c)
The flood frequency analysing is done using the flood frequency distribution, through Gumbel
extreme methods, for estimating the flood magnitude in terms of various return period. It is
mainly to economic design on concrete structure and hydraulic such as dams, bridges, spillways
and more. It would help in making suitable strategies for prevention of property and lives against
the possible damages.
5

6
⊘ This is a preview!⊘
Do you want full access?
Subscribe today to unlock all pages.

Trusted by 1+ million students worldwide

REFERENCES
Books and Journals
McCuen, R.H., 2016. Modeling hydrologic change: statistical methods. CRC press.
Gallien, T.W., Sanders, B.F. and Flick, R.E., 2014. Urban coastal flood prediction: Integrating
wave overtopping, flood defenses and drainage. Coastal Engineering. 91. pp.18-28.
Shennan, I., Milne, G. and Bradley, S., 2012. Late Holocene vertical land motion and relative
sea‐level changes: lessons from the British Isles. Journal of Quaternary Science. 27(1).
pp.64-70.
7
1 out of 10
Your All-in-One AI-Powered Toolkit for Academic Success.
+13062052269
info@desklib.com
Available 24*7 on WhatsApp / Email
![[object Object]](/_next/static/media/star-bottom.7253800d.svg)
Unlock your academic potential
Copyright © 2020–2025 A2Z Services. All Rights Reserved. Developed and managed by ZUCOL.