Water Quality Modelling Report: CIVE 5066, Drinking Water Treatment
VerifiedAdded on 2023/06/03
|8
|1982
|133
Report
AI Summary
This report presents an analysis of water quality data from a treatment plant, evaluating the potential implementation of WTC-Coag software to improve treatment processes. The analysis includes data cleaning, error correction, and the identification of key parameters for the WTC-Coag assessment, such as UV absorbance, color, and turbidity. The report addresses data errors, including non-numeric values, overestimation, and missing data, proposing methods for their correction. It also includes a business case for the upgrade, comparing the costs associated with WTC-Coag with those of traditional methods, and making recommendations based on the analysis. The report uses the data to create a business case for implementing WTC-Coag, analyzing the costs and benefits and comparing the performance of the current processes with the WTC-Coag software, along with a comparison of predicted and actual alum dosages, and includes a discussion of the software's benefits in terms of cost savings and improved water quality. The report concludes with a recommendation to employ the WTC-Coag system.
Running head: WATER QUALITY MODELLING 1
Water Quality Modelling Paper
Student's Name
Professor's Name
Affiliation
Date
Water Quality Modelling Paper
Student's Name
Professor's Name
Affiliation
Date
Paraphrase This Document
Need a fresh take? Get an instant paraphrase of this document with our AI Paraphraser
WATER QUALITY MODELLING 2
Water Quality Modelling
Question 1
The treatment plant records are for the period between 2010 and 2017. Although the data is
available for all years between the specified period; 2010 and 2017 only have data for 3 months
and 5 months respectively. The data is presented in different categories depending on the
quantity being assessed. For instance, in order to obtain highly quality drinking water the unclean
water is subjected through as series of purification steps that are classified under several
categories such as, raw water, coagulated water, floated water, filtered water, transfer water, and
treated water. The columns of data do not have the same number of values with some being
highly populated and others having considerably few values in them e.g. Manganese columns
have very few values in them. The assessment of some parameters is differentiated into
laboratory and online; denoting the source that was used to get the values presented in the rows.
Question 2
Part a
From the data presented in the excel document it is clear there are some data values that are more
important than others. As such, the necessary parameters to be used in the WTC-Coag
assessment are as follows: Colour (COLOUR), Turbidity (TURB), Target coagulation pH,
Enhance Coagulation (EC), UV absorbance at 254nm (UV), Aluminium Sulphate (ALUM). The
parameter aforementioned at the most important with regard to the computations relating to
water purification The three parameters that will be employed in the calculation of WTC-Coag
are UV, COLOUR, and TURB. Other parameters will be used in conjunction with the ones
mentioned above to compute alkalinity, alum dose rate, % removal of coagulable DOC, and pH
changes.
WATER QUALITY MODELLING 3
Part b
There are several data errors but the most notable ones relate to matters of data entry where none
numeric values are entered e.g. "*" and "plant full". The use of non-numeric values could also be
a misplacement error where a statement like "plant full" is supposed to be in the comment
column as a justification of why not records are present for a given date. Overestimation error
results in the entry of considerably large data values that are not consistent with other data values
in the same category or column. Another error is the failure to use consistent units of measure:
for instance, water is supposed to be assessed in mega litres there are however some instances
where it is represented in litres, even thou it can be easily transcribed into mega litres. Lastly,
there are numerous missing values; in some categories the missing values are considerably large,
but in others they are few.
Part c
In the cases that none numeric values have been entered they should all be replaced by a value
that is an average of the four neighbouring values in the same column or category (preferably the
values should be from the same year). For large missing sets of data, specific column should be
ignored completely. For individual missing values the specific row of that column can be ignored
to avoid overestimation or underestimation of the actual value.
Part d
Irrelevant data: I will delete all rows with data for the period between 2010 and May 20 of 2014;
so that we are left with three years of data for the period between May 21of 2014 and May 21 of
2017. This is appropriate to do because the assessment of the data needs to be done with regard
to most recent three years of data.
⊘ This is a preview!⊘
Do you want full access?
Subscribe today to unlock all pages.
Trusted by 1+ million students worldwide
WATER QUALITY MODELLING 4
Missing Data: I will delete columns with too many missing values because they will be
inconsequential in the overall calculations. Moreover, some of the columns with missing values
are unnecessary in the computation of key assessment parameters that will be employed in
decision-making by WTC managers. In situations where the missing values are few and
supposed to be numeric we will get an average for the empty cell using an average of four
values; two values above the empty cell and two below it. This will allow us to get a more
realistic value the single missing values. In a situation where it is an entire row that is missing
data the row will be completely ignored since the data for that data was not collected or
transcribed into the treatment plan records.
Non-numerical data: all non numeric data that appears amongst numeric values will be replaced
with a value that is the average of four points (2 above and 2 below the non-numeric value). By
so doing the value the figure entered in place of the nonnumeric data will be considerably similar
to the rest of the data.
Considerably large data (outliners): This will also be replaced by values that are averages of the
neighbouring cell values. Outliners are important to eliminate because they negative affect the
spread and centre values of the data set. In addition, outliners present an unrealistic
representation of data distribution and the values that can be assumed by a variable. For instance,
it is unrealistic for temperature to take up values of 30008⁰C; this could be a misrepresentation of
38⁰C.
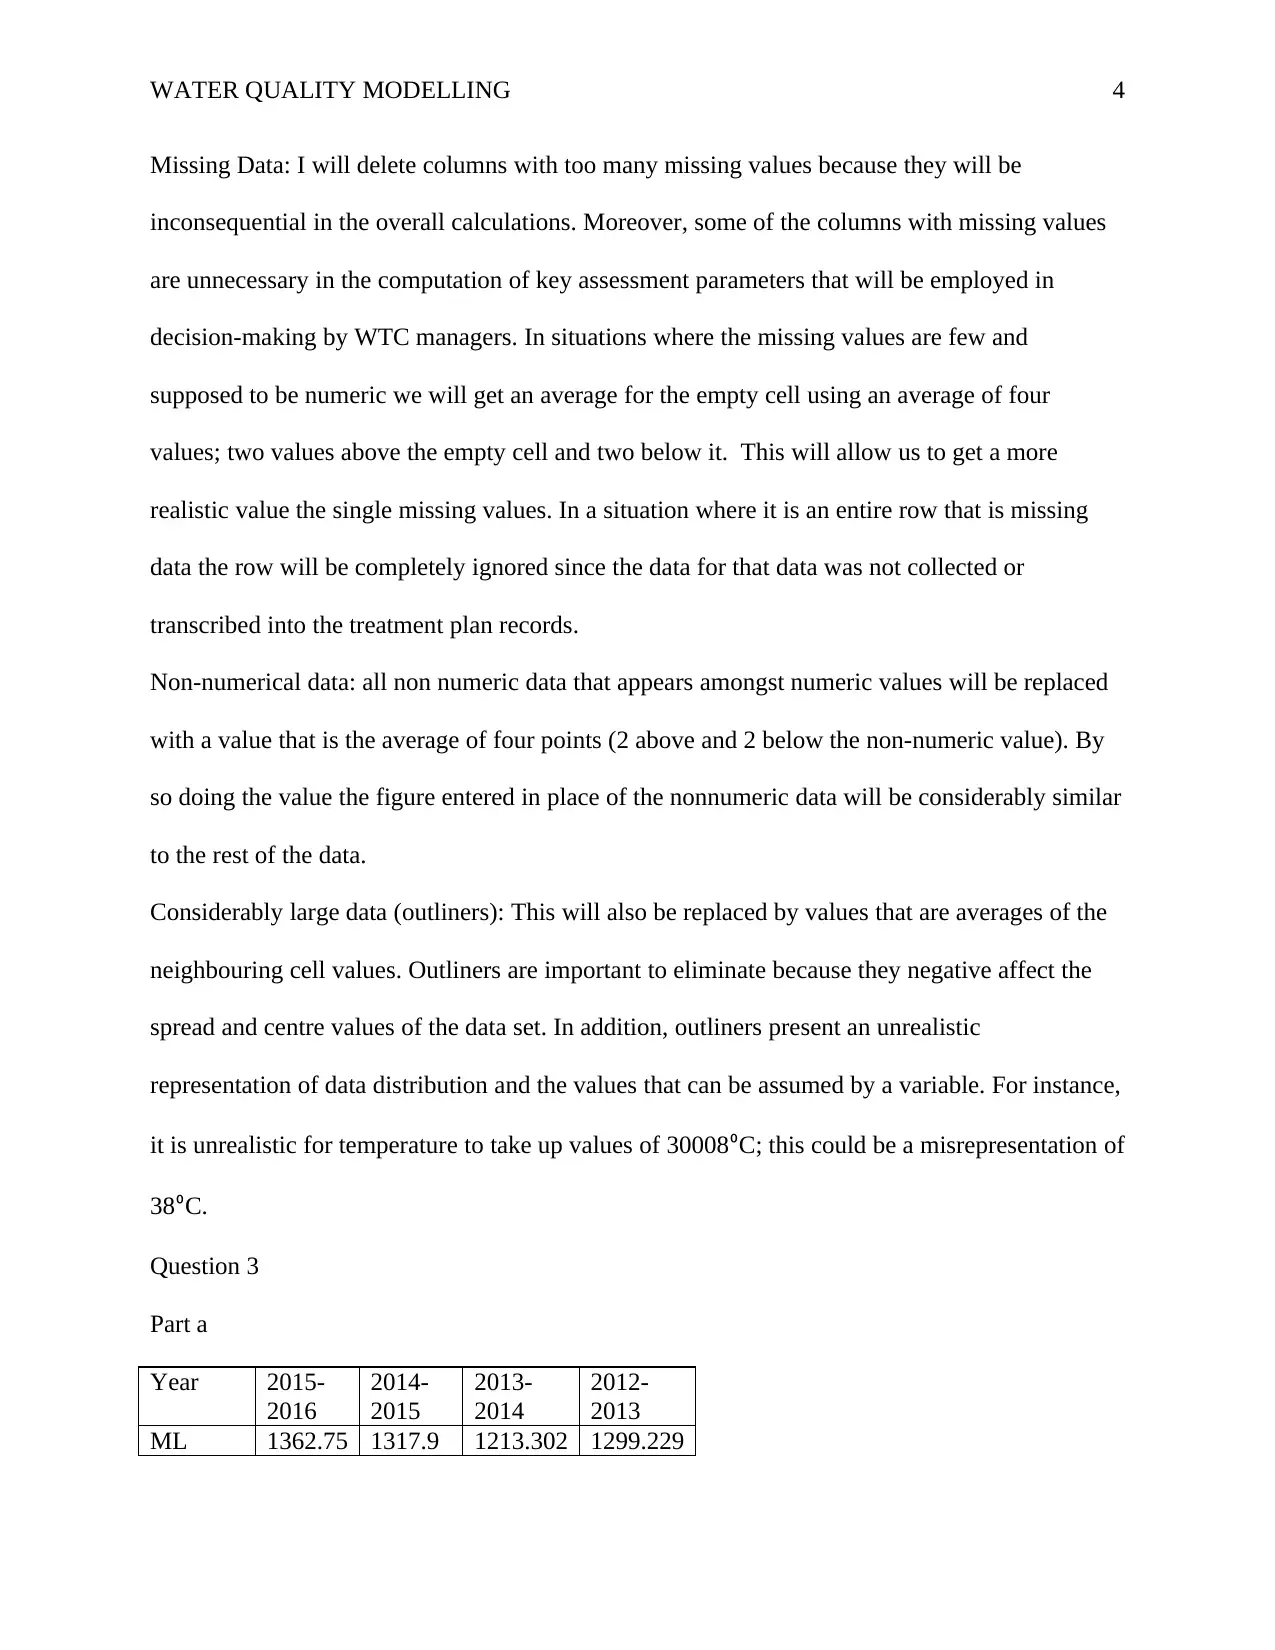
Question 3
Part a
Year 2015-
2016
2014-
2015
2013-
2014
2012-
2013
ML 1362.75 1317.9 1213.302 1299.229
Missing Data: I will delete columns with too many missing values because they will be
inconsequential in the overall calculations. Moreover, some of the columns with missing values
are unnecessary in the computation of key assessment parameters that will be employed in
decision-making by WTC managers. In situations where the missing values are few and
supposed to be numeric we will get an average for the empty cell using an average of four
values; two values above the empty cell and two below it. This will allow us to get a more
realistic value the single missing values. In a situation where it is an entire row that is missing
data the row will be completely ignored since the data for that data was not collected or
transcribed into the treatment plan records.
Non-numerical data: all non numeric data that appears amongst numeric values will be replaced
with a value that is the average of four points (2 above and 2 below the non-numeric value). By
so doing the value the figure entered in place of the nonnumeric data will be considerably similar
to the rest of the data.
Considerably large data (outliners): This will also be replaced by values that are averages of the
neighbouring cell values. Outliners are important to eliminate because they negative affect the
spread and centre values of the data set. In addition, outliners present an unrealistic
representation of data distribution and the values that can be assumed by a variable. For instance,
it is unrealistic for temperature to take up values of 30008⁰C; this could be a misrepresentation of
38⁰C.
Question 3
Part a
Year 2015-
2016
2014-
2015
2013-
2014
2012-
2013
ML 1362.75 1317.9 1213.302 1299.229
Paraphrase This Document
Need a fresh take? Get an instant paraphrase of this document with our AI Paraphraser
WATER QUALITY MODELLING 5
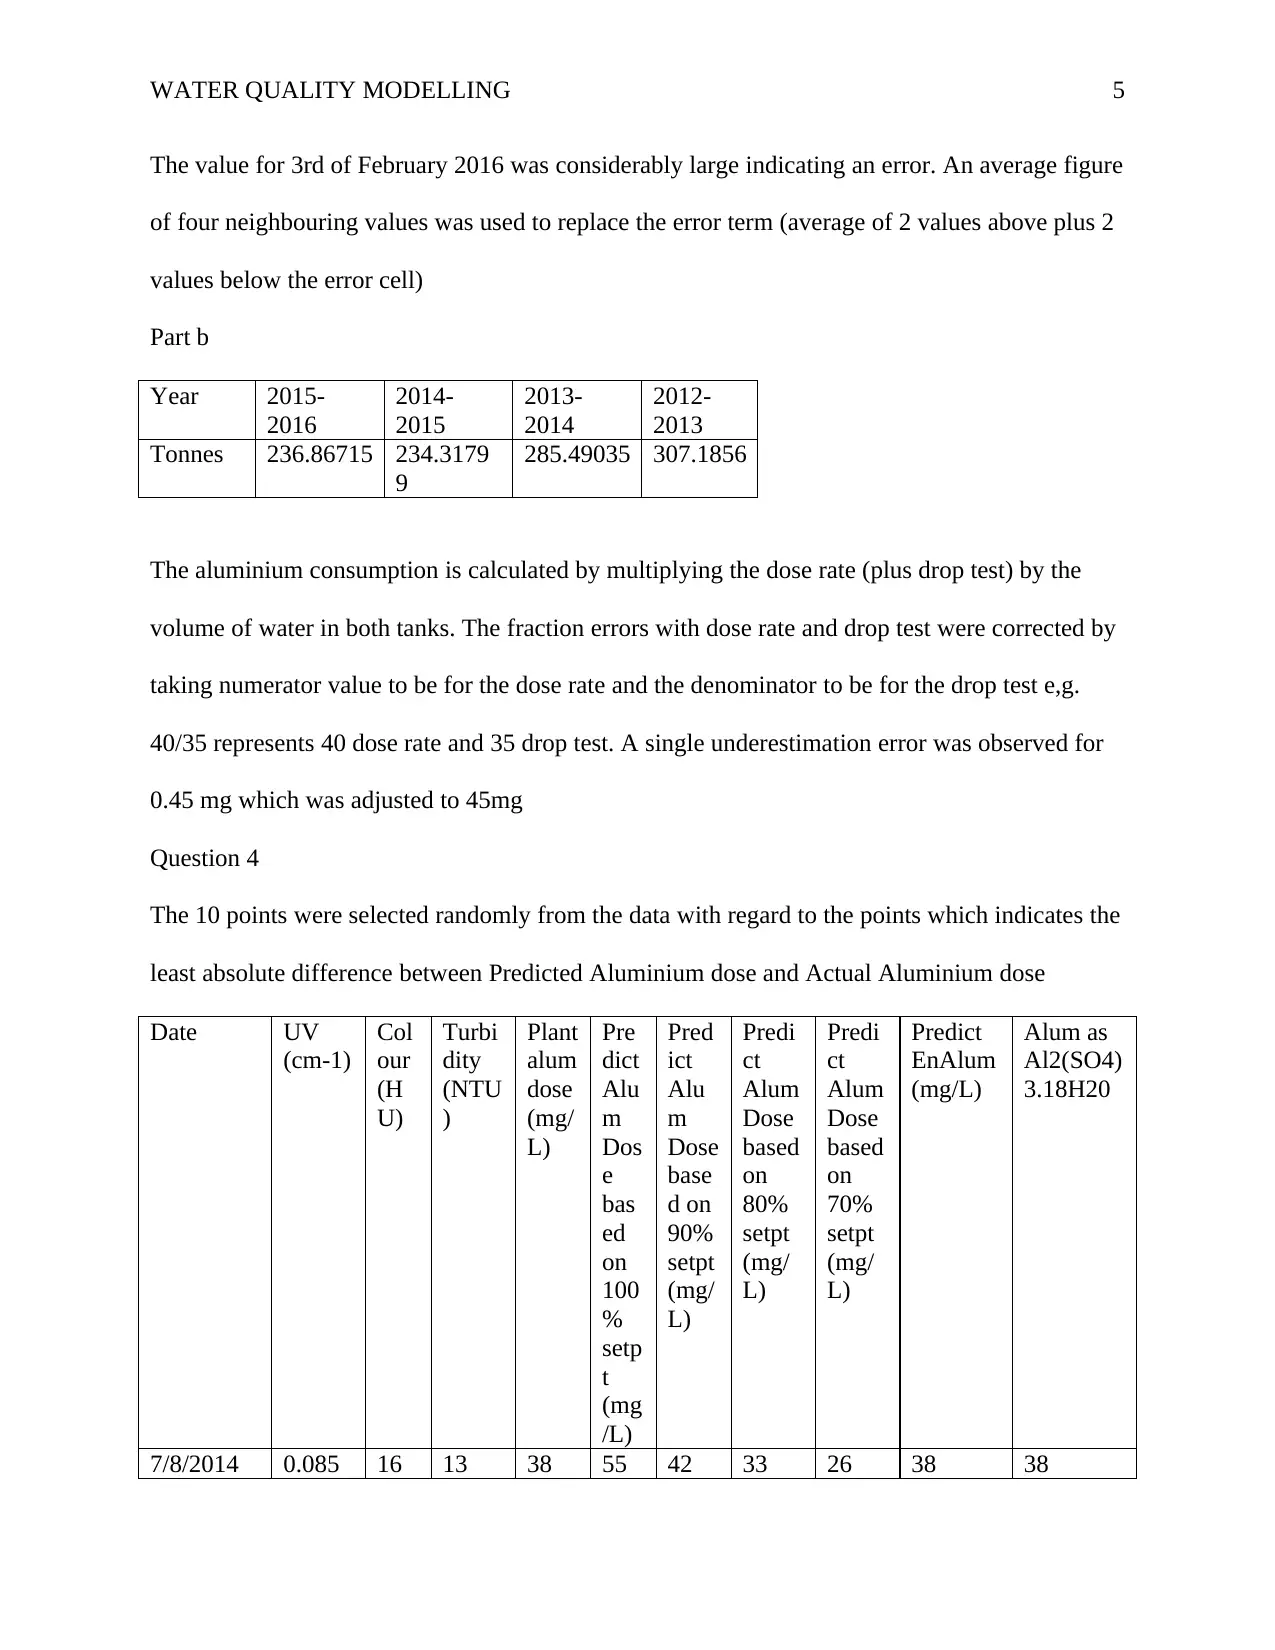
The value for 3rd of February 2016 was considerably large indicating an error. An average figure
of four neighbouring values was used to replace the error term (average of 2 values above plus 2
values below the error cell)
Part b
Year 2015-
2016
2014-
2015
2013-
2014
2012-
2013
Tonnes 236.86715 234.3179
9
285.49035 307.1856
The aluminium consumption is calculated by multiplying the dose rate (plus drop test) by the
volume of water in both tanks. The fraction errors with dose rate and drop test were corrected by
taking numerator value to be for the dose rate and the denominator to be for the drop test e,g.
40/35 represents 40 dose rate and 35 drop test. A single underestimation error was observed for
0.45 mg which was adjusted to 45mg
Question 4
The 10 points were selected randomly from the data with regard to the points which indicates the
least absolute difference between Predicted Aluminium dose and Actual Aluminium dose
Date UV
(cm-1)
Col
our
(H
U)
Turbi
dity
(NTU
)
Plant
alum
dose
(mg/
L)
Pre
dict
Alu
m
Dos
e
bas
ed
on
100
%
setp
t
(mg
/L)
Pred
ict
Alu
m
Dose
base
d on
90%
setpt
(mg/
L)
Predi
ct
Alum
Dose
based
on
80%
setpt
(mg/
L)
Predi
ct
Alum
Dose
based
on
70%
setpt
(mg/
L)
Predict
EnAlum
(mg/L)
Alum as
Al2(SO4)
3.18H20
7/8/2014 0.085 16 13 38 55 42 33 26 38 38
WATER QUALITY MODELLING 6
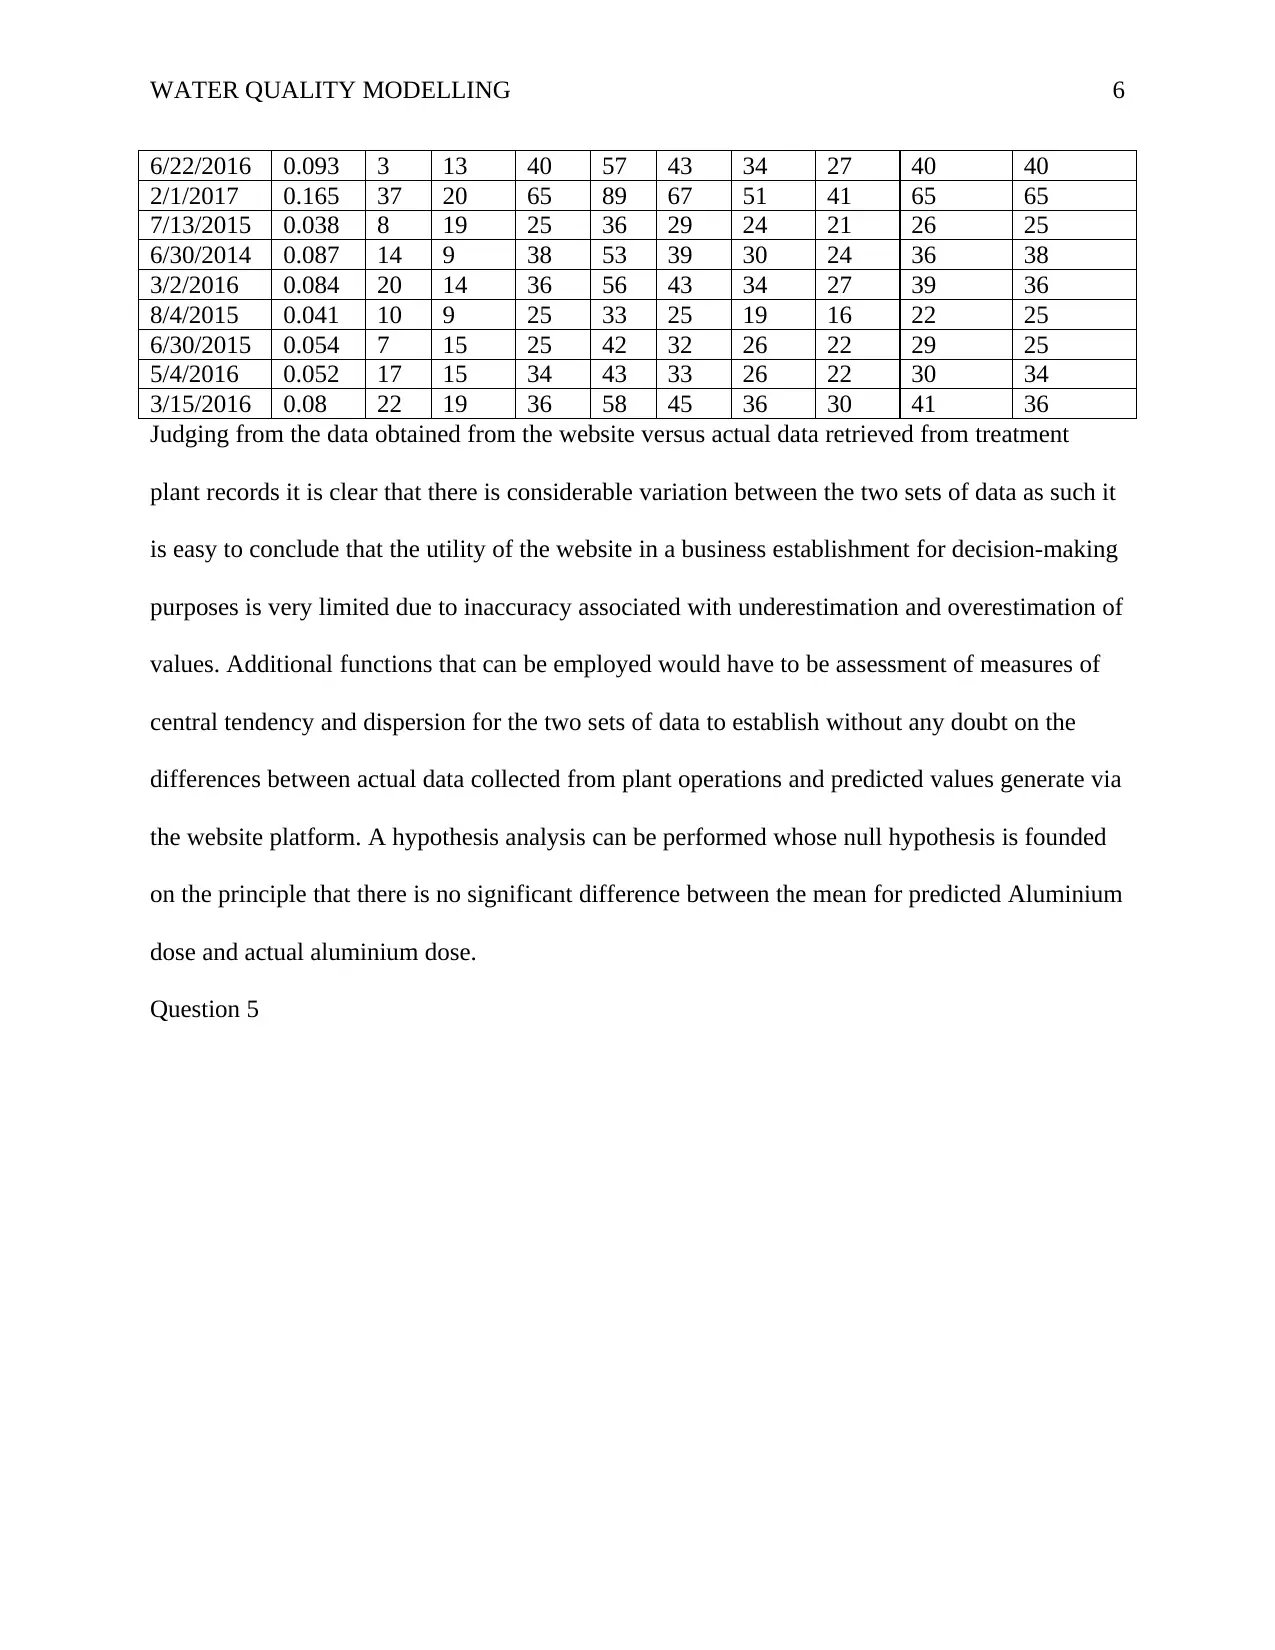
6/22/2016 0.093 3 13 40 57 43 34 27 40 40
2/1/2017 0.165 37 20 65 89 67 51 41 65 65
7/13/2015 0.038 8 19 25 36 29 24 21 26 25
6/30/2014 0.087 14 9 38 53 39 30 24 36 38
3/2/2016 0.084 20 14 36 56 43 34 27 39 36
8/4/2015 0.041 10 9 25 33 25 19 16 22 25
6/30/2015 0.054 7 15 25 42 32 26 22 29 25
5/4/2016 0.052 17 15 34 43 33 26 22 30 34
3/15/2016 0.08 22 19 36 58 45 36 30 41 36
Judging from the data obtained from the website versus actual data retrieved from treatment
plant records it is clear that there is considerable variation between the two sets of data as such it
is easy to conclude that the utility of the website in a business establishment for decision-making
purposes is very limited due to inaccuracy associated with underestimation and overestimation of
values. Additional functions that can be employed would have to be assessment of measures of
central tendency and dispersion for the two sets of data to establish without any doubt on the
differences between actual data collected from plant operations and predicted values generate via
the website platform. A hypothesis analysis can be performed whose null hypothesis is founded
on the principle that there is no significant difference between the mean for predicted Aluminium
dose and actual aluminium dose.
Question 5
⊘ This is a preview!⊘
Do you want full access?
Subscribe today to unlock all pages.
Trusted by 1+ million students worldwide
WATER QUALITY MODELLING 7
6/30/2014
8/27/2014
10/24/2014
12/21/2014
2/17/2015
4/16/2015
6/13/2015
8/10/2015
10/7/2015
12/4/2015
1/31/2016
3/29/2016
5/26/2016
7/23/2016
9/19/2016
11/16/2016
1/13/2017
0
10
20
30
40
50
60
70
80
90
100
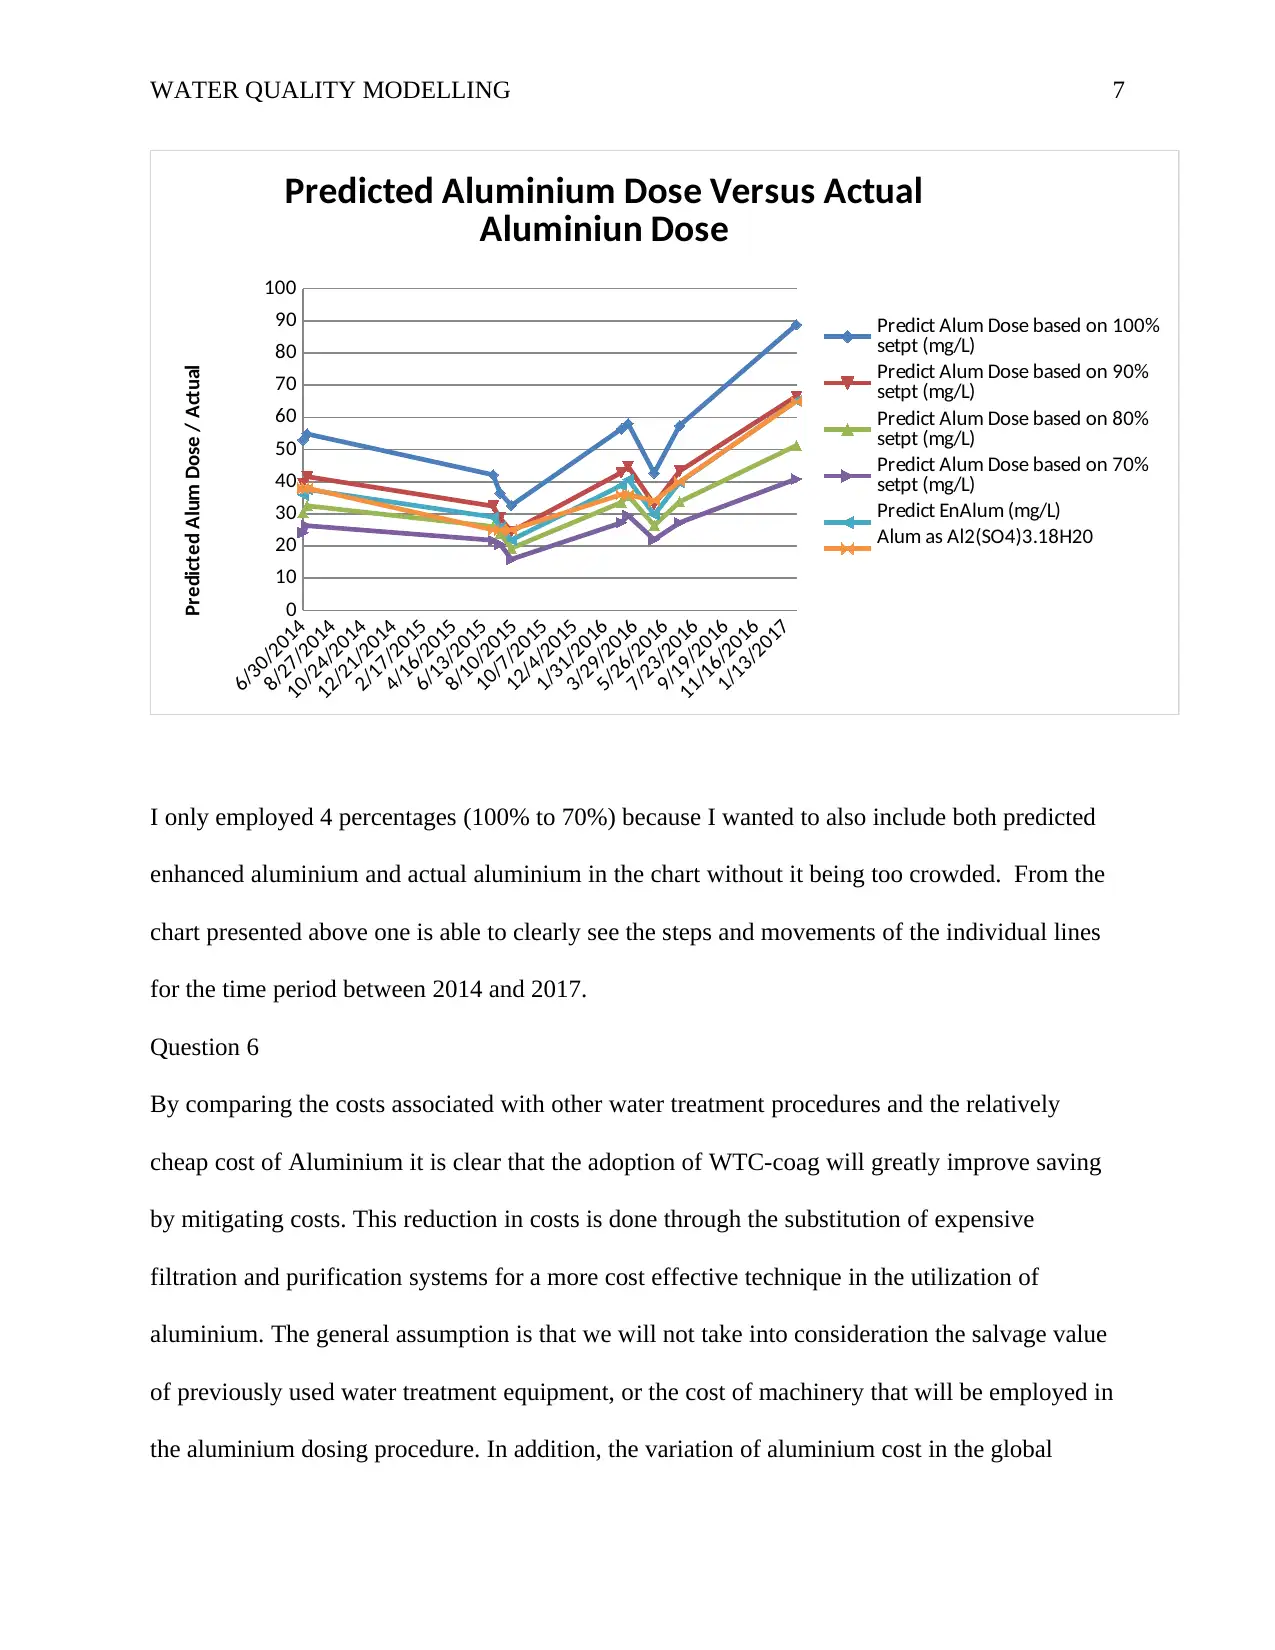
Predicted Aluminium Dose Versus Actual
Aluminiun Dose
Predict Alum Dose based on 100%
setpt (mg/L)
Predict Alum Dose based on 90%
setpt (mg/L)
Predict Alum Dose based on 80%
setpt (mg/L)
Predict Alum Dose based on 70%
setpt (mg/L)
Predict EnAlum (mg/L)
Alum as Al2(SO4)3.18H20
Predicted Alum Dose / Actual
I only employed 4 percentages (100% to 70%) because I wanted to also include both predicted
enhanced aluminium and actual aluminium in the chart without it being too crowded. From the
chart presented above one is able to clearly see the steps and movements of the individual lines
for the time period between 2014 and 2017.
Question 6
By comparing the costs associated with other water treatment procedures and the relatively
cheap cost of Aluminium it is clear that the adoption of WTC-coag will greatly improve saving
by mitigating costs. This reduction in costs is done through the substitution of expensive
filtration and purification systems for a more cost effective technique in the utilization of
aluminium. The general assumption is that we will not take into consideration the salvage value
of previously used water treatment equipment, or the cost of machinery that will be employed in
the aluminium dosing procedure. In addition, the variation of aluminium cost in the global
6/30/2014
8/27/2014
10/24/2014
12/21/2014
2/17/2015
4/16/2015
6/13/2015
8/10/2015
10/7/2015
12/4/2015
1/31/2016
3/29/2016
5/26/2016
7/23/2016
9/19/2016
11/16/2016
1/13/2017
0
10
20
30
40
50
60
70
80
90
100
Predicted Aluminium Dose Versus Actual
Aluminiun Dose
Predict Alum Dose based on 100%
setpt (mg/L)
Predict Alum Dose based on 90%
setpt (mg/L)
Predict Alum Dose based on 80%
setpt (mg/L)
Predict Alum Dose based on 70%
setpt (mg/L)
Predict EnAlum (mg/L)
Alum as Al2(SO4)3.18H20
Predicted Alum Dose / Actual
I only employed 4 percentages (100% to 70%) because I wanted to also include both predicted
enhanced aluminium and actual aluminium in the chart without it being too crowded. From the
chart presented above one is able to clearly see the steps and movements of the individual lines
for the time period between 2014 and 2017.
Question 6
By comparing the costs associated with other water treatment procedures and the relatively
cheap cost of Aluminium it is clear that the adoption of WTC-coag will greatly improve saving
by mitigating costs. This reduction in costs is done through the substitution of expensive
filtration and purification systems for a more cost effective technique in the utilization of
aluminium. The general assumption is that we will not take into consideration the salvage value
of previously used water treatment equipment, or the cost of machinery that will be employed in
the aluminium dosing procedure. In addition, the variation of aluminium cost in the global
Paraphrase This Document
Need a fresh take? Get an instant paraphrase of this document with our AI Paraphraser
WATER QUALITY MODELLING 8
market will be limited within acceptable parameters; as such, the price of aluminium will not be
expected to be high than $5 per kg or less than $0.50 per kg.
Question 7
Background
There are similar products in the market but WTC-coag is considered the most effective
technique compared to its predecessors and market equivalents. It allows the establishment to use
considerable less Aluminium in the dosing process but yields better treatment results.
Problem Statement
The main issue it the betterment of the treatment process without increasing the inputs used in
the aluminium dosing processes of removal of DOC.
Recommendation
My recommendation will have to be employment of the WTC-coag system because it will
greately improve the quality of the treated water by removing a higher percentage of DOC
compared to tradition filtration and purification systems. Moreover, WTP
Question 8
EXCEL DOCUMENT
1 out of 8
Your All-in-One AI-Powered Toolkit for Academic Success.
+13062052269
info@desklib.com
Available 24*7 on WhatsApp / Email
![[object Object]](/_next/static/media/star-bottom.7253800d.svg)
Unlock your academic potential
Copyright © 2020–2026 A2Z Services. All Rights Reserved. Developed and managed by ZUCOL.