Urban Growth and Water Sustainability in Abu Dhabi: Indicators
VerifiedAdded on 2023/05/30
|22
|7074
|107
Report
AI Summary
This report presents a study on developing water sustainability indicators for Abu Dhabi, UAE, an arid environment facing significant water challenges. The research, presented at the 6th Making Cities Liveable Conference, analyzes the city's water situation, including high per capita consumption, over-exploited groundwater, and reliance on desalination. The study proposes a framework of 19 indicators across four categories: water availability, quality, use efficiency, and policy & governance, using a DSR (Driving force, State, Response) approach. The methodology involves reviewing the literature, selecting relevant indicators, and defining scales for evaluation. The report highlights the need for sustainable water management strategies in Abu Dhabi, considering the region's natural constraints and increasing water demands. The report also discusses the existing water resources of the region including groundwater, treated sewage effluent, and desalination plants, with an analysis of their current state, challenges and the need for efficient water management policies. The report also includes a detailed methodology for building a water index, including a list of proposed water sustainability indicators, their units of measurement, and their position in the PSR framework.
Urban growth in arid environments: Developing water sustainability
indicators for Abu Dhabi (UAE).
Huda Alsalmi
Professor Hisham Elkadi
Dr.Simone Leao
Deakin University
Melbourne, Australia
E: hkals@deakin.edu.au
hisham.elkadi@deakin.edu.au
simone.leao@deakin.edu.au
Paper Presented at the
6th Making Cities Liveable Conference, in conjunction with the Sustainable Transformation
Conference, Melbourne (VIC), 17-19 June 2013
1
Paraphrase This Document
Need a fresh take? Get an instant paraphrase of this document with our AI Paraphraser
Urban growth in arid environments: Developing water sustainability
indicators for Abu Dhabi (UAE).
Abstract
The United Arab Emirates (UAE) face a serious water problem. It has a very dry climate, high
evaporation rate, combined with large water consumption from fast growing population,
economic activities and uncontrolled uses of water for irrigation. Currently, UAE has one of the
largest water footprints in the world. Groundwater is overexploited. Waste water is increasingly
being treated to supply non-drinking water, but it still cover a small proportion of the demand.
Desalination of sea water is the main source of potable water in UAE, but the high economic cost
of desalination, its intensive energy demand and the adverse effects of its effluents on the marine
life are a major concern. Other factors contributing to the problem are the focus of water
management policies on keep supplying the growing demand for water, the increase of the per
capita water consumption, and the free water charge for most of population.
This research goal is to develop a water sustainability set of indicators for the challenging
context of UAE. This paper presents the first stage of the research. Based on a review of the
literature, the proposed framework involves 19 indicators, divided into four categories: water
availability; water quality; water use efficiency; and policy and governance. Using an integrated
cause-effect approach (DSR – Driving force, State, Response), the indicators were related in
terms of their interdependencies, with a holistic view of the city water cycle.
A preliminary test of the indicators to Abu Dhabi as a case study allowed an evaluation of the
main ‘Driving force’ on the system, such as the scarcity of water due to natural constraints of the
region, and increasing water consumption patterns of modern society; an assessment of the
current ‘state’, which is under serious water stress. Also it indicated some potential ‘responses’,
such as implementing policies for increasing efficient use.
Keywords: Sustainable development, Water indicators, Abu Dhabi Water, Sustainability Index
2
Introduction
According to United Nations World Water Assessment Programme (WWAP), Water represents a
global challenge for the 21st century, in the management of available water resources and the
provision of access to drinking water and sanitation (UN 2010). In January 1992, a group of
environmental expert met in Dublin, on Water and the Environment conference and called for
new approaches to the assessment and management of water resources (UN 1992). The outcome
of this conference was the Dublin statement on water and sustainability development with four
guiding principles, which are principle “Fresh water is a finite and vulnerable resource, essential to
sustain life, development and the environment” , “Water development and management should be based
on a participatory approach, involving users, planners and policy-makers at all levels ” Women play a
central part in the provision, management and safeguarding of water” and the fourth principle is
“Water has an economic value in all its competing uses and should be recognized as an economic good” . The
UN Conference on Environment and Development (UNCED) in Rio in June 1992, recommend
countries to apply Dublin principle and transfer it to action plan to manage their water resources.
Agenda 21 chapter 18 stated that “integrated water resource management is based on the
perception of water as an integral part of the ecosystem, a natural resource and a social and
economic good, whose quantity and quality determine the nature of its utilisation” (UN 1992).
The purpose of this paper is to develop water sustainability index for Abu Dhabi Emirate.
The developed indicators can provide reliable guidance to decision making. The paper consist
reviews the city practice in water aspect, methodology, development of Abu Dhabi water index
result and discussion.
Water crises in Abu Dhabi (UAE)
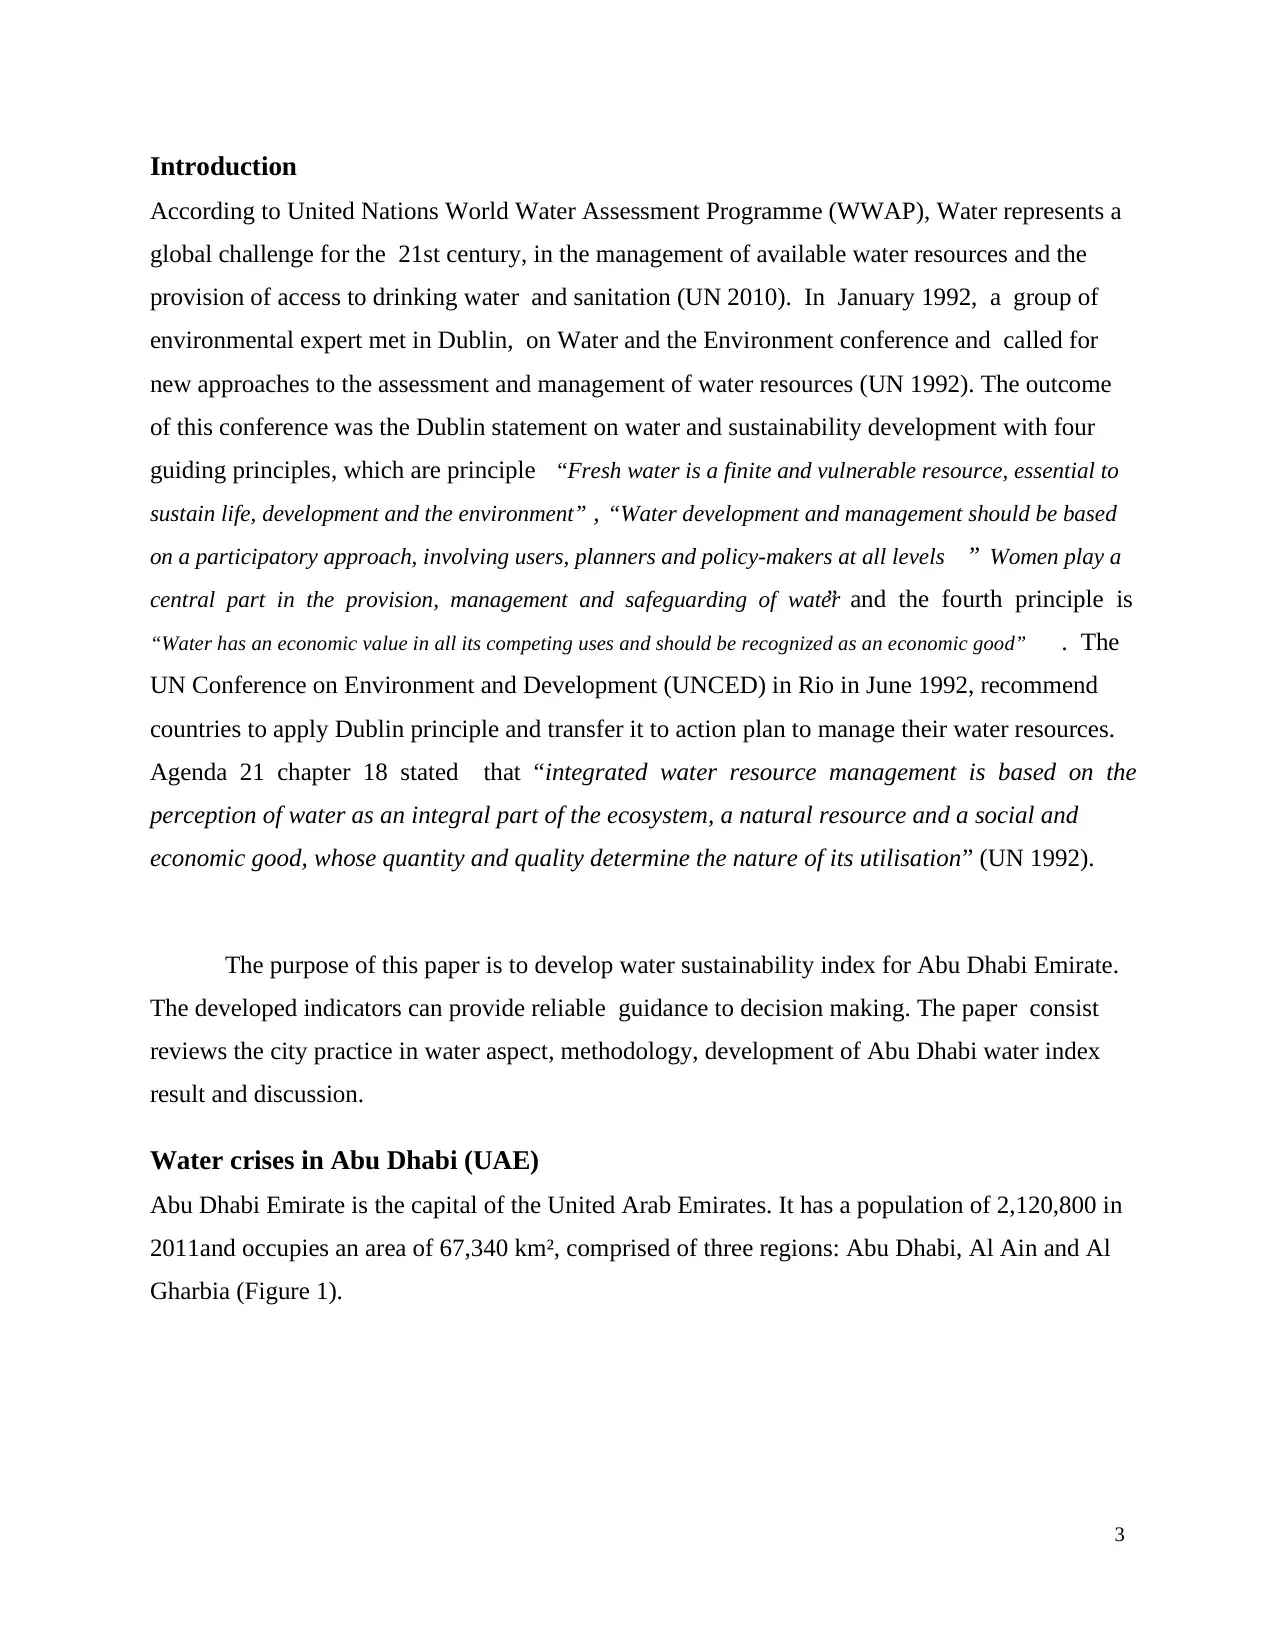
Abu Dhabi Emirate is the capital of the United Arab Emirates. It has a population of 2,120,800 in
2011and occupies an area of 67,340 km², comprised of three regions: Abu Dhabi, Al Ain and Al
Gharbia (Figure 1).
3
According to United Nations World Water Assessment Programme (WWAP), Water represents a
global challenge for the 21st century, in the management of available water resources and the
provision of access to drinking water and sanitation (UN 2010). In January 1992, a group of
environmental expert met in Dublin, on Water and the Environment conference and called for
new approaches to the assessment and management of water resources (UN 1992). The outcome
of this conference was the Dublin statement on water and sustainability development with four
guiding principles, which are principle “Fresh water is a finite and vulnerable resource, essential to
sustain life, development and the environment” , “Water development and management should be based
on a participatory approach, involving users, planners and policy-makers at all levels ” Women play a
central part in the provision, management and safeguarding of water” and the fourth principle is
“Water has an economic value in all its competing uses and should be recognized as an economic good” . The
UN Conference on Environment and Development (UNCED) in Rio in June 1992, recommend
countries to apply Dublin principle and transfer it to action plan to manage their water resources.
Agenda 21 chapter 18 stated that “integrated water resource management is based on the
perception of water as an integral part of the ecosystem, a natural resource and a social and
economic good, whose quantity and quality determine the nature of its utilisation” (UN 1992).
The purpose of this paper is to develop water sustainability index for Abu Dhabi Emirate.
The developed indicators can provide reliable guidance to decision making. The paper consist
reviews the city practice in water aspect, methodology, development of Abu Dhabi water index
result and discussion.
Water crises in Abu Dhabi (UAE)
Abu Dhabi Emirate is the capital of the United Arab Emirates. It has a population of 2,120,800 in
2011and occupies an area of 67,340 km², comprised of three regions: Abu Dhabi, Al Ain and Al
Gharbia (Figure 1).
3
⊘ This is a preview!⊘
Do you want full access?
Subscribe today to unlock all pages.
Trusted by 1+ million students worldwide
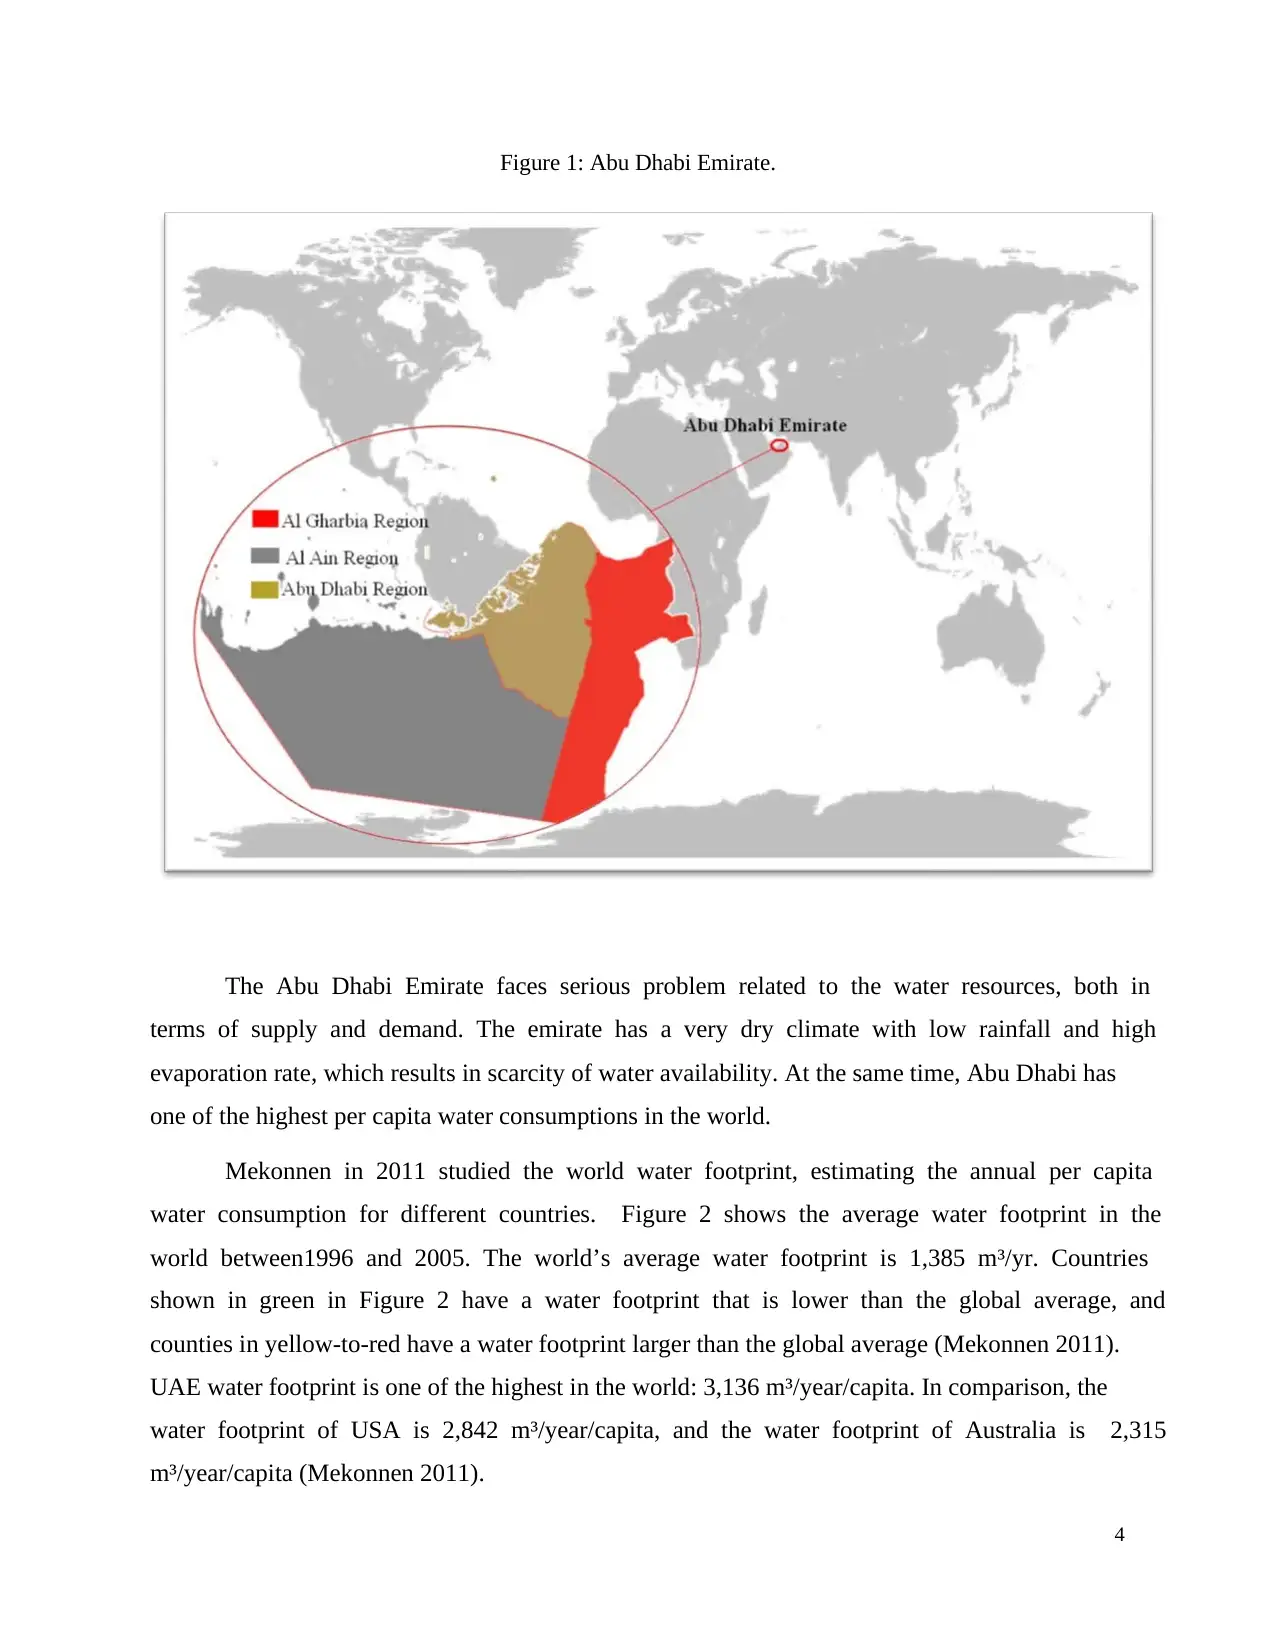
Figure 1: Abu Dhabi Emirate.
The Abu Dhabi Emirate faces serious problem related to the water resources, both in
terms of supply and demand. The emirate has a very dry climate with low rainfall and high
evaporation rate, which results in scarcity of water availability. At the same time, Abu Dhabi has
one of the highest per capita water consumptions in the world.
Mekonnen in 2011 studied the world water footprint, estimating the annual per capita
water consumption for different countries. Figure 2 shows the average water footprint in the
world between1996 and 2005. The world’s average water footprint is 1,385 m³/yr. Countries
shown in green in Figure 2 have a water footprint that is lower than the global average, and
counties in yellow-to-red have a water footprint larger than the global average (Mekonnen 2011).
UAE water footprint is one of the highest in the world: 3,136 m³/year/capita. In comparison, the
water footprint of USA is 2,842 m³/year/capita, and the water footprint of Australia is 2,315
m³/year/capita (Mekonnen 2011).
4
Paraphrase This Document
Need a fresh take? Get an instant paraphrase of this document with our AI Paraphraser
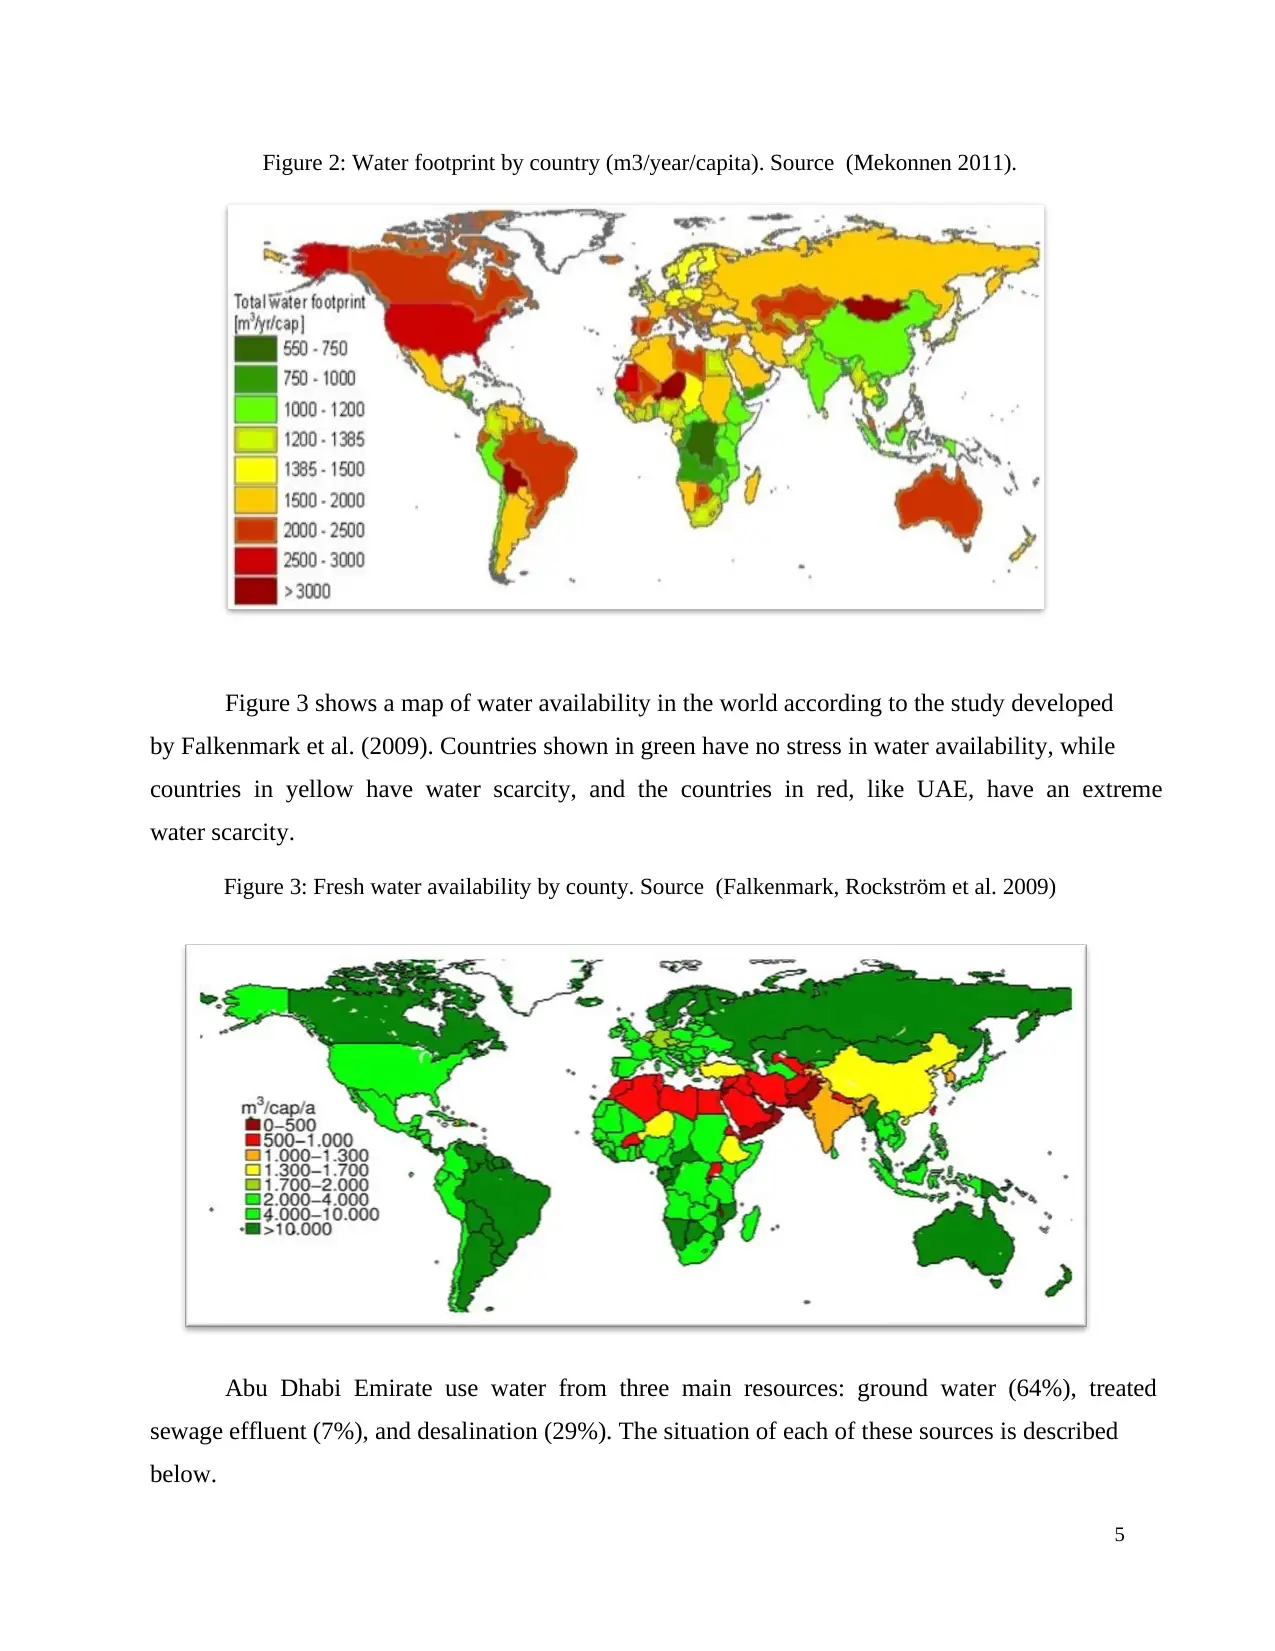
Figure 2: Water footprint by country (m3/year/capita). Source (Mekonnen 2011).
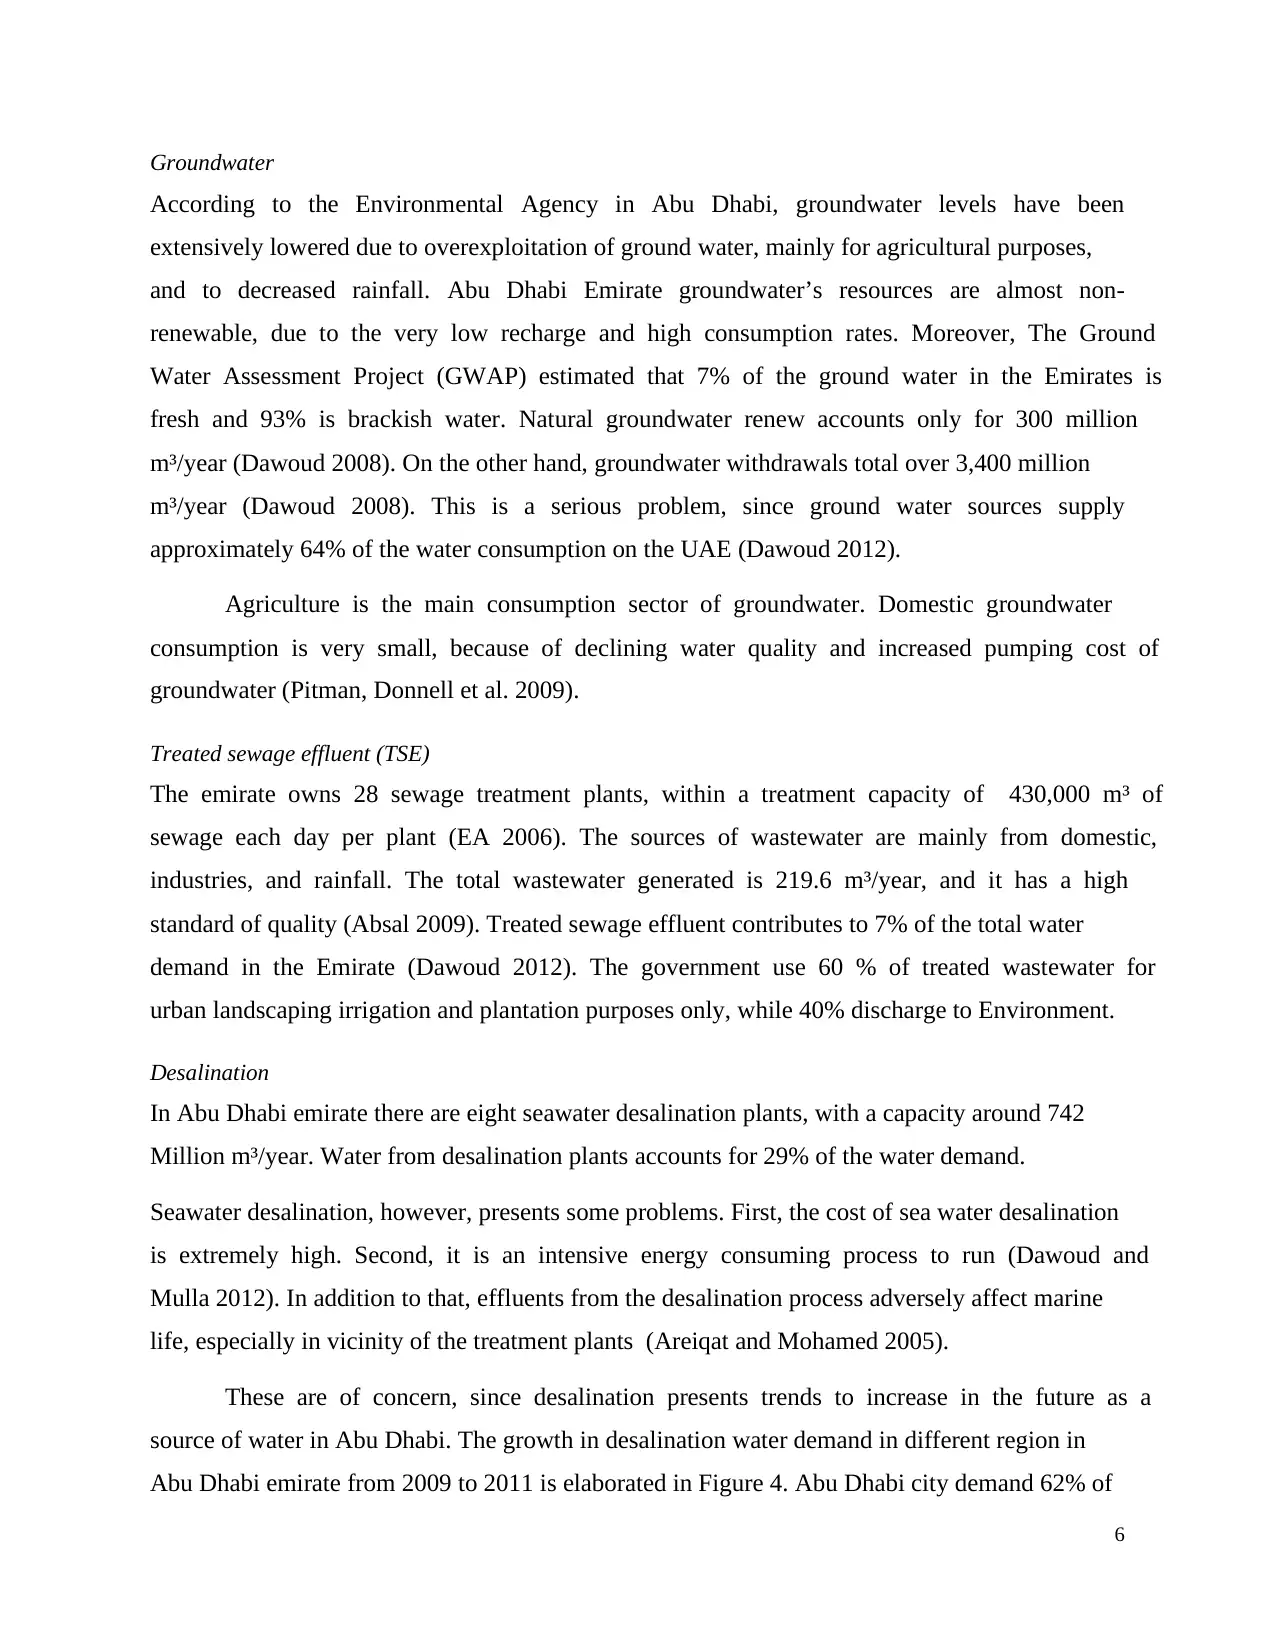
Figure 3 shows a map of water availability in the world according to the study developed
by Falkenmark et al. (2009). Countries shown in green have no stress in water availability, while
countries in yellow have water scarcity, and the countries in red, like UAE, have an extreme
water scarcity.
Figure 3: Fresh water availability by county. Source (Falkenmark, Rockström et al. 2009)
Abu Dhabi Emirate use water from three main resources: ground water (64%), treated
sewage effluent (7%), and desalination (29%). The situation of each of these sources is described
below.
5
Groundwater
According to the Environmental Agency in Abu Dhabi, groundwater levels have been
extensively lowered due to overexploitation of ground water, mainly for agricultural purposes,
and to decreased rainfall. Abu Dhabi Emirate groundwater’s resources are almost non-
renewable, due to the very low recharge and high consumption rates. Moreover, The Ground
Water Assessment Project (GWAP) estimated that 7% of the ground water in the Emirates is
fresh and 93% is brackish water. Natural groundwater renew accounts only for 300 million
m³/year (Dawoud 2008). On the other hand, groundwater withdrawals total over 3,400 million
m³/year (Dawoud 2008). This is a serious problem, since ground water sources supply
approximately 64% of the water consumption on the UAE (Dawoud 2012).
Agriculture is the main consumption sector of groundwater. Domestic groundwater
consumption is very small, because of declining water quality and increased pumping cost of
groundwater (Pitman, Donnell et al. 2009).
Treated sewage effluent (TSE)
The emirate owns 28 sewage treatment plants, within a treatment capacity of 430,000 m³ of
sewage each day per plant (EA 2006). The sources of wastewater are mainly from domestic,
industries, and rainfall. The total wastewater generated is 219.6 m³/year, and it has a high
standard of quality (Absal 2009). Treated sewage effluent contributes to 7% of the total water
demand in the Emirate (Dawoud 2012). The government use 60 % of treated wastewater for
urban landscaping irrigation and plantation purposes only, while 40% discharge to Environment.
Desalination
In Abu Dhabi emirate there are eight seawater desalination plants, with a capacity around 742
Million m³/year. Water from desalination plants accounts for 29% of the water demand.
Seawater desalination, however, presents some problems. First, the cost of sea water desalination
is extremely high. Second, it is an intensive energy consuming process to run (Dawoud and
Mulla 2012). In addition to that, effluents from the desalination process adversely affect marine
life, especially in vicinity of the treatment plants (Areiqat and Mohamed 2005).
These are of concern, since desalination presents trends to increase in the future as a
source of water in Abu Dhabi. The growth in desalination water demand in different region in
Abu Dhabi emirate from 2009 to 2011 is elaborated in Figure 4. Abu Dhabi city demand 62% of
6
⊘ This is a preview!⊘
Do you want full access?
Subscribe today to unlock all pages.
Trusted by 1+ million students worldwide
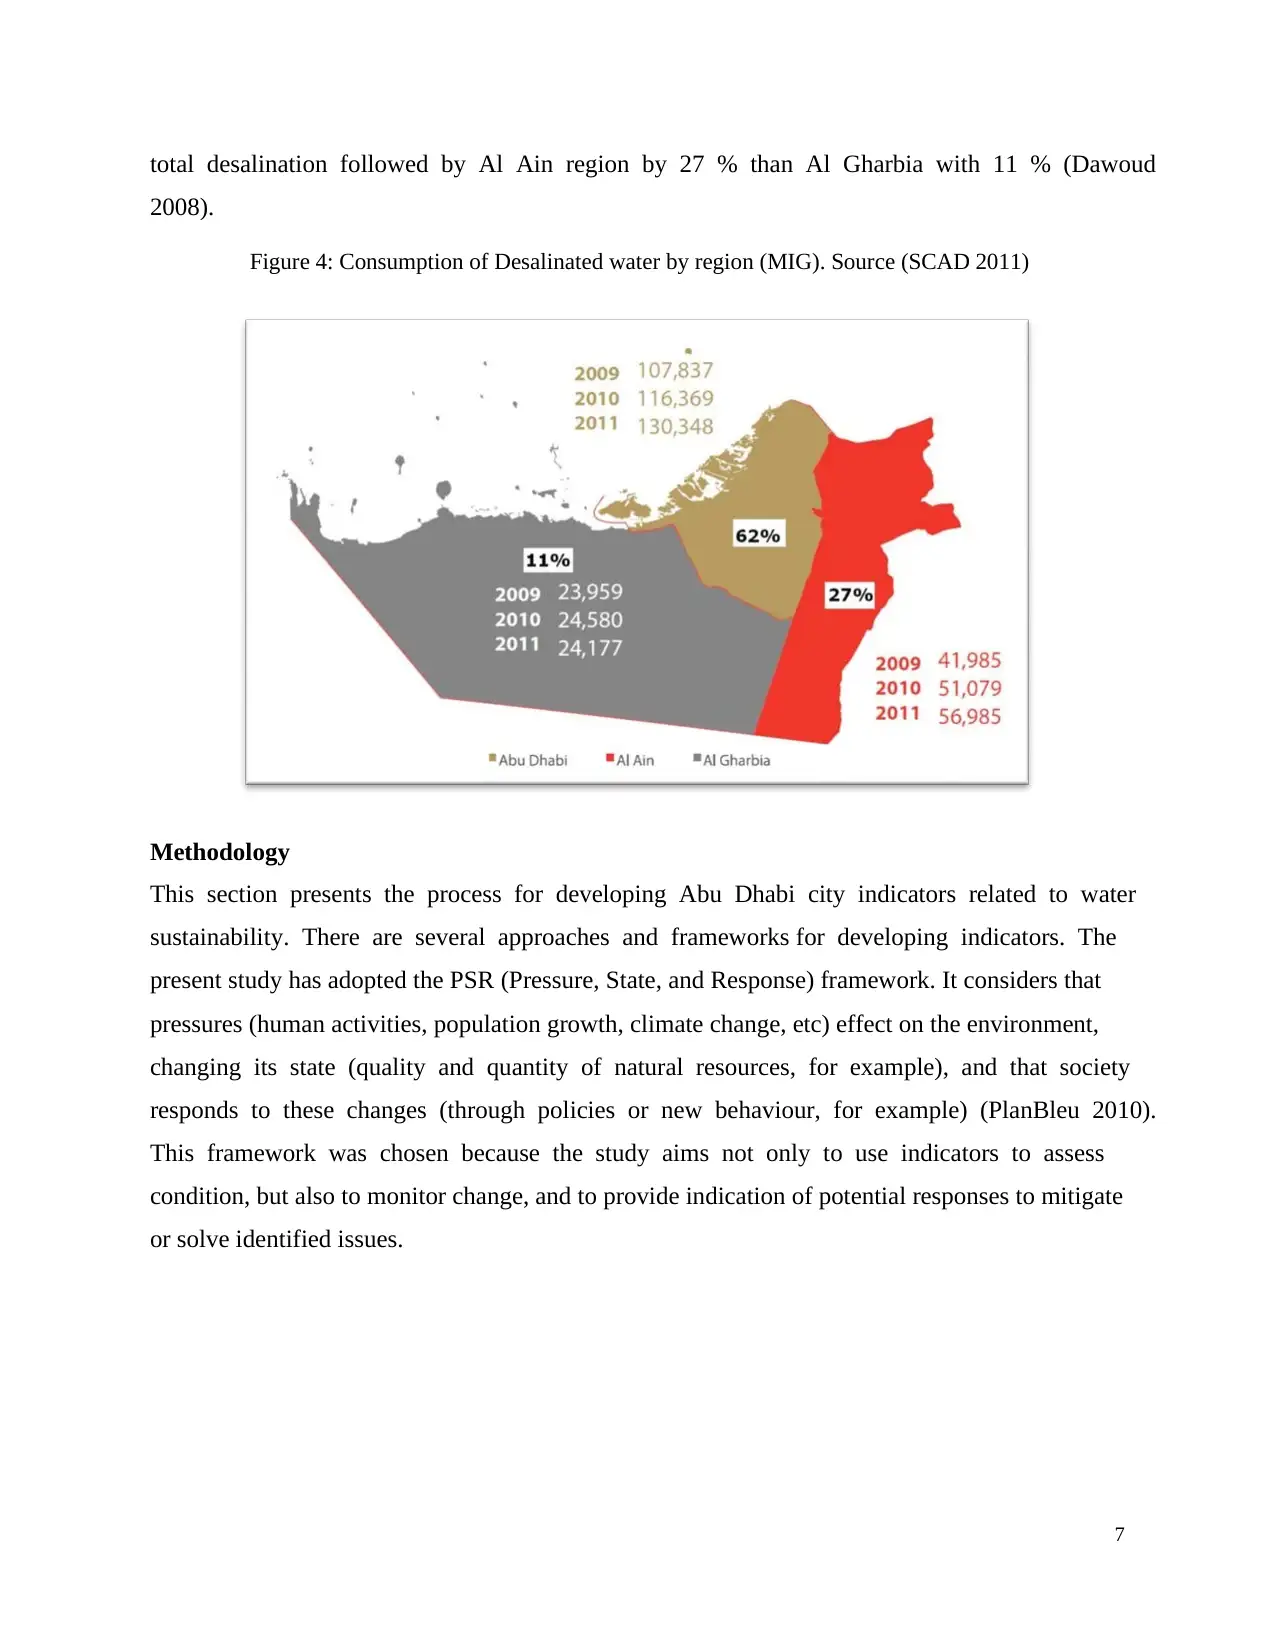
total desalination followed by Al Ain region by 27 % than Al Gharbia with 11 % (Dawoud
2008).
Figure 4: Consumption of Desalinated water by region (MIG). Source (SCAD 2011)
Methodology
This section presents the process for developing Abu Dhabi city indicators related to water
sustainability. There are several approaches and frameworks for developing indicators. The
present study has adopted the PSR (Pressure, State, and Response) framework. It considers that
pressures (human activities, population growth, climate change, etc) effect on the environment,
changing its state (quality and quantity of natural resources, for example), and that society
responds to these changes (through policies or new behaviour, for example) (PlanBleu 2010).
This framework was chosen because the study aims not only to use indicators to assess
condition, but also to monitor change, and to provide indication of potential responses to mitigate
or solve identified issues.
7
Paraphrase This Document
Need a fresh take? Get an instant paraphrase of this document with our AI Paraphraser
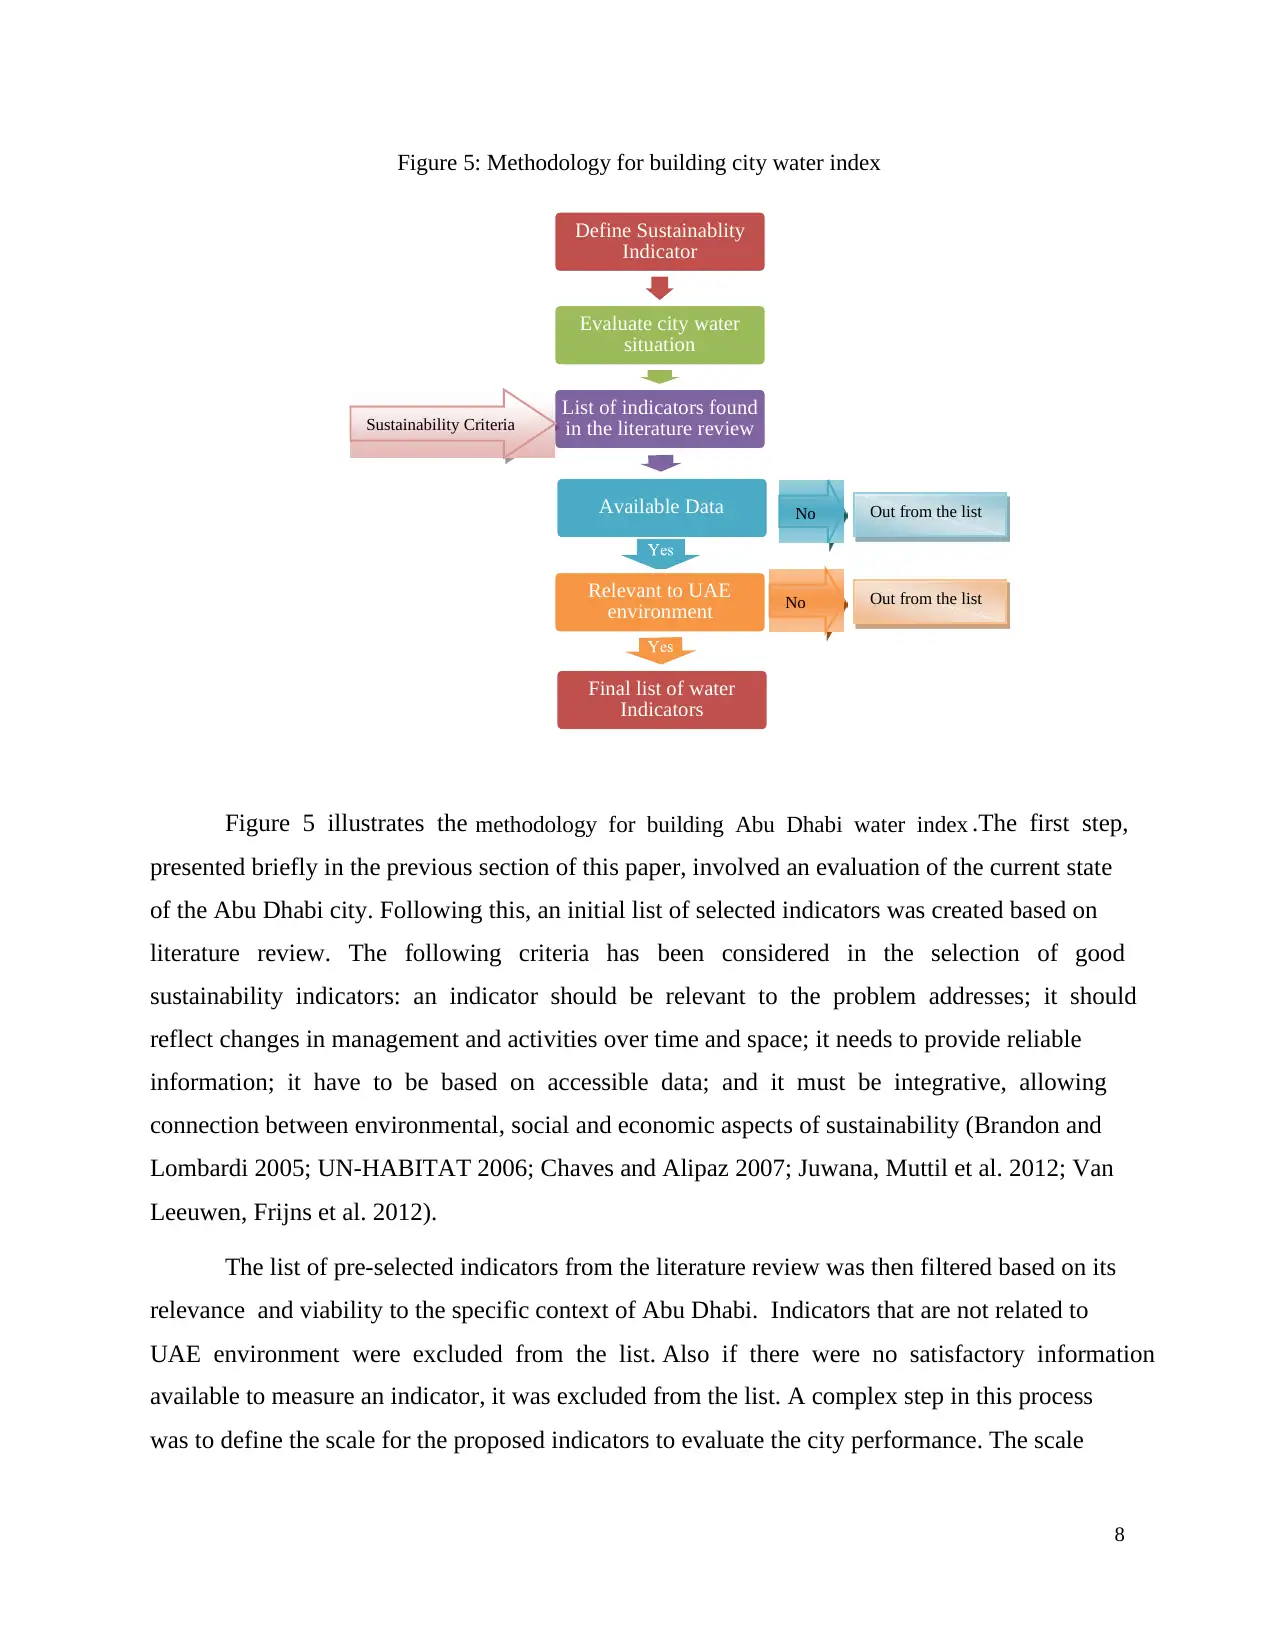
Figure 5: Methodology for building city water index
Figure 5 illustrates the methodology for building Abu Dhabi water index .The first step,
presented briefly in the previous section of this paper, involved an evaluation of the current state
of the Abu Dhabi city. Following this, an initial list of selected indicators was created based on
literature review. The following criteria has been considered in the selection of good
sustainability indicators: an indicator should be relevant to the problem addresses; it should
reflect changes in management and activities over time and space; it needs to provide reliable
information; it have to be based on accessible data; and it must be integrative, allowing
connection between environmental, social and economic aspects of sustainability (Brandon and
Lombardi 2005; UN-HABITAT 2006; Chaves and Alipaz 2007; Juwana, Muttil et al. 2012; Van
Leeuwen, Frijns et al. 2012).
The list of pre-selected indicators from the literature review was then filtered based on its
relevance and viability to the specific context of Abu Dhabi. Indicators that are not related to
UAE environment were excluded from the list. Also if there were no satisfactory information
available to measure an indicator, it was excluded from the list. A complex step in this process
was to define the scale for the proposed indicators to evaluate the city performance. The scale
Define Sustainablity
Indicator
Evaluate city water
situation
List of indicators found
in the literature review
Available Data
Relevant to UAE
environment
Final list of water
Indicators
No Out from the list
No Out from the list
Sustainability Criteria
8
was defined by benchmarking each indicator in relation to performance in different countries
reported in the literature.
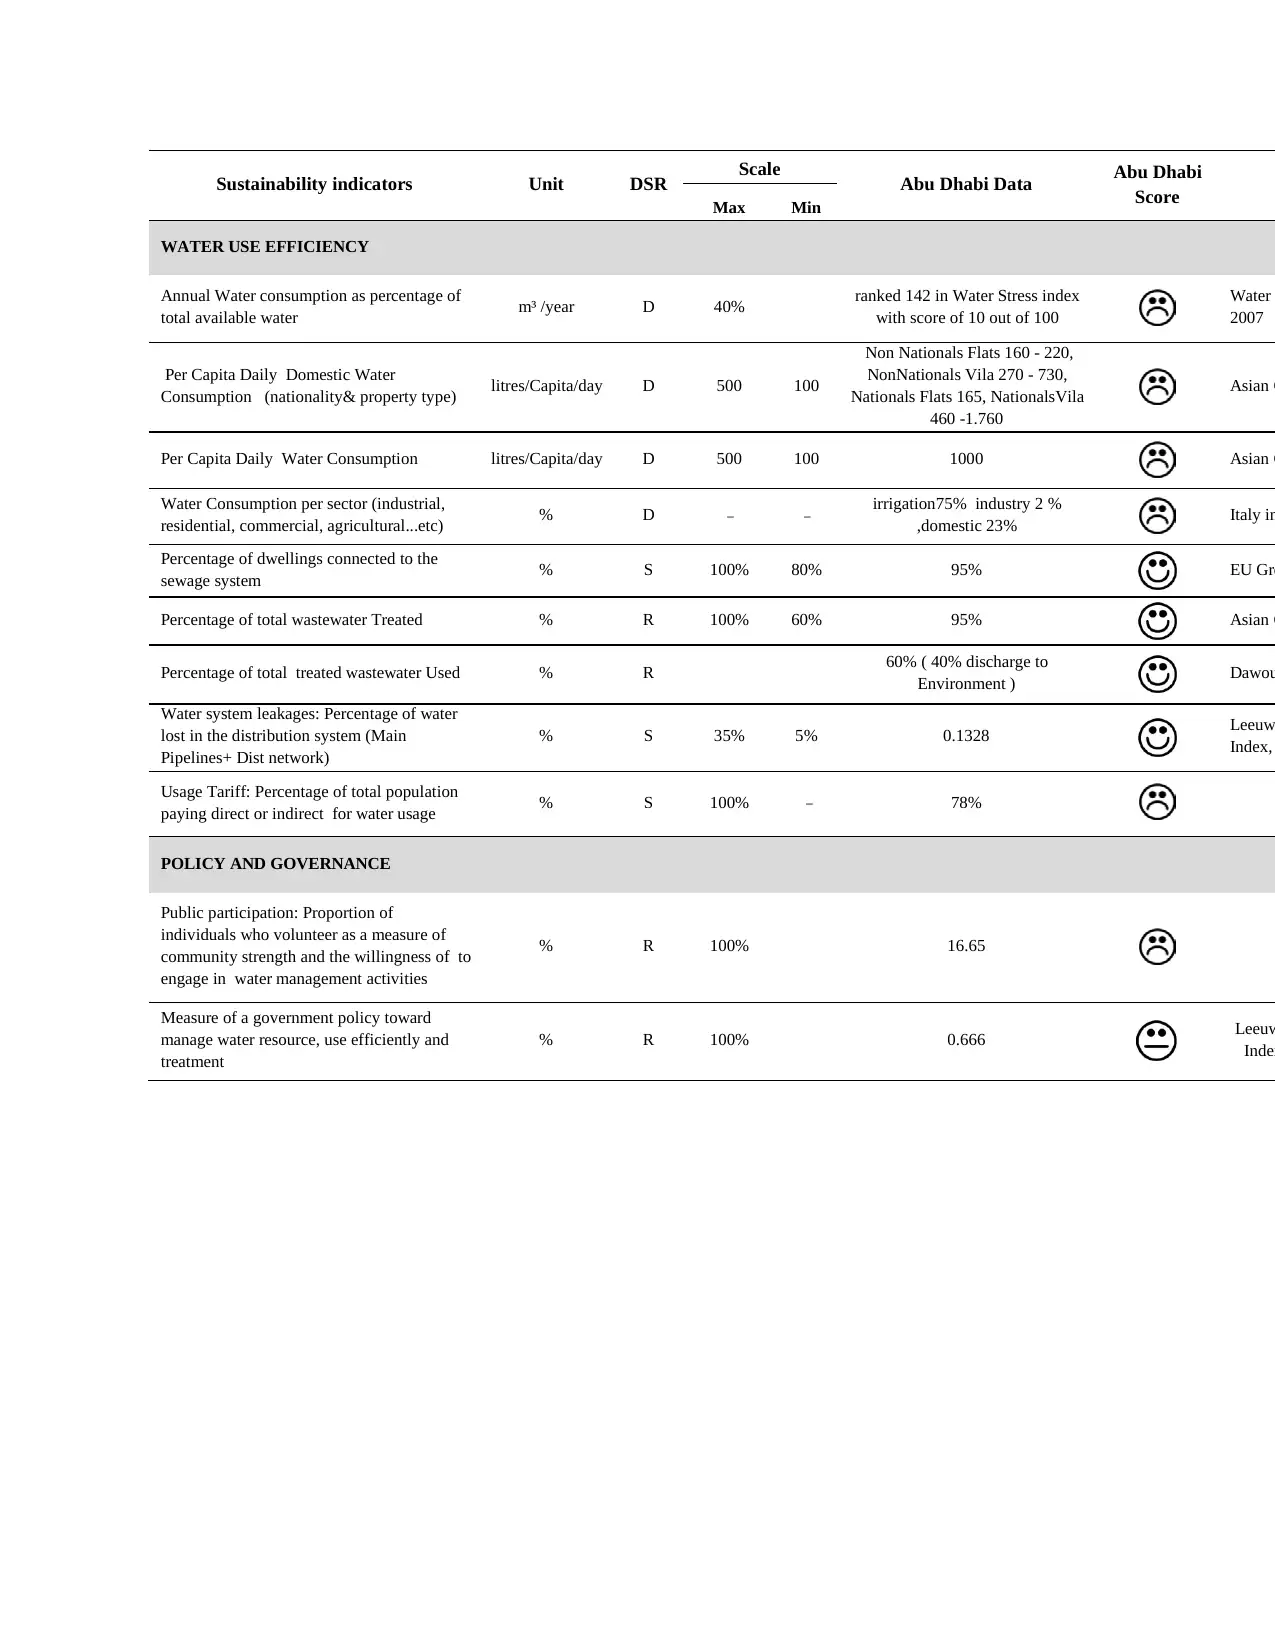
Table 1 presents the result from this process. It lists the selected indicators related to
water sustainability for the Abu Dhabi City, divided into four dimensions: water availability,
water quality, water use efficiency, and policy and governance. Each indicator is described in
terms of its scope, unit of measurement, position in the PSR framework, scale based on
benchmarking, available data for Abu Dhabi, and a preliminary qualitative score indication, and
references in which the data or concept is based. These indicators are discussed in the following
section.
9
reported in the literature.
Table 1 presents the result from this process. It lists the selected indicators related to
water sustainability for the Abu Dhabi City, divided into four dimensions: water availability,
water quality, water use efficiency, and policy and governance. Each indicator is described in
terms of its scope, unit of measurement, position in the PSR framework, scale based on
benchmarking, available data for Abu Dhabi, and a preliminary qualitative score indication, and
references in which the data or concept is based. These indicators are discussed in the following
section.
9
⊘ This is a preview!⊘
Do you want full access?
Subscribe today to unlock all pages.
Trusted by 1+ million students worldwide
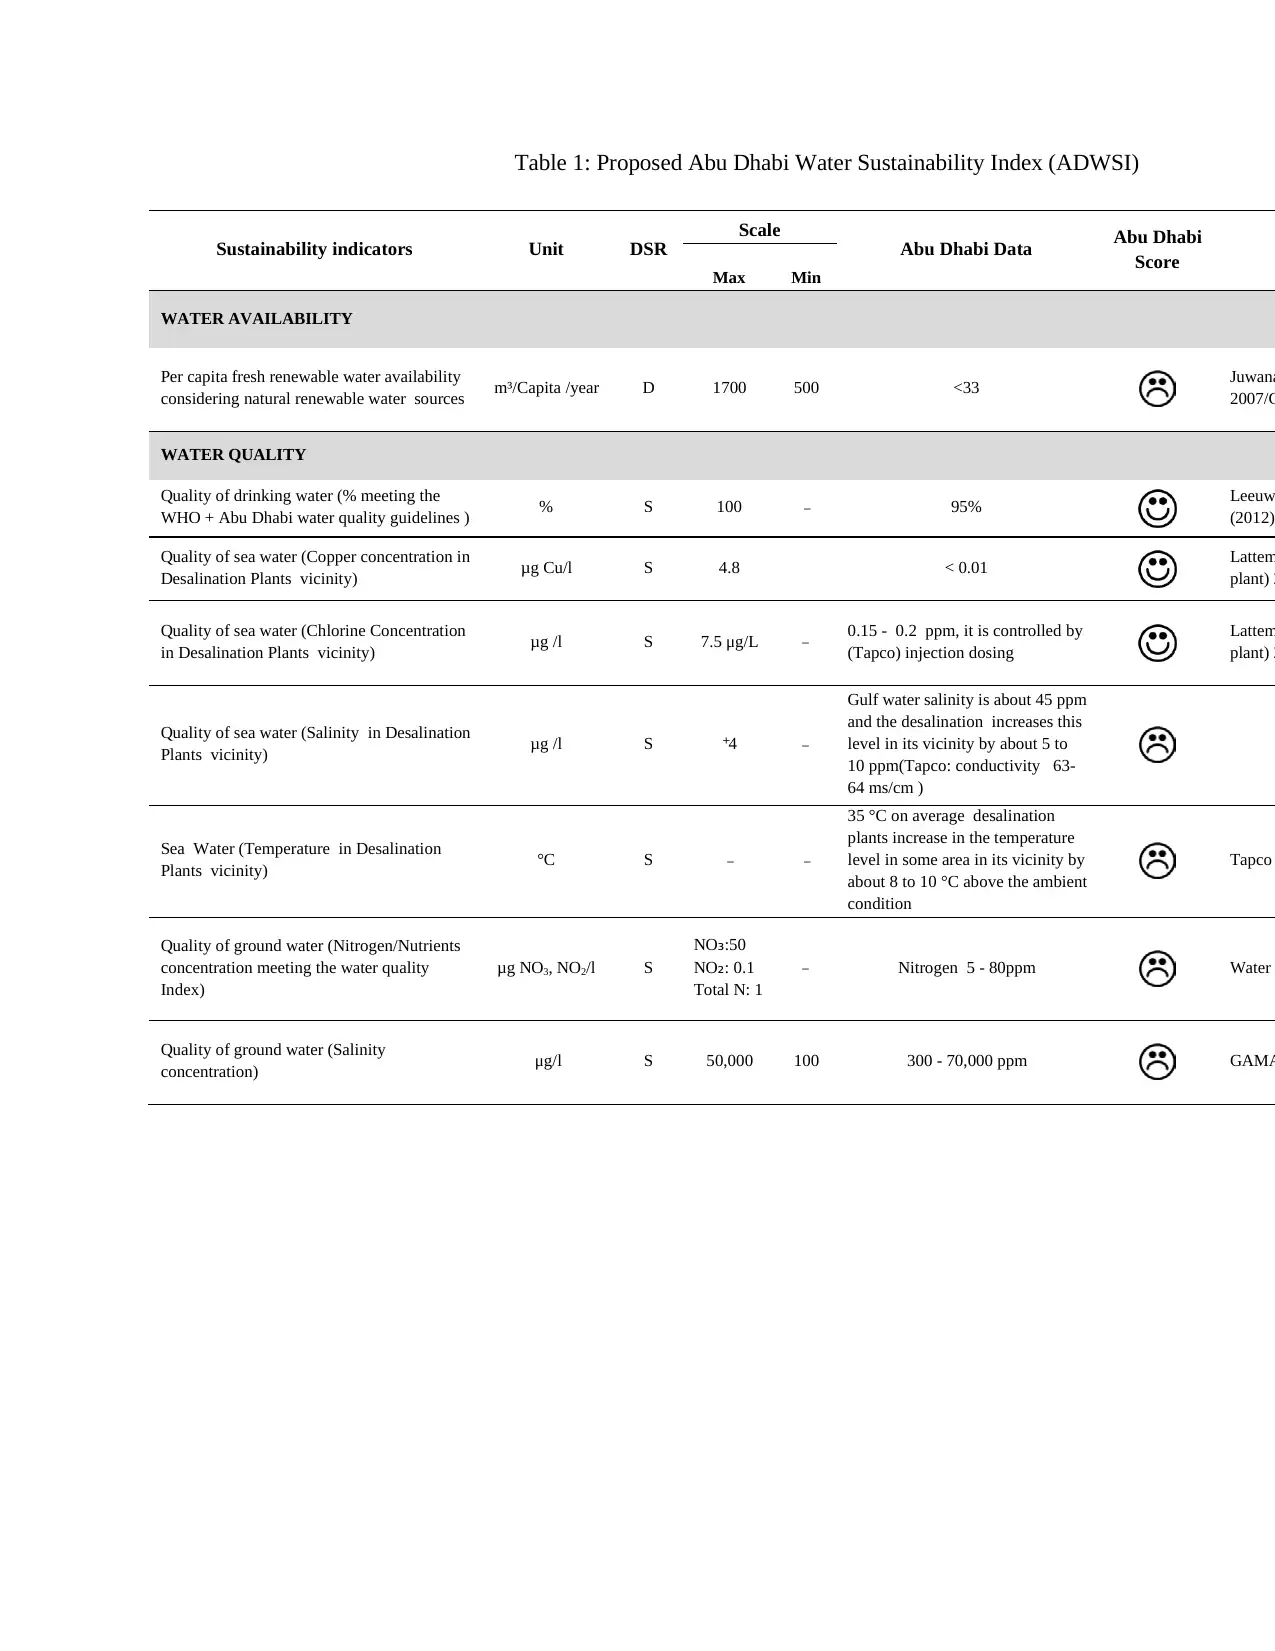
Table 1: Proposed Abu Dhabi Water Sustainability Index (ADWSI)
Sustainability indicators Unit DSR
Scale
Abu Dhabi Data Abu Dhabi
Score
Max Min
WATER AVAILABILITY
Per capita fresh renewable water availability
considering natural renewable water sources m³/Capita /year D 1700 500 <33 Juwana
2007/C
WATER QUALITY
Quality of drinking water (% meeting the
WHO + Abu Dhabi water quality guidelines ) % S 100 ₋ 95% Leeuw
(2012)
Quality of sea water (Copper concentration in
Desalination Plants vicinity) μg Cu/l S 4.8 < 0.01 Lattem
plant) 2
Quality of sea water (Chlorine Concentration
in Desalination Plants vicinity) μg /l S 7.5 μg/L ₋ 0.15 - 0.2 ppm, it is controlled by
(Tapco) injection dosing
Lattem
plant) 2
Quality of sea water (Salinity in Desalination
Plants vicinity) μg /l S ⁺4 ₋
Gulf water salinity is about 45 ppm
and the desalination increases this
level in its vicinity by about 5 to
10 ppm(Tapco: conductivity 63-
64 ms/cm )
Sea Water (Temperature in Desalination
Plants vicinity) °C S ₋ ₋
35 °C on average desalination
plants increase in the temperature
level in some area in its vicinity by
about 8 to 10 °C above the ambient
condition
Tapco
Quality of ground water (Nitrogen/Nutrients
concentration meeting the water quality
Index)
μg NO3, NO2/l S
NO₃:50
NO₂: 0.1
Total N: 1
₋ Nitrogen 5 - 80ppm Water
Quality of ground water (Salinity
concentration) μg/l S 50,000 100 300 - 70,000 ppm GAMA
Paraphrase This Document
Need a fresh take? Get an instant paraphrase of this document with our AI Paraphraser
Sustainability indicators Unit DSR Scale Abu Dhabi Data Abu Dhabi
Score
Max Min
WATER USE EFFICIENCY
Annual Water consumption as percentage of
total available water m³ /year D 40% ranked 142 in Water Stress index
with score of 10 out of 100
Water
2007
Per Capita Daily Domestic Water
Consumption (nationality& property type) litres/Capita/day D 500 100
Non Nationals Flats 160 - 220,
NonNationals Vila 270 - 730,
Nationals Flats 165, NationalsVila
460 -1.760
Asian G
Per Capita Daily Water Consumption litres/Capita/day D 500 100 1000 Asian G
Water Consumption per sector (industrial,
residential, commercial, agricultural...etc) % D ₋ ₋ irrigation75% industry 2 %
,domestic 23% Italy in
Percentage of dwellings connected to the
sewage system % S 100% 80% 95% EU Gre
Percentage of total wastewater Treated % R 100% 60% 95% Asian G
Percentage of total treated wastewater Used % R 60% ( 40% discharge to
Environment ) Dawou
Water system leakages: Percentage of water
lost in the distribution system (Main
Pipelines+ Dist network)
% S 35% 5% 0.1328 Leeuw
Index,
Usage Tariff: Percentage of total population
paying direct or indirect for water usage % S 100% ₋ 78%
POLICY AND GOVERNANCE
Public participation: Proportion of
individuals who volunteer as a measure of
community strength and the willingness of to
engage in water management activities
% R 100% 16.65
Measure of a government policy toward
manage water resource, use efficiently and
treatment
% R 100% 0.666 Leeuw
Index
Abu Dhabi Water Sustainability Index (ADWSI)
There is no clear set of sustainability indicators to evaluate urban water (Van Leeuwen, Frijns et
al. 2012). The developed indicators in Table 1 covered the main water challenges and concerns
in Abu Dhabi emirate, which are the following:
Water availability
According to Falkenmark (2004) ideally a person needs as much as 1,700 m³ of water/year to
support life, while below 1,000 m³/person/year water availability becomes scarce. The minimum
requirement is 500 m³ of water/person/year, and below this level the water will be extremely
scarce (Falkenmark and Rockstrom 2004).
Water quality
Water quality is a state indicator that usually refers to the physical, chemical, biological and
organoleptic properties of the water (UN 2010). Water quality is calculated by concentration of
chemicals and microbiological criteria and based on Abu Dhabi Water Quality Regulations 2009
and international standards such as World Health Organization standards WHO. In this study we
assessed the quality of ground water, drinking water and sea water as below:
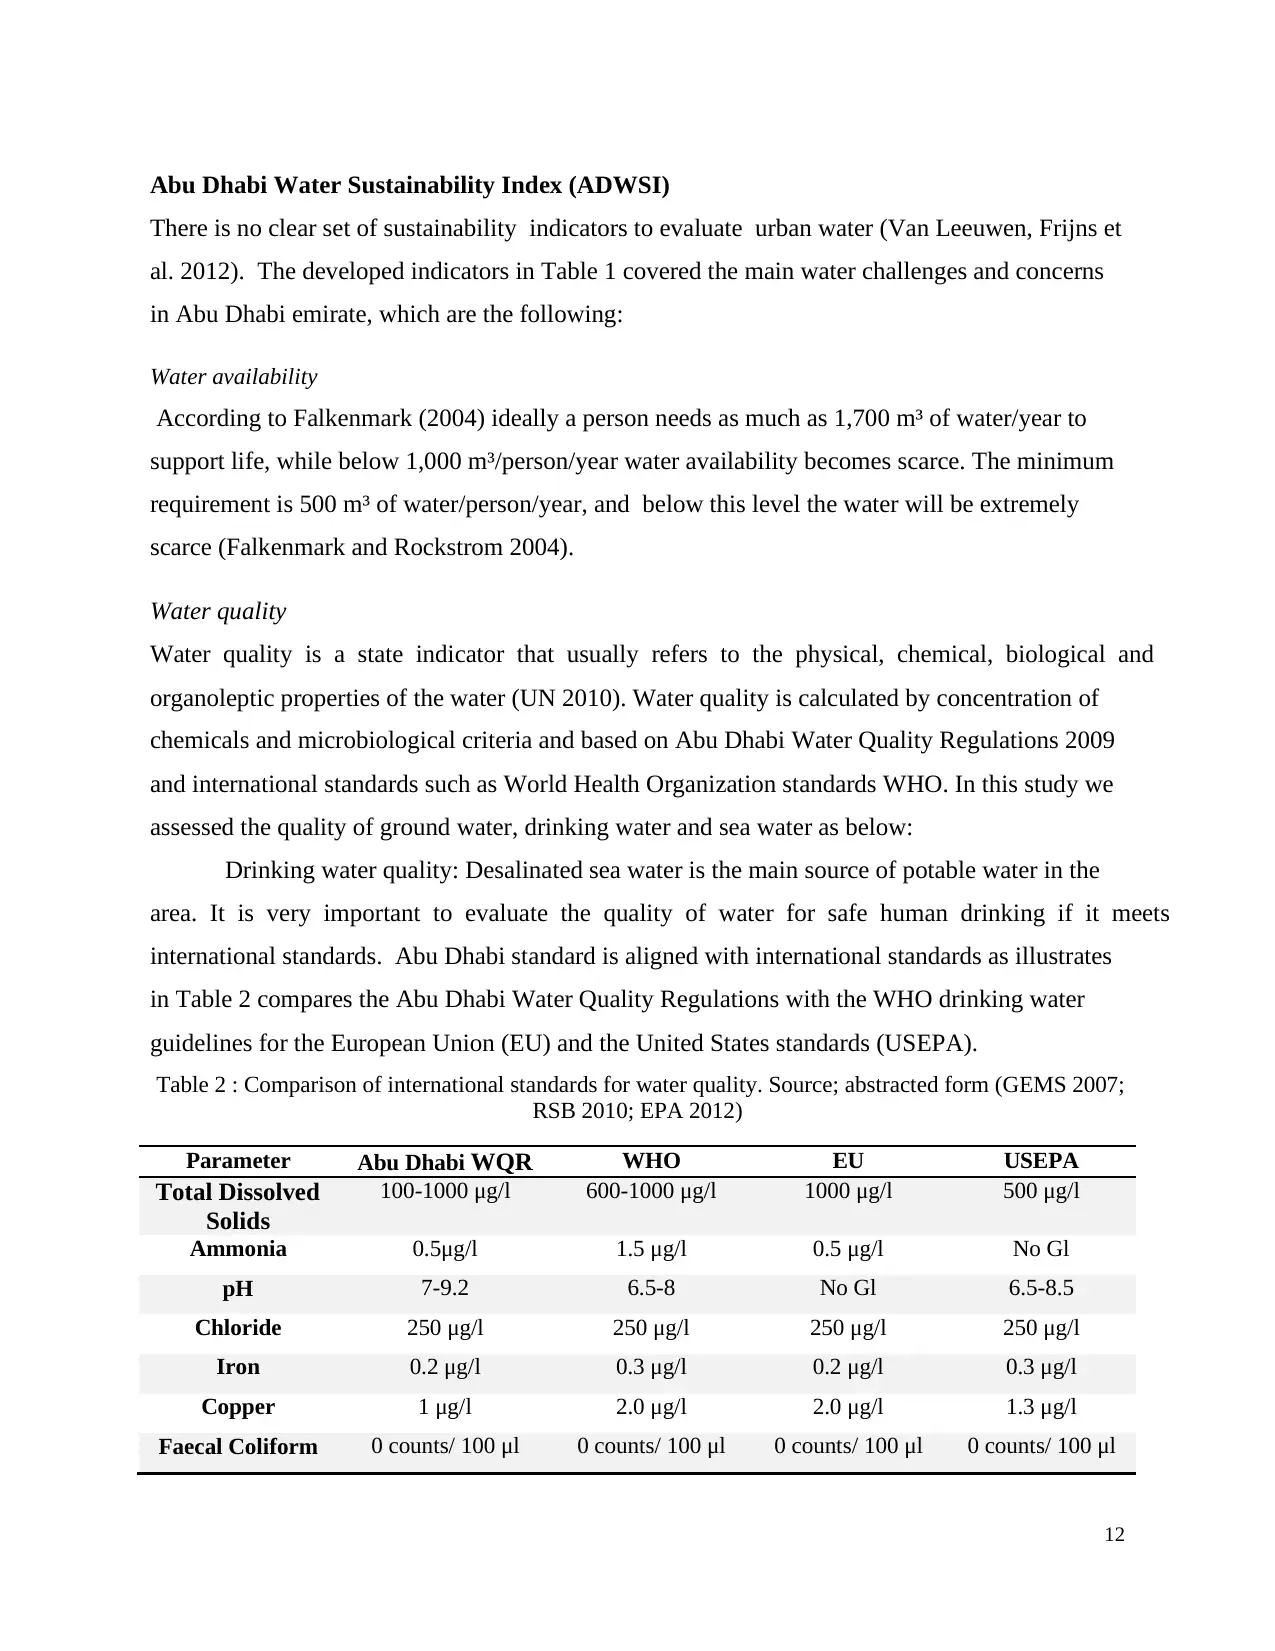
Drinking water quality: Desalinated sea water is the main source of potable water in the
area. It is very important to evaluate the quality of water for safe human drinking if it meets
international standards. Abu Dhabi standard is aligned with international standards as illustrates
in Table 2 compares the Abu Dhabi Water Quality Regulations with the WHO drinking water
guidelines for the European Union (EU) and the United States standards (USEPA).
Table 2 : Comparison of international standards for water quality. Source; abstracted form (GEMS 2007;
RSB 2010; EPA 2012)
Parameter Abu Dhabi WQR WHO EU USEPA
Total Dissolved
Solids
100-1000 μg/l 600-1000 μg/l 1000 μg/l 500 μg/l
Ammonia 0.5μg/l 1.5 μg/l 0.5 μg/l No Gl
pH 7-9.2 6.5-8 No Gl 6.5-8.5
Chloride 250 μg/l 250 μg/l 250 μg/l 250 μg/l
Iron 0.2 μg/l 0.3 μg/l 0.2 μg/l 0.3 μg/l
Copper 1 μg/l 2.0 μg/l 2.0 μg/l 1.3 μg/l
Faecal Coliform 0 counts/ 100 μl 0 counts/ 100 μl 0 counts/ 100 μl 0 counts/ 100 μl
12
There is no clear set of sustainability indicators to evaluate urban water (Van Leeuwen, Frijns et
al. 2012). The developed indicators in Table 1 covered the main water challenges and concerns
in Abu Dhabi emirate, which are the following:
Water availability
According to Falkenmark (2004) ideally a person needs as much as 1,700 m³ of water/year to
support life, while below 1,000 m³/person/year water availability becomes scarce. The minimum
requirement is 500 m³ of water/person/year, and below this level the water will be extremely
scarce (Falkenmark and Rockstrom 2004).
Water quality
Water quality is a state indicator that usually refers to the physical, chemical, biological and
organoleptic properties of the water (UN 2010). Water quality is calculated by concentration of
chemicals and microbiological criteria and based on Abu Dhabi Water Quality Regulations 2009
and international standards such as World Health Organization standards WHO. In this study we
assessed the quality of ground water, drinking water and sea water as below:
Drinking water quality: Desalinated sea water is the main source of potable water in the
area. It is very important to evaluate the quality of water for safe human drinking if it meets
international standards. Abu Dhabi standard is aligned with international standards as illustrates
in Table 2 compares the Abu Dhabi Water Quality Regulations with the WHO drinking water
guidelines for the European Union (EU) and the United States standards (USEPA).
Table 2 : Comparison of international standards for water quality. Source; abstracted form (GEMS 2007;
RSB 2010; EPA 2012)
Parameter Abu Dhabi WQR WHO EU USEPA
Total Dissolved
Solids
100-1000 μg/l 600-1000 μg/l 1000 μg/l 500 μg/l
Ammonia 0.5μg/l 1.5 μg/l 0.5 μg/l No Gl
pH 7-9.2 6.5-8 No Gl 6.5-8.5
Chloride 250 μg/l 250 μg/l 250 μg/l 250 μg/l
Iron 0.2 μg/l 0.3 μg/l 0.2 μg/l 0.3 μg/l
Copper 1 μg/l 2.0 μg/l 2.0 μg/l 1.3 μg/l
Faecal Coliform 0 counts/ 100 μl 0 counts/ 100 μl 0 counts/ 100 μl 0 counts/ 100 μl
12
⊘ This is a preview!⊘
Do you want full access?
Subscribe today to unlock all pages.
Trusted by 1+ million students worldwide
1 out of 22

Your All-in-One AI-Powered Toolkit for Academic Success.
+13062052269
info@desklib.com
Available 24*7 on WhatsApp / Email
![[object Object]](/_next/static/media/star-bottom.7253800d.svg)
Unlock your academic potential
Copyright © 2020–2026 A2Z Services. All Rights Reserved. Developed and managed by ZUCOL.