Practical Lab Report: Analyzing Water Use, Costs, and Conservation

Verified

Added on  2023/06/10

|8
|1548
|349
Practical Assignment
AI Summary
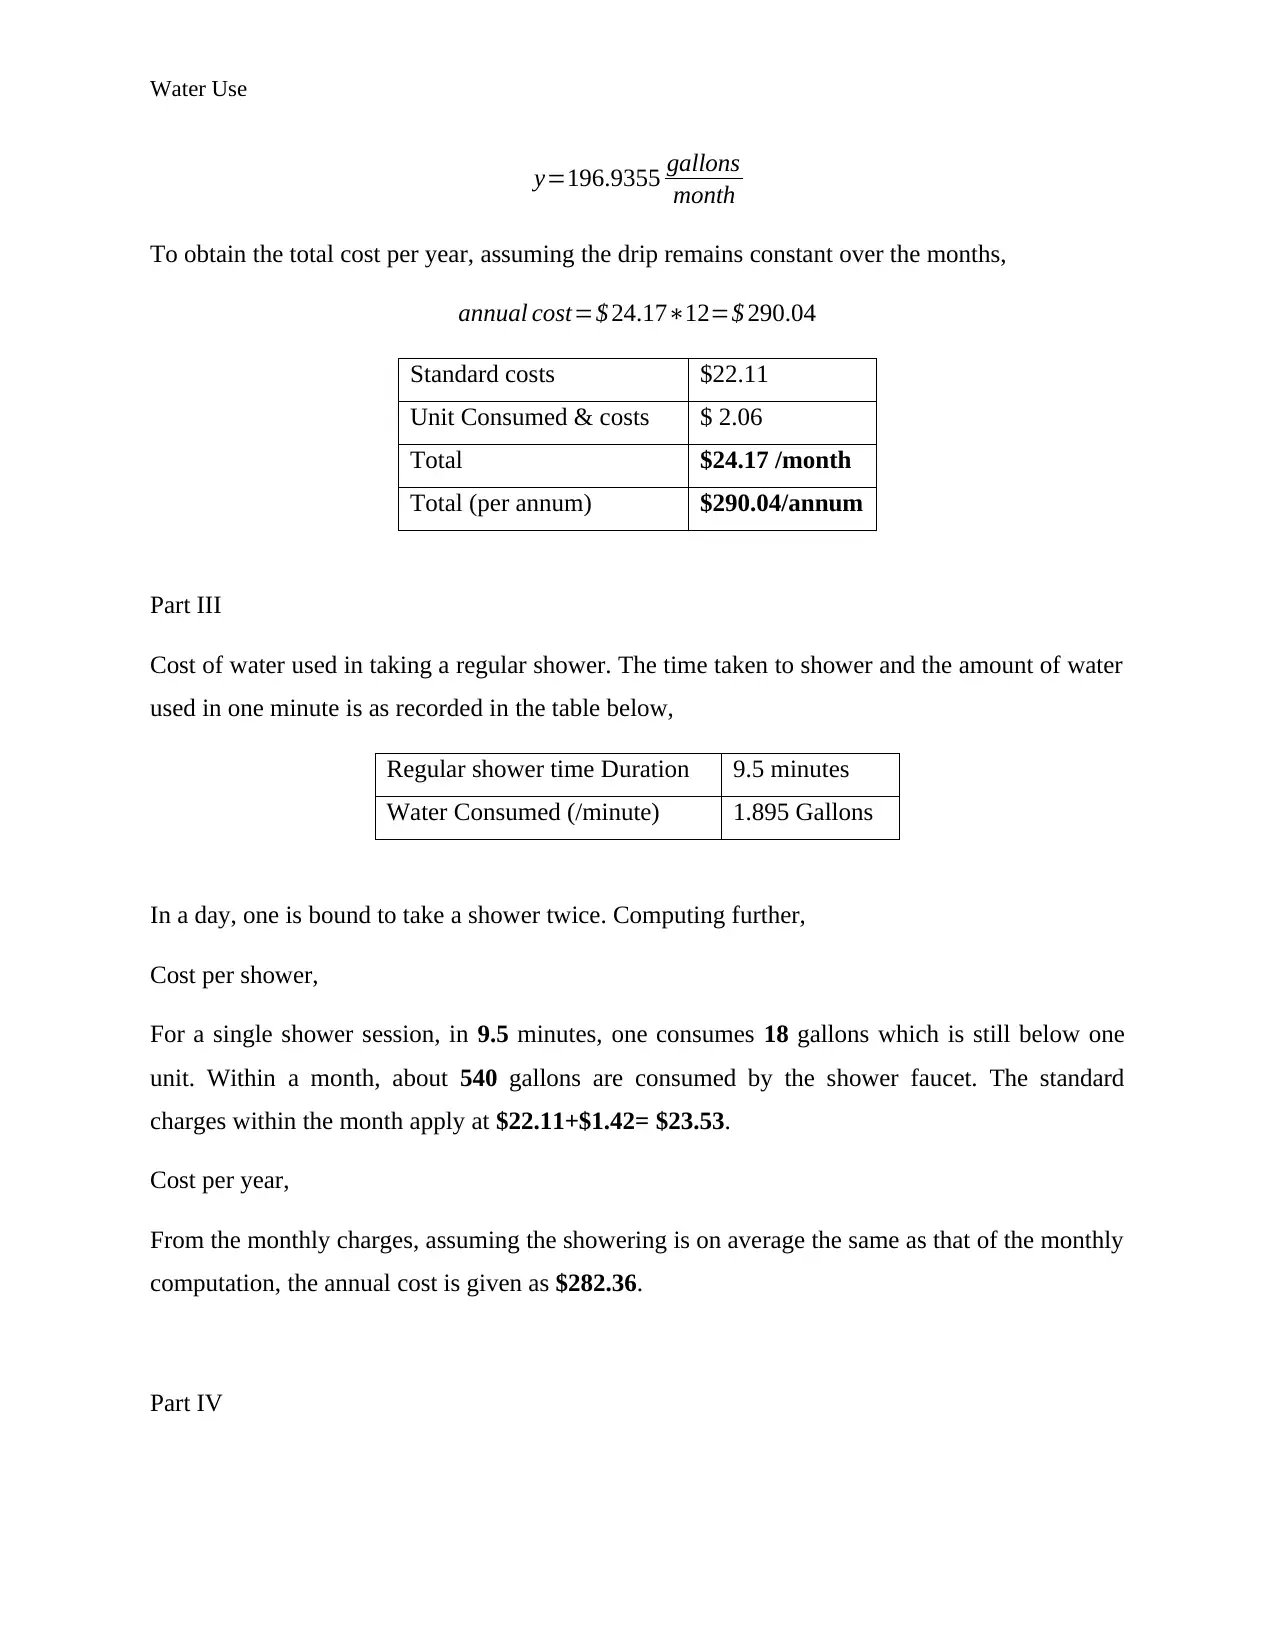
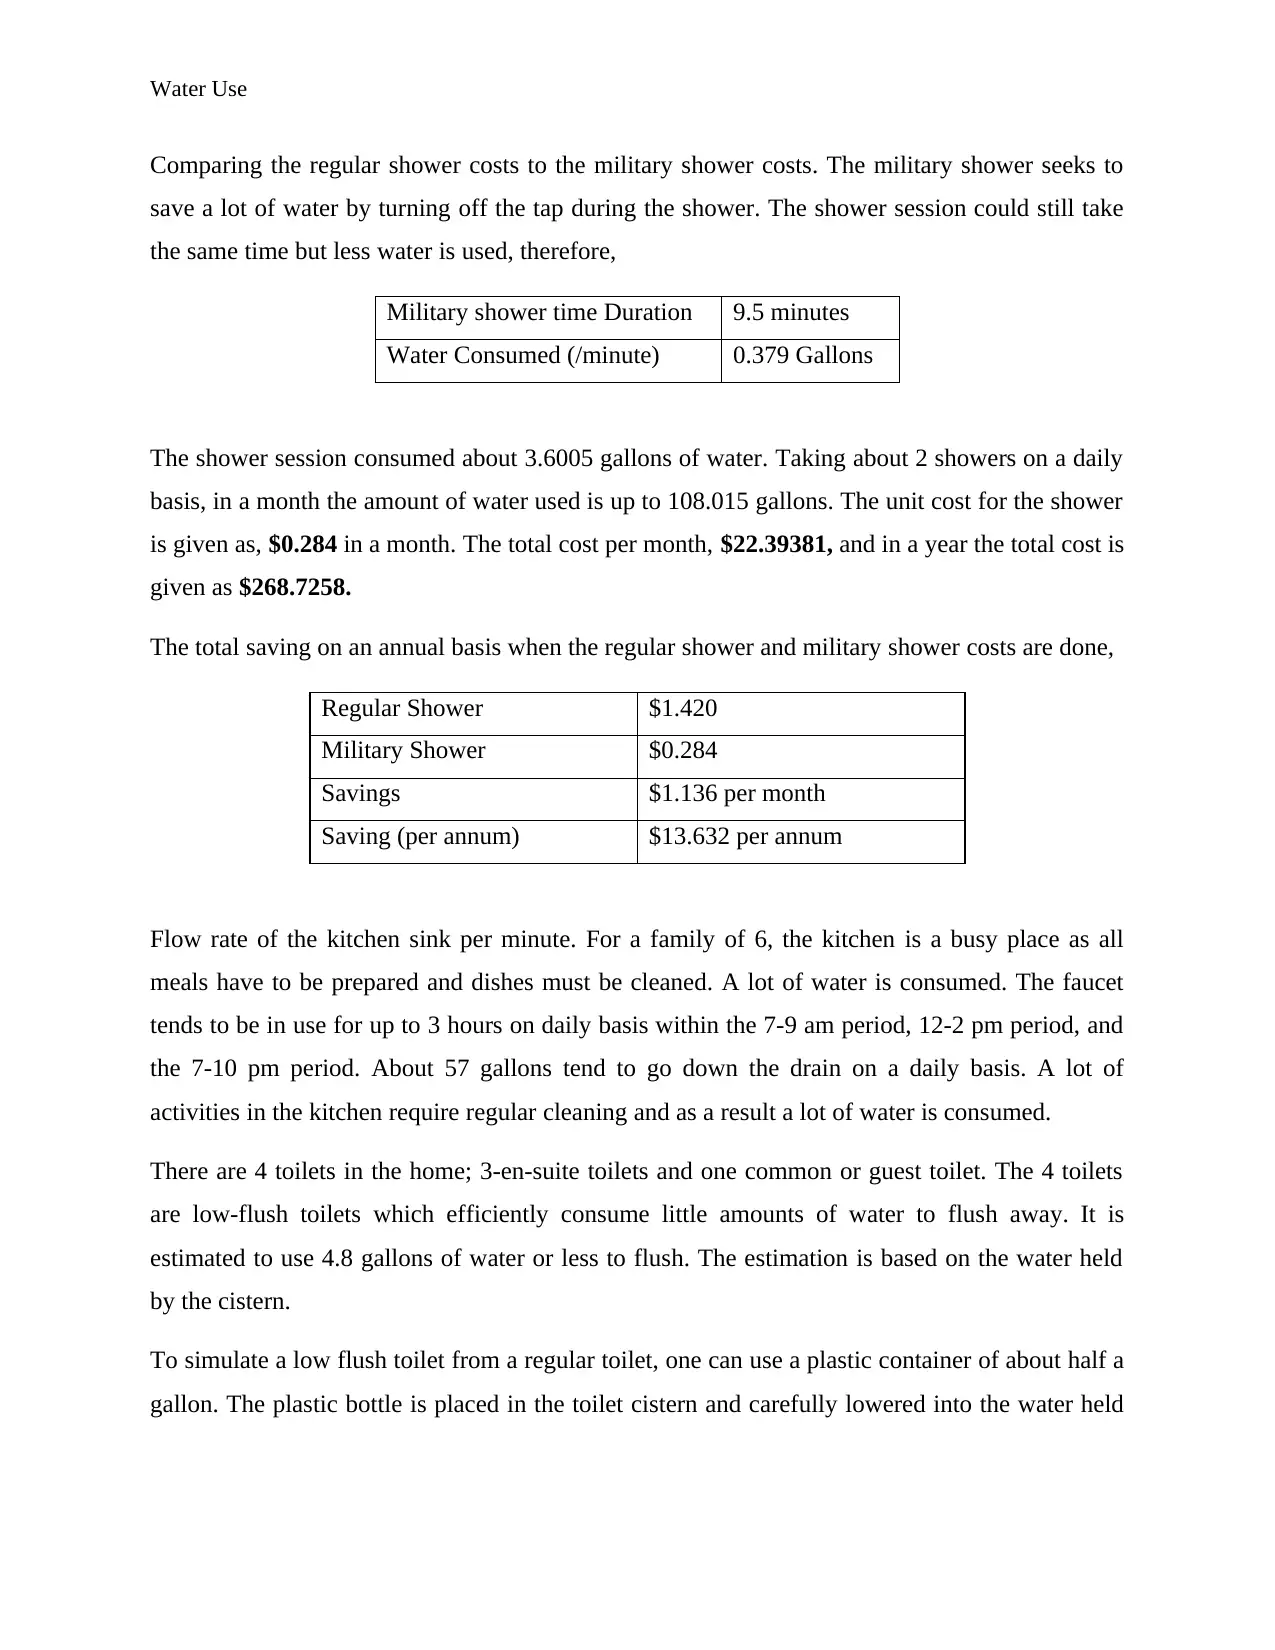
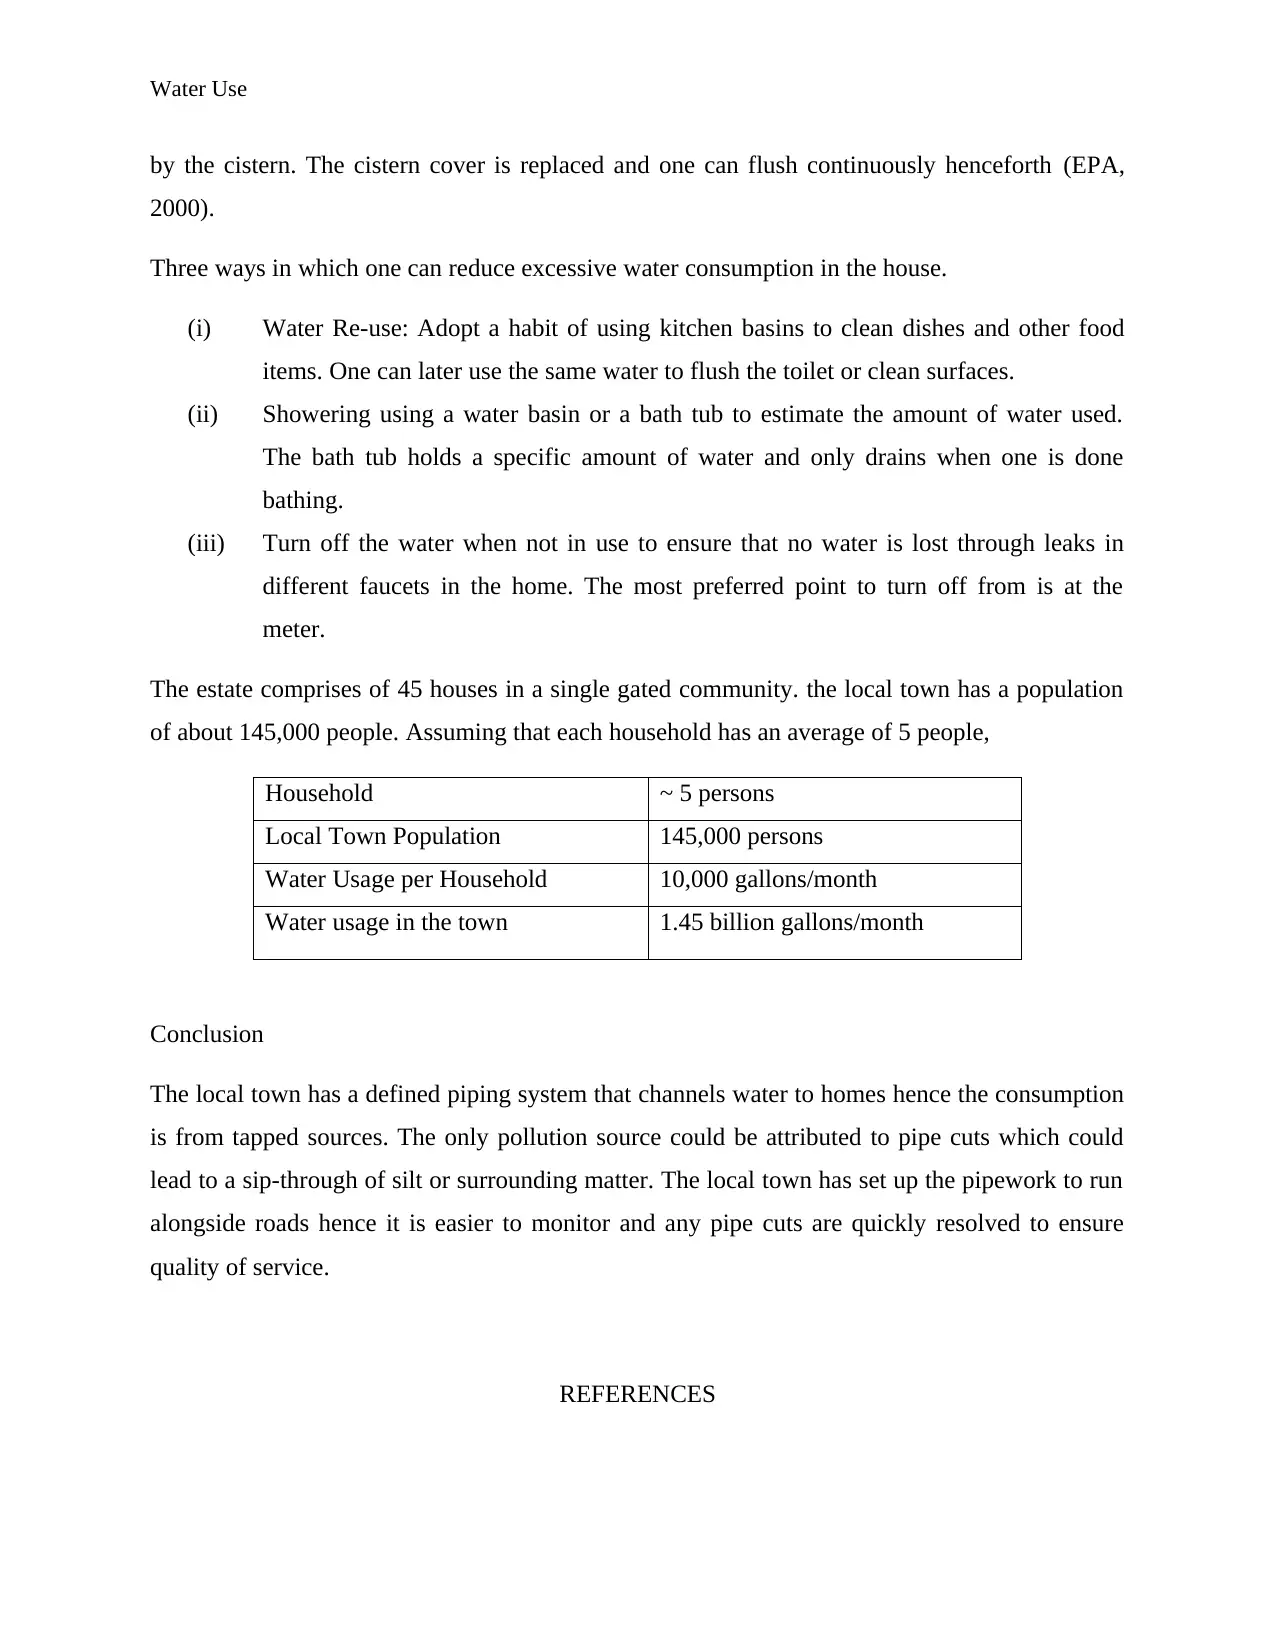
This lab report details an experiment analyzing water use in a household, focusing on a dripping faucet and shower habits. The study calculates water loss from a leaky faucet over a year, determining the associated cost based on local water rates. It further compares the cost of regular showers versus water-saving 'military showers,' quantifying potential savings. The report also addresses kitchen water usage, low-flush toilet efficiency, and proposes water conservation methods like water re-use and mindful usage habits. It concludes with an estimation of water consumption in a local community, emphasizing the importance of efficient water management and conservation practices. Desklib provides access to similar assignments and resources for students.
Document Page
Running Head: Water Use
2018
INSTITUTIONAL AFFILIATION
FACULTY OR DEPARTMENT
EARTH SCIENCE
TITLE:
WATER USE
LAB REPORT
STUDENT NAME
STUDENT ID NUMBER
DATE OF SUBMISSION
tabler-icon-diamond-filled.svg

Paraphrase This Document

Need a fresh take? Get an instant paraphrase of this document with our AI Paraphraser
Document Page
Water Use
Lab Experiment
Introduction
Dripping water faucet (or set a faucet to drip).
a) The kitchen sink is located to have a dripping water faucet.
b) Collect the water that drips from the faucet over a selected period of time in a container
and record the data based on the leakage on a table.
c) Set up the shower faucet. Estimate the time you take to have a regular shower and record
the amount of water used with the regular shower.
Results and observations
The table below shows the data demonstrating the dripping of water from the leaky kitchen sink
collected within a day on an hourly basis. The water that drips from the faucet over a selected
period of time. The water drips into a container that can hold enough water. The table indicates
the amount of water in terms of gallons that is lost per unit time. The unit time used in this case
is the hourly basis.
Time
Water
(/liter)
water(/
gallon)
1:00 0.3645 0.096290758
2:00 2.567 0.678129978
3:00 2.89 0.763457591
4:00 3.256 0.860144608
5:00 3.256 0.860144608
6:00 3.256 0.860144608
7:00 3.256 0.860144608
8:00 8.765 2.31546913
9:00 9.567 2.527335216
10:00 10.976 2.899553813
11:00 10.995 2.904573085
12:00 11.345 2.997033346
13:00 12.675 3.348382342
14:00 15.545 4.106556489
15:00 16.25 4.292797874
16:00 16.25 4.292797874
Document Page
Water Use
17:00 16.895 4.463188928
18:00 16.952 4.478246742
19:00 18.45 4.873976663
20:00 19.565 5.16852864
21:00 21.325 5.633471671
22:00 21.565 5.696872994
23:00 22.787 6.019691394
0:00 23.981 6.335112973
Discussion
Part I
Amount of water to be lost in a year from this drip. The linear expression governing the drip rate
of the faucet, leaky kitchen sink, is obtained as,
1:00
2:00
3:00
4:00
5:00
6:00
7:00
8:00
9:00
10:00
11:00
12:00
13:00
14:00
15:00
16:00
17:00
18:00
19:00
20:00
21:00
22:00
23:00
0:00
0
5
10
15
20
25
30
f(x) = 0.990025408163265 x
R² = 0.993023907785105
Plot of a dripping faucet over a day
Hourly Time line (Hr)
Water */liter)
y=0.99 x
Document Page
Water Use
1:00
3:00
5:00
7:00
9:00
11:00
13:00
15:00
17:00
19:00
21:00
23:00
0
1
2
3
4
5
6
7
f(x) = 0.273810039295217 x − 0.200456910648551
R² = 0.97591000889597
Plot of a dripping faucet over a day
water(/gallon)
Linear (water(/gallon))
Hourrly Rate (Hr)
Water (/gallon)
Finding the amount of water to be lost in a year would mean one computes,
y=0.2738 x0.2005
y=0.2738 ( 36524 )0.2005=2398.2875
2398 gallons/ year
Part II
Cost of water per thousand gallons of water based on the local water board or water bill,
The state charges $22.11 per month as a base rate for connectivity (Gov.Za, 2016). Thereafter,
there is a $2.06 charge for every unit of water consumed. One unit has up to 748 gallons of
water. From the data collected,
Units consumed
1 unit=748 gallons
month
y=0.2738 ( 3024 )0.2005
tabler-icon-diamond-filled.svg

Paraphrase This Document

Need a fresh take? Get an instant paraphrase of this document with our AI Paraphraser
Document Page
Water Use
y=196.9355 gallons
month
To obtain the total cost per year, assuming the drip remains constant over the months,
annual cost=$ 24.1712=$ 290.04
Standard costs $22.11
Unit Consumed & costs $ 2.06
Total $24.17 /month
Total (per annum) $290.04/annum
Part III
Cost of water used in taking a regular shower. The time taken to shower and the amount of water
used in one minute is as recorded in the table below,
Regular shower time Duration 9.5 minutes
Water Consumed (/minute) 1.895 Gallons
In a day, one is bound to take a shower twice. Computing further,
Cost per shower,
For a single shower session, in 9.5 minutes, one consumes 18 gallons which is still below one
unit. Within a month, about 540 gallons are consumed by the shower faucet. The standard
charges within the month apply at $22.11+$1.42= $23.53.
Cost per year,
From the monthly charges, assuming the showering is on average the same as that of the monthly
computation, the annual cost is given as $282.36.
Part IV
Document Page
Water Use
Comparing the regular shower costs to the military shower costs. The military shower seeks to
save a lot of water by turning off the tap during the shower. The shower session could still take
the same time but less water is used, therefore,
Military shower time Duration 9.5 minutes
Water Consumed (/minute) 0.379 Gallons
The shower session consumed about 3.6005 gallons of water. Taking about 2 showers on a daily
basis, in a month the amount of water used is up to 108.015 gallons. The unit cost for the shower
is given as, $0.284 in a month. The total cost per month, $22.39381, and in a year the total cost is
given as $268.7258.
The total saving on an annual basis when the regular shower and military shower costs are done,
Regular Shower $1.420
Military Shower $0.284
Savings $1.136 per month
Saving (per annum) $13.632 per annum
Flow rate of the kitchen sink per minute. For a family of 6, the kitchen is a busy place as all
meals have to be prepared and dishes must be cleaned. A lot of water is consumed. The faucet
tends to be in use for up to 3 hours on daily basis within the 7-9 am period, 12-2 pm period, and
the 7-10 pm period. About 57 gallons tend to go down the drain on a daily basis. A lot of
activities in the kitchen require regular cleaning and as a result a lot of water is consumed.
There are 4 toilets in the home; 3-en-suite toilets and one common or guest toilet. The 4 toilets
are low-flush toilets which efficiently consume little amounts of water to flush away. It is
estimated to use 4.8 gallons of water or less to flush. The estimation is based on the water held
by the cistern.
To simulate a low flush toilet from a regular toilet, one can use a plastic container of about half a
gallon. The plastic bottle is placed in the toilet cistern and carefully lowered into the water held
Document Page
Water Use
by the cistern. The cistern cover is replaced and one can flush continuously henceforth (EPA,
2000).
Three ways in which one can reduce excessive water consumption in the house.
(i) Water Re-use: Adopt a habit of using kitchen basins to clean dishes and other food
items. One can later use the same water to flush the toilet or clean surfaces.
(ii) Showering using a water basin or a bath tub to estimate the amount of water used.
The bath tub holds a specific amount of water and only drains when one is done
bathing.
(iii) Turn off the water when not in use to ensure that no water is lost through leaks in
different faucets in the home. The most preferred point to turn off from is at the
meter.
The estate comprises of 45 houses in a single gated community. the local town has a population
of about 145,000 people. Assuming that each household has an average of 5 people,
Household ~ 5 persons
Local Town Population 145,000 persons
Water Usage per Household 10,000 gallons/month
Water usage in the town 1.45 billion gallons/month
Conclusion
The local town has a defined piping system that channels water to homes hence the consumption
is from tapped sources. The only pollution source could be attributed to pipe cuts which could
lead to a sip-through of silt or surrounding matter. The local town has set up the pipework to run
alongside roads hence it is easier to monitor and any pipe cuts are quickly resolved to ensure
quality of service.
REFERENCES
tabler-icon-diamond-filled.svg

Paraphrase This Document

Need a fresh take? Get an instant paraphrase of this document with our AI Paraphraser
Document Page
Water Use
EPA. (2000). Wastewater Technology Fact Sheet: High Efficiency Toilets. Retrieved from
Environment, public and Consumer Benefits of Wastewater Technology:
https://www3.epa.gov/npdes/pubs/hi-eff_toilet.pdf
Gov.Za. (2016). Tariff Tables 2016/2017. Retrieved from Ethekwini Municipality:
http://www.durban.gov.za/Resource_Centre/reports/Budget/Documents/
TariffTables2016_2017.pdf
chevron_up_icon
1 out of 8
circle_padding
hide_on_mobile
zoom_out_icon
[object Object]