Weather Report Analysis: Current Conditions of Various Cities
VerifiedAdded on 2023/05/30
|22
|3957
|458
AI Summary
This report provides the current weather conditions of various cities in the US for the period of 10th November 2018 to 14th November 2018. It includes the average temperature, barometric pressure, wind speed, direction, relative humidity and weather condition of Greenville, NC, Phoenix, Arizona, Prescott, Arizona, Boston, Massachusetts, Fargo, North Dakota and Miami, Florida. The warmest and coldest cities are identified and factors that influence the weather of these two regions are discussed.
Contribute Materials
Your contribution can guide someone’s learning journey. Share your
documents today.
Running head: WEATHER REPORT ANALYSIS
WEATHER REPORT ANALYSIS
Name of the Student
Name of the University
Author Note
WEATHER REPORT ANALYSIS
Name of the Student
Name of the University
Author Note
Secure Best Marks with AI Grader
Need help grading? Try our AI Grader for instant feedback on your assignments.
2WEATHER REPORT ANALYSIS
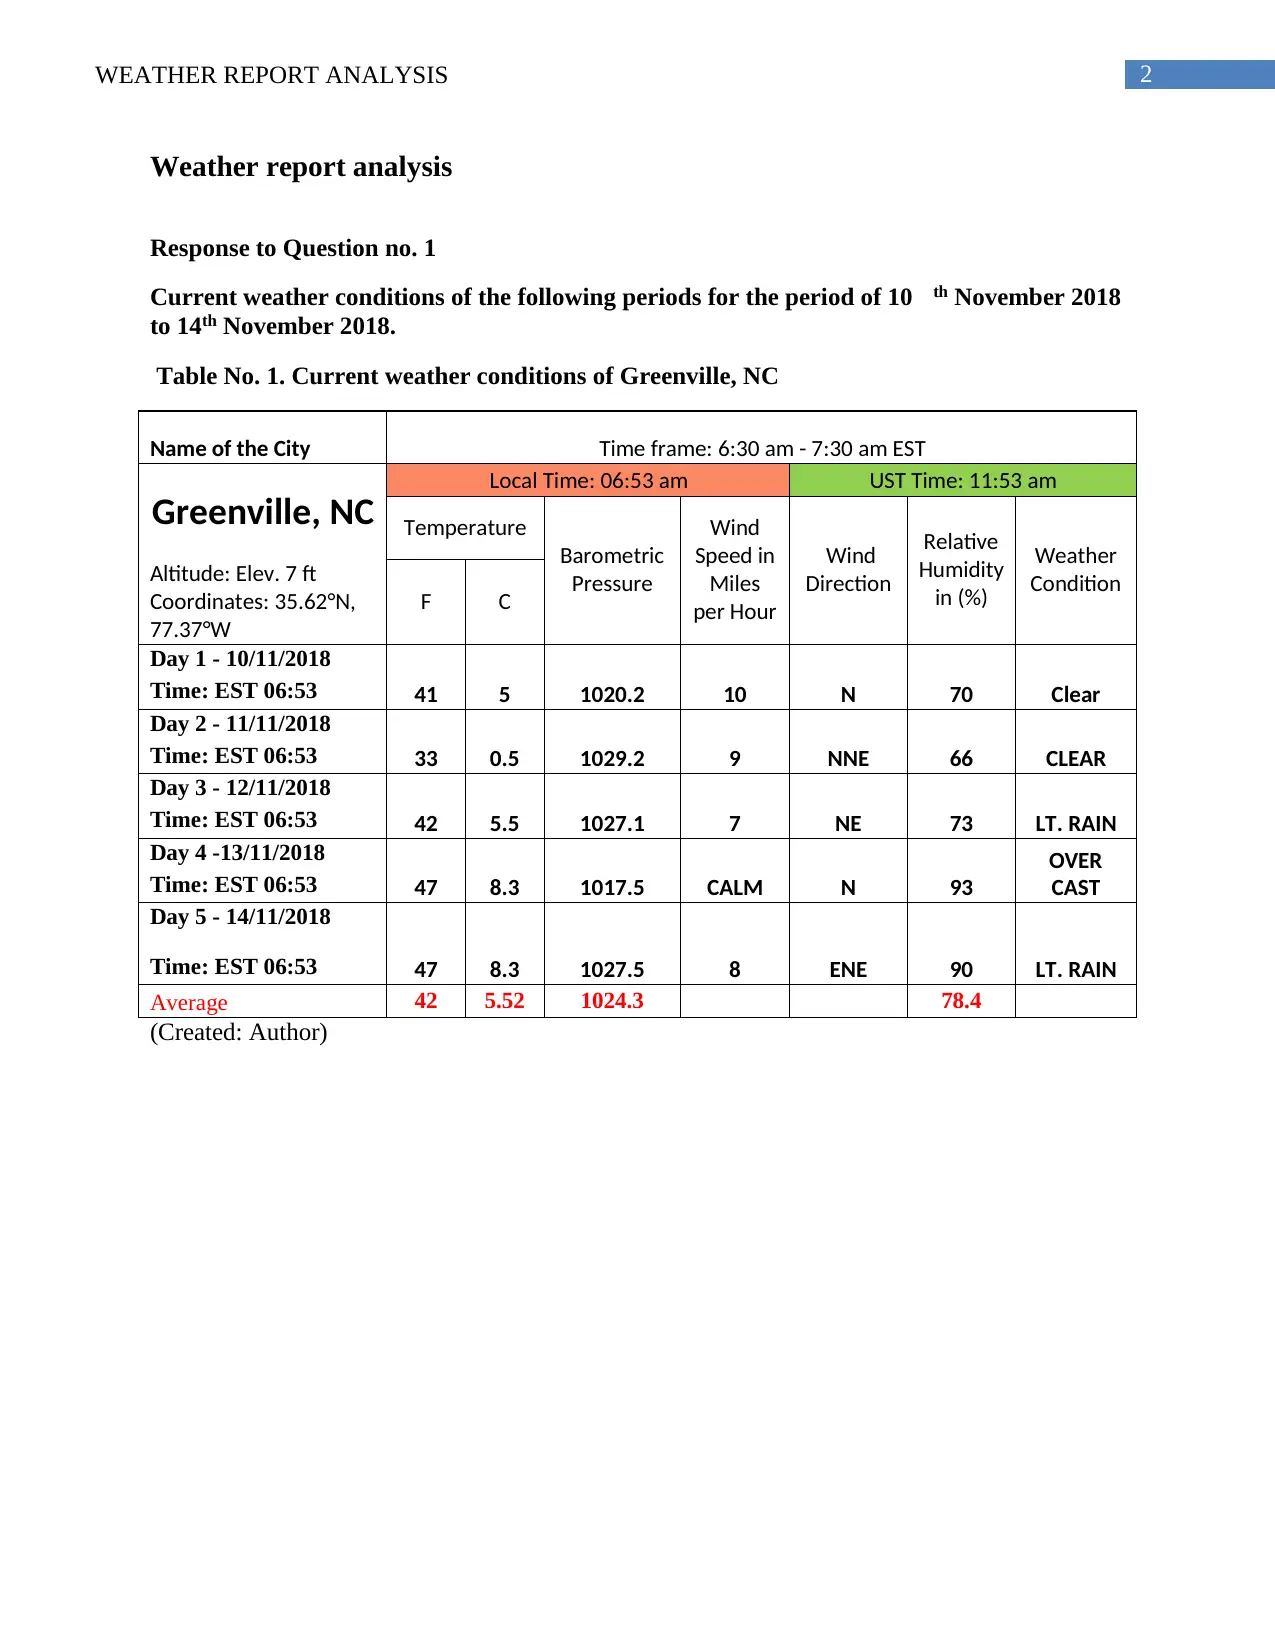
Weather report analysis
Response to Question no. 1
Current weather conditions of the following periods for the period of 10 th November 2018
to 14th November 2018.
Table No. 1. Current weather conditions of Greenville, NC
Name of the City Time frame: 6:30 am - 7:30 am EST
Greenville, NC Local Time: 06:53 am UST Time: 11:53 am
Temperature
Barometric
Pressure
Wind
Speed in
Miles
per Hour
Wind
Direction
Relative
Humidity
in (%)
Weather
ConditionAltitude: Elev. 7 ft
Coordinates: 35.62°N,
77.37°W
F C
Day 1 - 10/11/2018
41 5 1020.2 10 N 70 ClearTime: EST 06:53
Day 2 - 11/11/2018
33 0.5 1029.2 9 NNE 66 CLEARTime: EST 06:53
Day 3 - 12/11/2018
42 5.5 1027.1 7 NE 73 LT. RAINTime: EST 06:53
Day 4 -13/11/2018
47 8.3 1017.5 CALM N 93
OVER
CASTTime: EST 06:53
Day 5 - 14/11/2018
47 8.3 1027.5 8 ENE 90 LT. RAINTime: EST 06:53
Average 42 5.52 1024.3 78.4
(Created: Author)
3WEATHER REPORT ANALYSIS
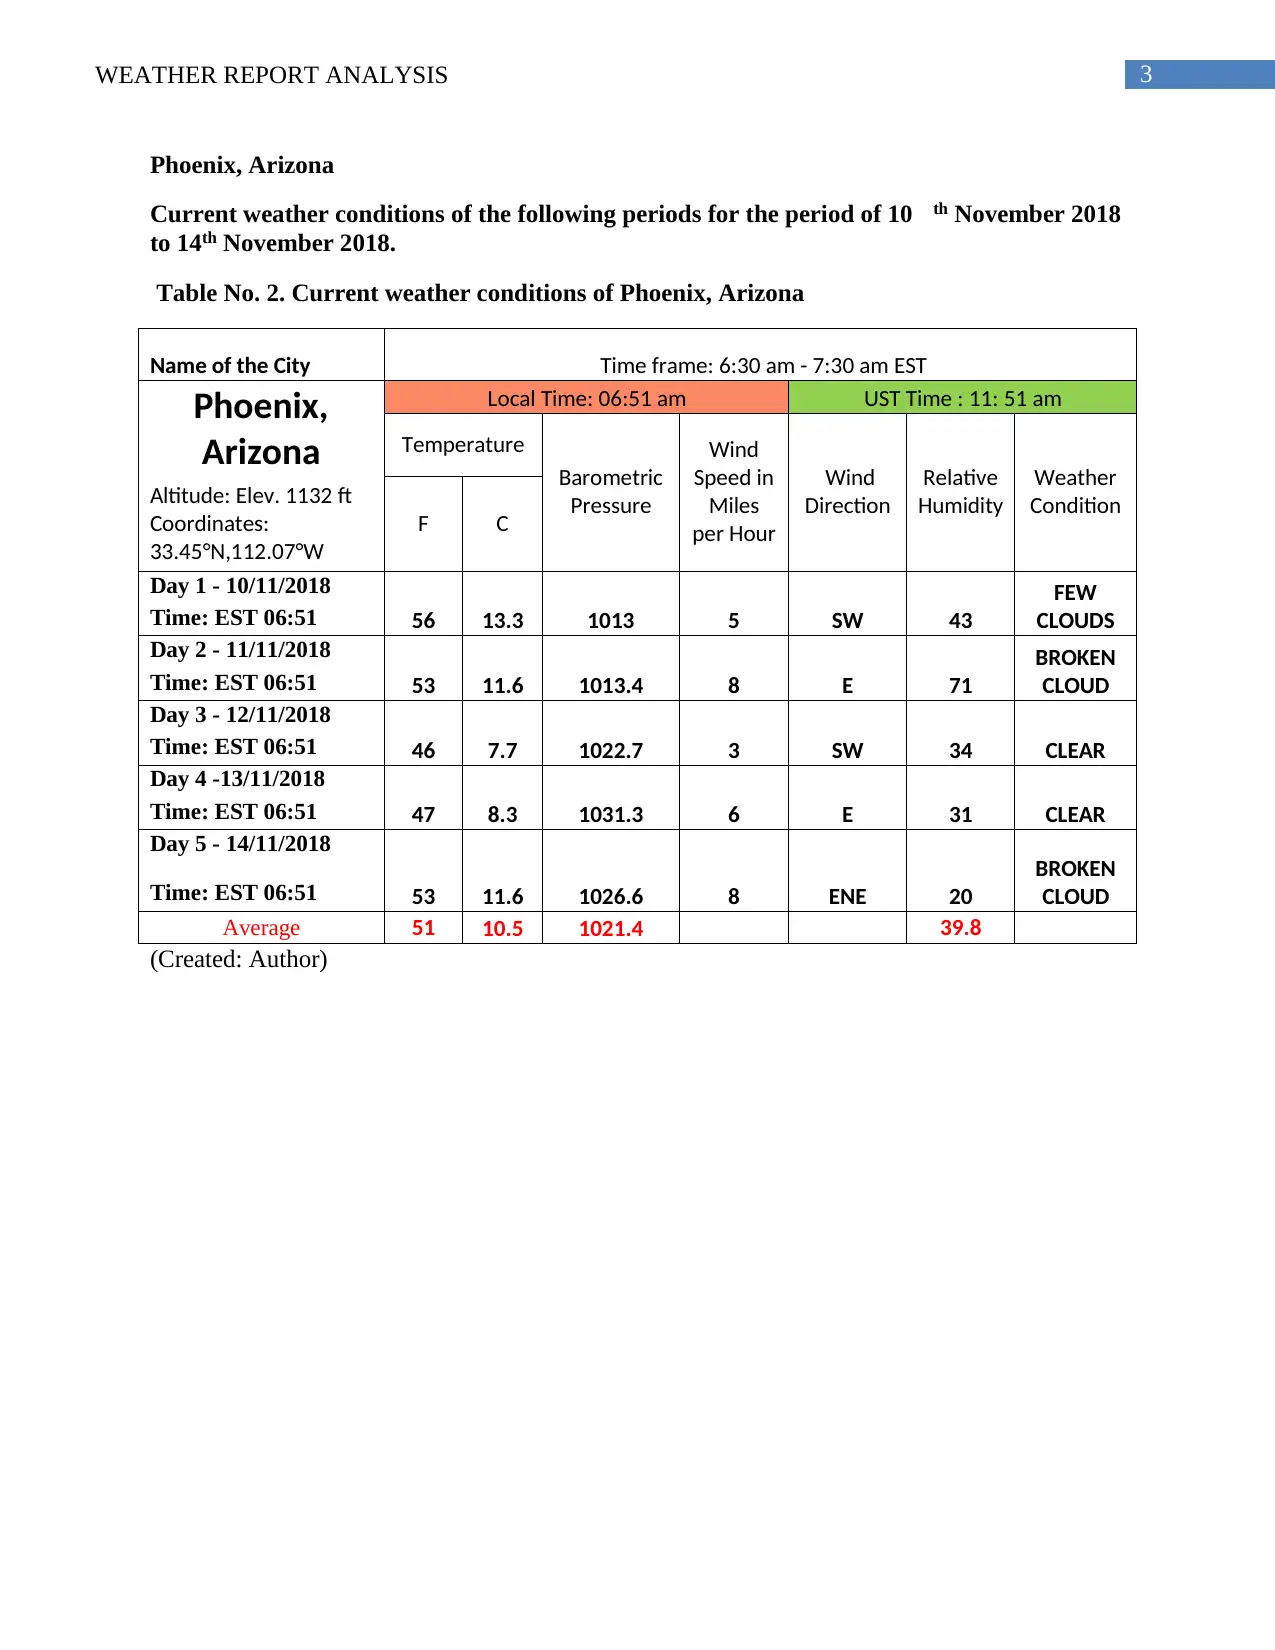
Phoenix, Arizona
Current weather conditions of the following periods for the period of 10 th November 2018
to 14th November 2018.
Table No. 2. Current weather conditions of Phoenix, Arizona
Name of the City Time frame: 6:30 am - 7:30 am EST
Phoenix,
Arizona
Local Time: 06:51 am UST Time : 11: 51 am
Temperature
Barometric
Pressure
Wind
Speed in
Miles
per Hour
Wind
Direction
Relative
Humidity
Weather
ConditionAltitude: Elev. 1132 ft
Coordinates:
33.45°N,112.07°W
F C
Day 1 - 10/11/2018
56 13.3 1013 5 SW 43
FEW
CLOUDSTime: EST 06:51
Day 2 - 11/11/2018
53 11.6 1013.4 8 E 71
BROKEN
CLOUDTime: EST 06:51
Day 3 - 12/11/2018
46 7.7 1022.7 3 SW 34 CLEARTime: EST 06:51
Day 4 -13/11/2018
47 8.3 1031.3 6 E 31 CLEARTime: EST 06:51
Day 5 - 14/11/2018
53 11.6 1026.6 8 ENE 20
BROKEN
CLOUDTime: EST 06:51
Average 51 10.5 1021.4 39.8
(Created: Author)
4WEATHER REPORT ANALYSIS
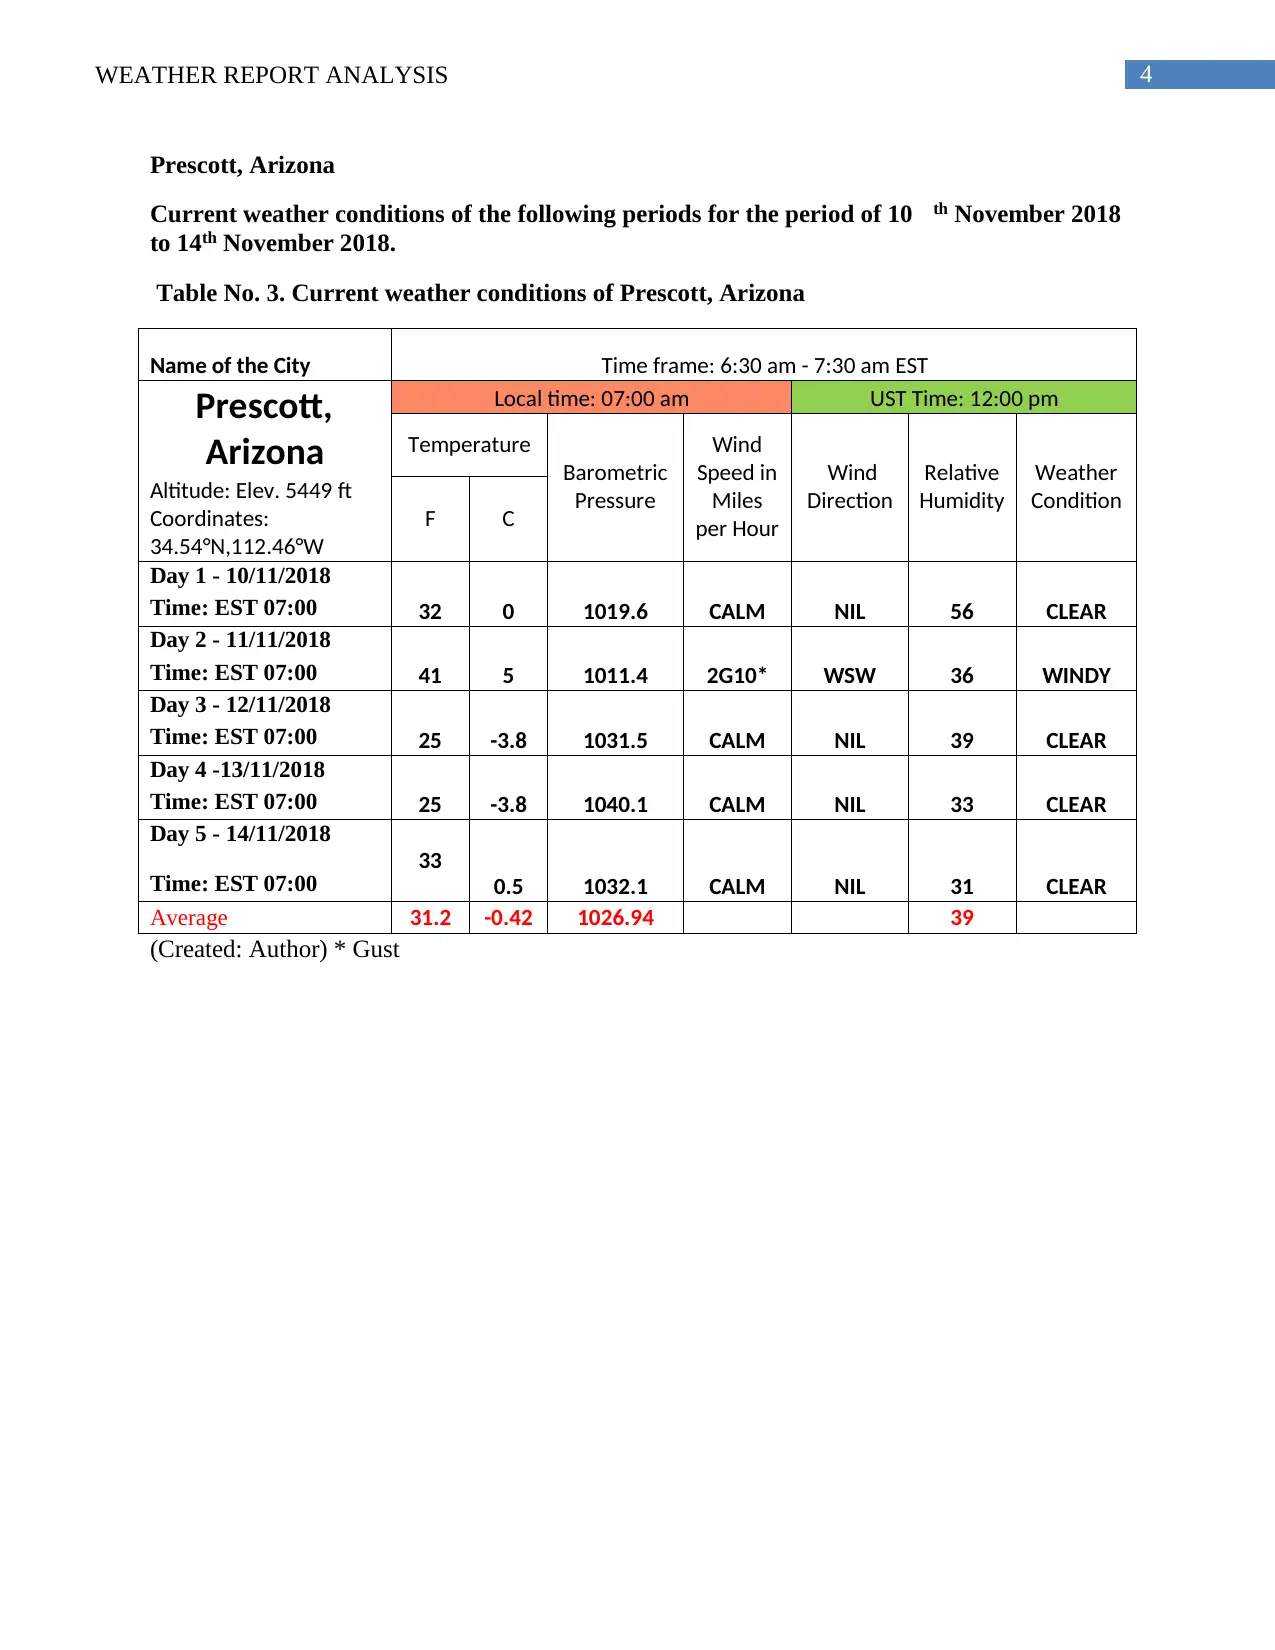
Prescott, Arizona
Current weather conditions of the following periods for the period of 10 th November 2018
to 14th November 2018.
Table No. 3. Current weather conditions of Prescott, Arizona
Name of the City Time frame: 6:30 am - 7:30 am EST
Prescott,
Arizona
Local time: 07:00 am UST Time: 12:00 pm
Temperature
Barometric
Pressure
Wind
Speed in
Miles
per Hour
Wind
Direction
Relative
Humidity
Weather
ConditionAltitude: Elev. 5449 ft
Coordinates:
34.54°N,112.46°W
F C
Day 1 - 10/11/2018
32 0 1019.6 CALM NIL 56 CLEARTime: EST 07:00
Day 2 - 11/11/2018
41 5 1011.4 2G10* WSW 36 WINDYTime: EST 07:00
Day 3 - 12/11/2018
25 -3.8 1031.5 CALM NIL 39 CLEARTime: EST 07:00
Day 4 -13/11/2018
25 -3.8 1040.1 CALM NIL 33 CLEARTime: EST 07:00
Day 5 - 14/11/2018
33
0.5 1032.1 CALM NIL 31 CLEARTime: EST 07:00
Average 31.2 -0.42 1026.94 39
(Created: Author) * Gust
Secure Best Marks with AI Grader
Need help grading? Try our AI Grader for instant feedback on your assignments.
5WEATHER REPORT ANALYSIS
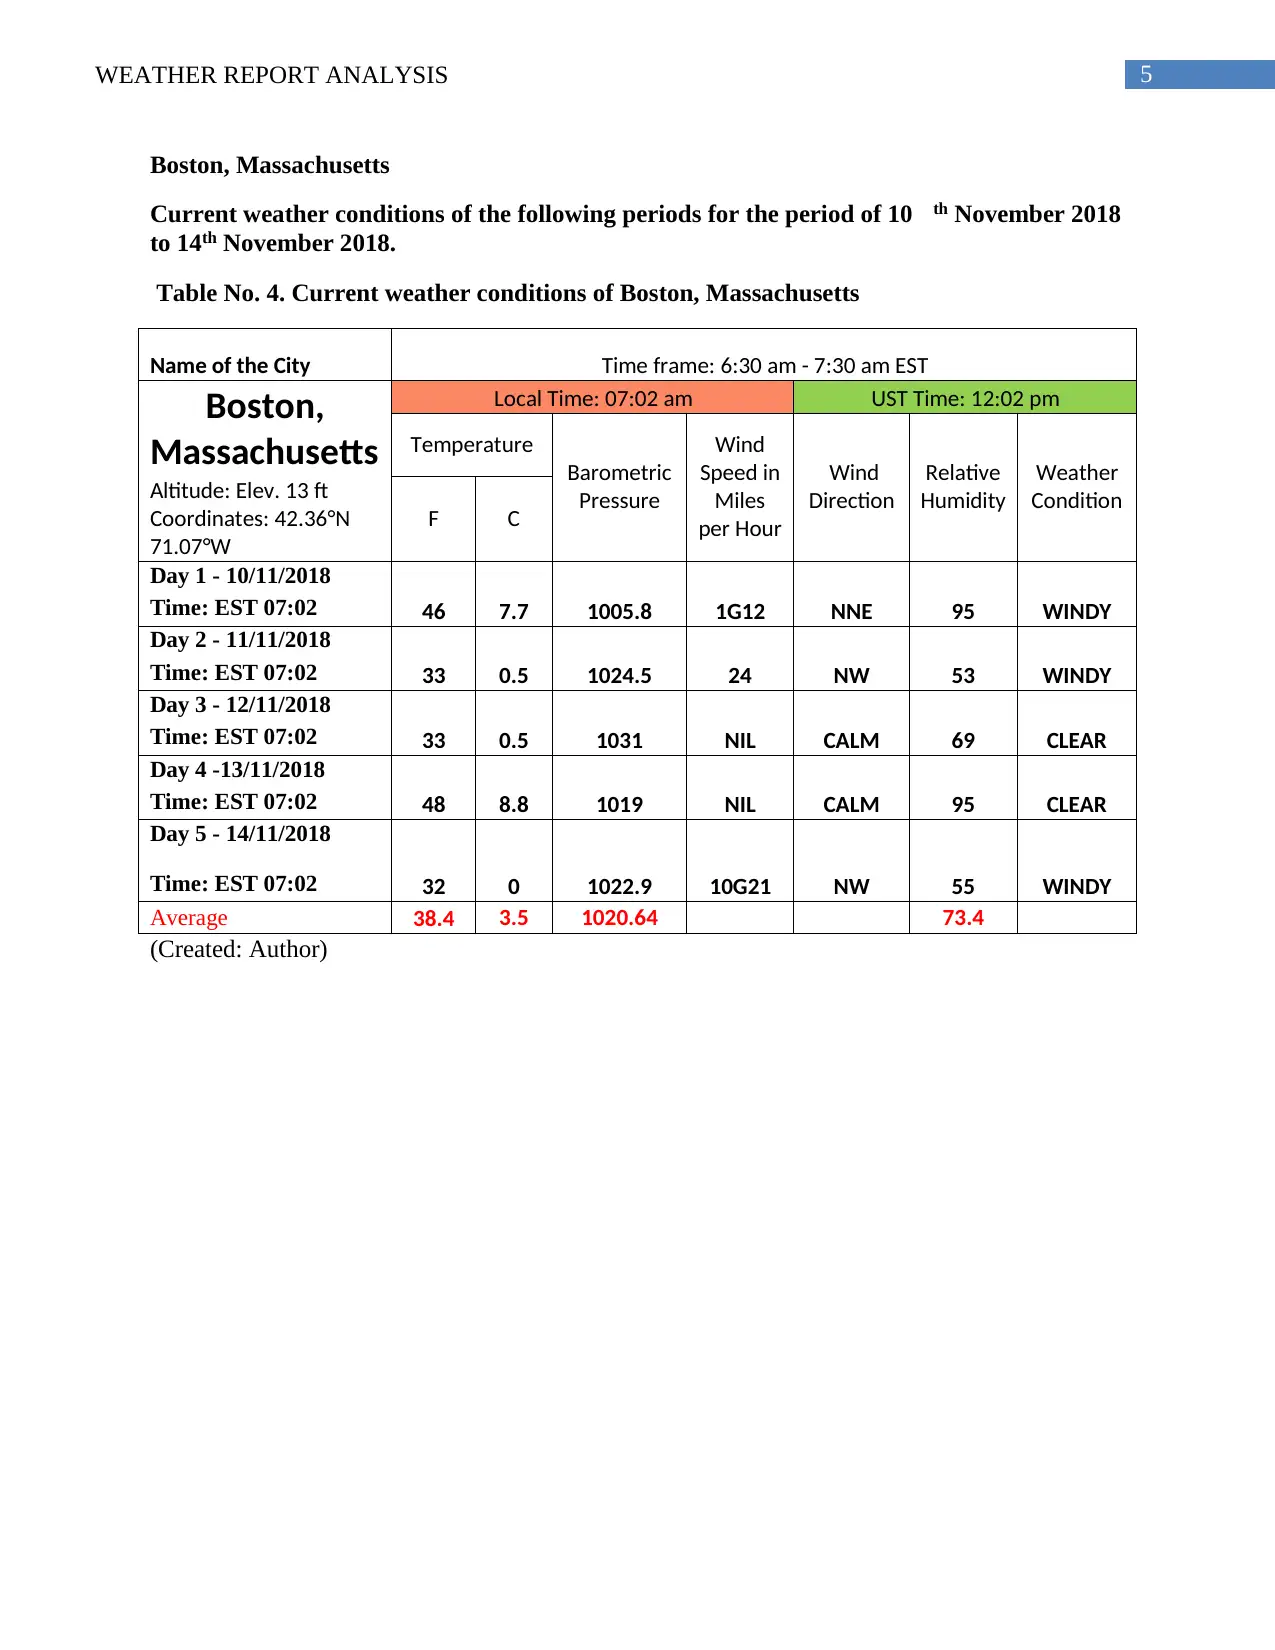
Boston, Massachusetts
Current weather conditions of the following periods for the period of 10 th November 2018
to 14th November 2018.
Table No. 4. Current weather conditions of Boston, Massachusetts
Name of the City Time frame: 6:30 am - 7:30 am EST
Boston,
Massachusetts
Local Time: 07:02 am UST Time: 12:02 pm
Temperature
Barometric
Pressure
Wind
Speed in
Miles
per Hour
Wind
Direction
Relative
Humidity
Weather
ConditionAltitude: Elev. 13 ft
Coordinates: 42.36°N
71.07°W
F C
Day 1 - 10/11/2018
46 7.7 1005.8 1G12 NNE 95 WINDYTime: EST 07:02
Day 2 - 11/11/2018
33 0.5 1024.5 24 NW 53 WINDYTime: EST 07:02
Day 3 - 12/11/2018
33 0.5 1031 NIL CALM 69 CLEARTime: EST 07:02
Day 4 -13/11/2018
48 8.8 1019 NIL CALM 95 CLEARTime: EST 07:02
Day 5 - 14/11/2018
32 0 1022.9 10G21 NW 55 WINDYTime: EST 07:02
Average 38.4 3.5 1020.64 73.4
(Created: Author)
6WEATHER REPORT ANALYSIS
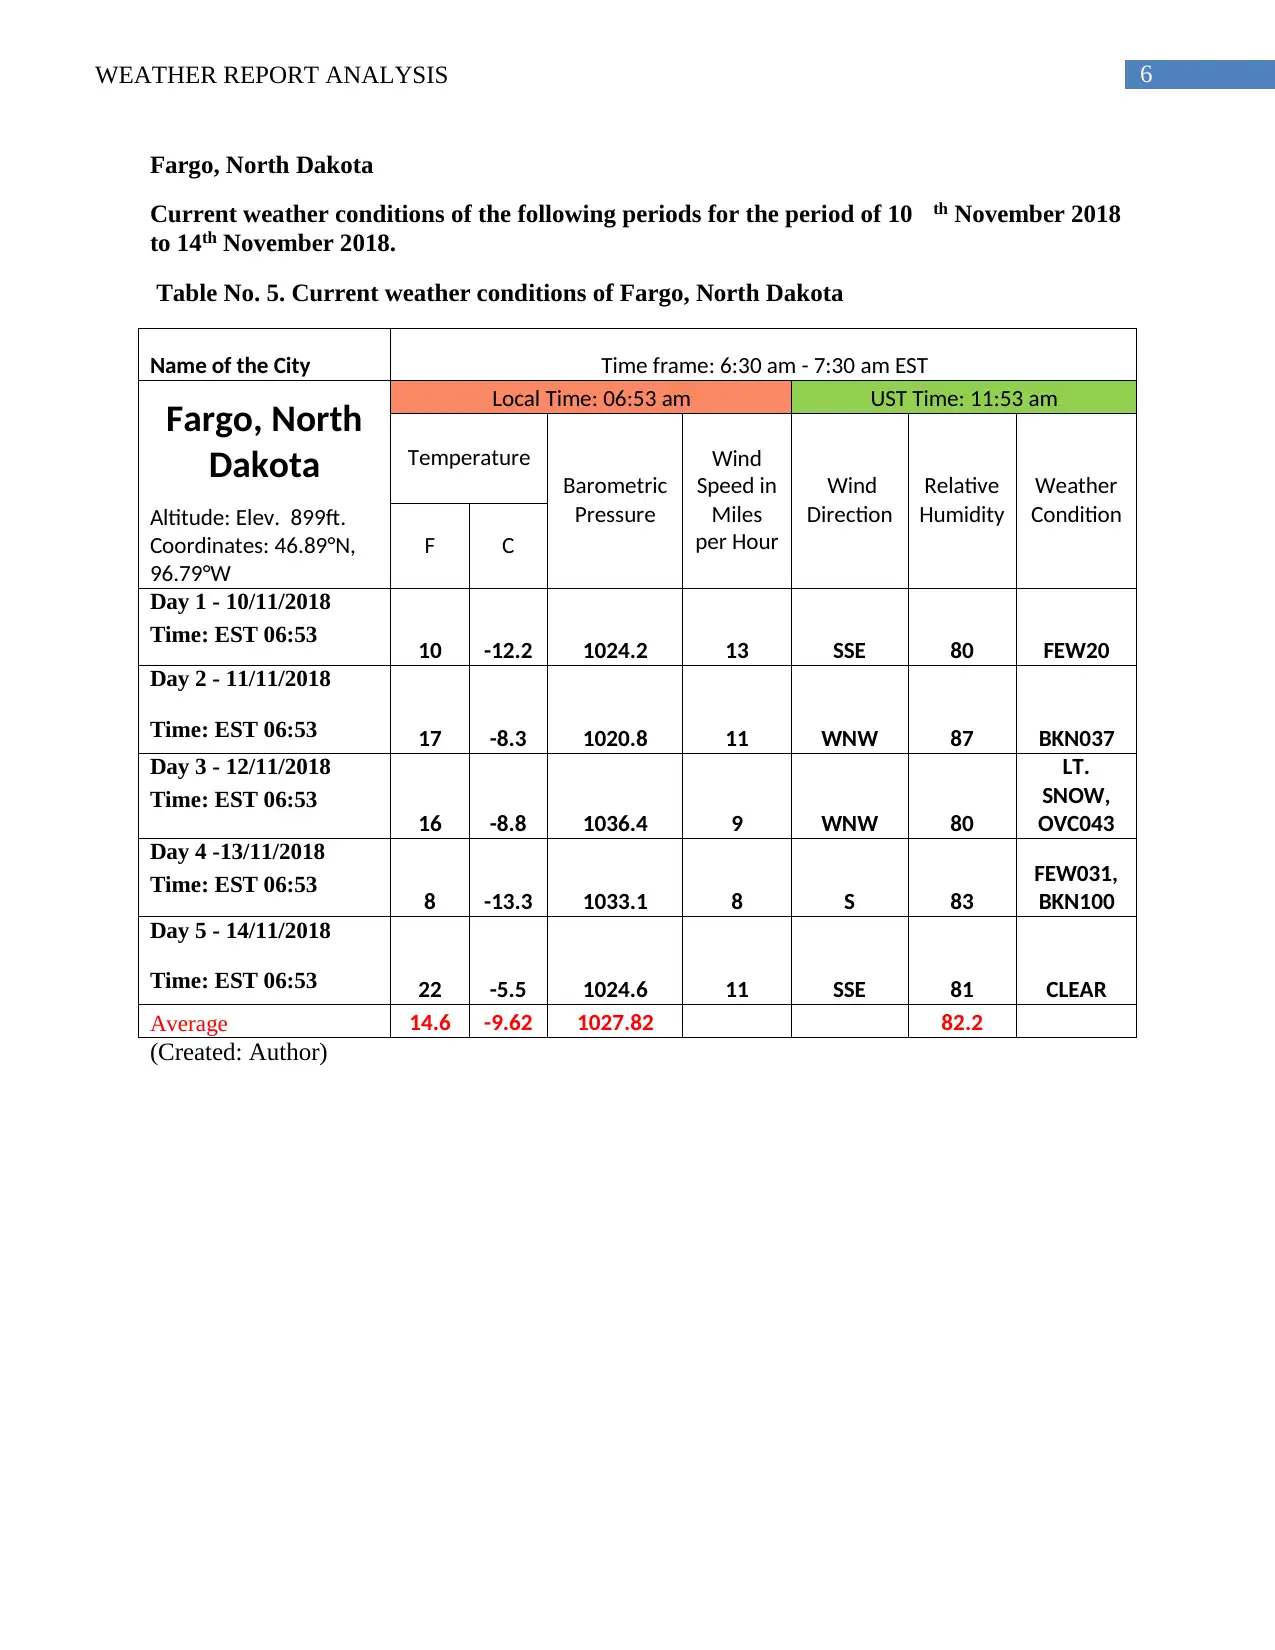
Fargo, North Dakota
Current weather conditions of the following periods for the period of 10 th November 2018
to 14th November 2018.
Table No. 5. Current weather conditions of Fargo, North Dakota
Name of the City Time frame: 6:30 am - 7:30 am EST
Fargo, North
Dakota
Local Time: 06:53 am UST Time: 11:53 am
Temperature
Barometric
Pressure
Wind
Speed in
Miles
per Hour
Wind
Direction
Relative
Humidity
Weather
ConditionAltitude: Elev. 899ft.
Coordinates: 46.89°N,
96.79°W
F C
Day 1 - 10/11/2018
10 -12.2 1024.2 13 SSE 80 FEW20
Time: EST 06:53
Day 2 - 11/11/2018
17 -8.3 1020.8 11 WNW 87 BKN037Time: EST 06:53
Day 3 - 12/11/2018
16 -8.8 1036.4 9 WNW 80
LT.
SNOW,
OVC043
Time: EST 06:53
Day 4 -13/11/2018
8 -13.3 1033.1 8 S 83
FEW031,
BKN100
Time: EST 06:53
Day 5 - 14/11/2018
22 -5.5 1024.6 11 SSE 81 CLEARTime: EST 06:53
Average 14.6 -9.62 1027.82 82.2
(Created: Author)
7WEATHER REPORT ANALYSIS
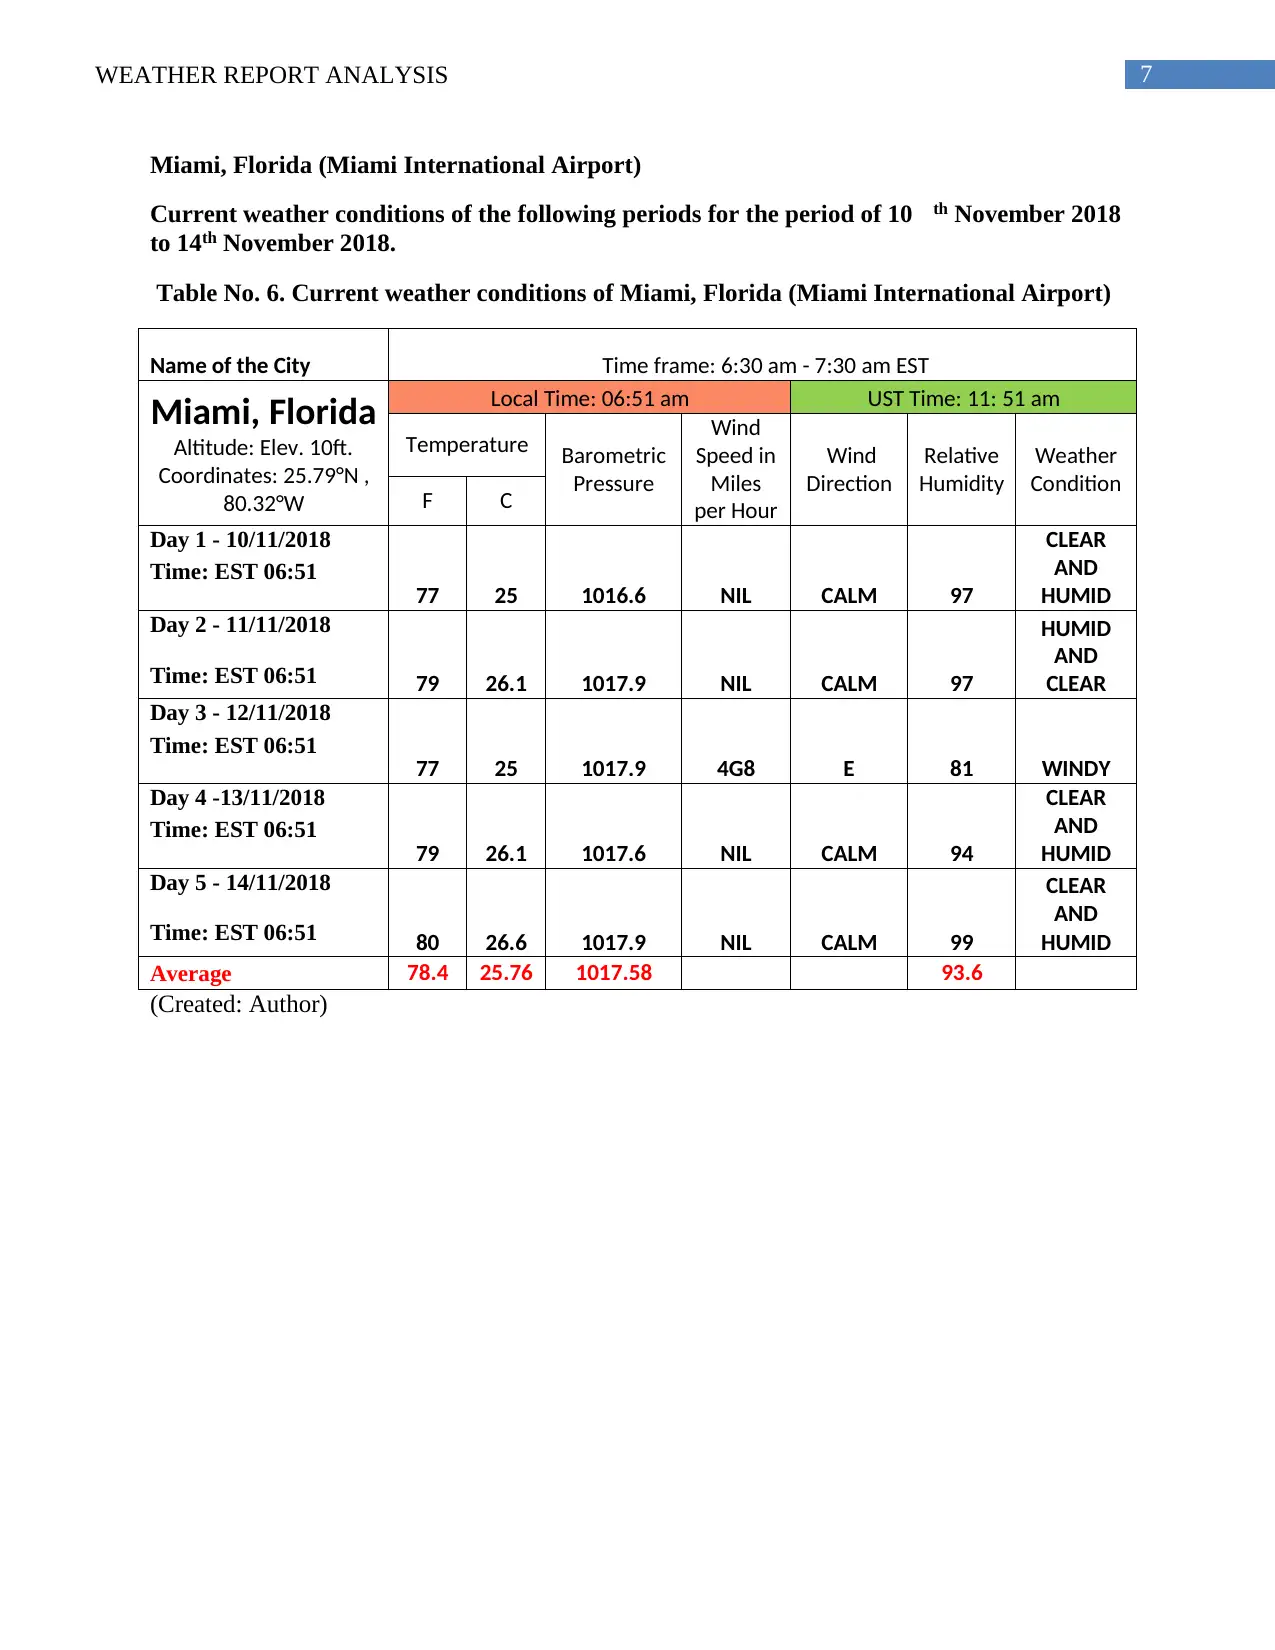
Miami, Florida (Miami International Airport)
Current weather conditions of the following periods for the period of 10 th November 2018
to 14th November 2018.
Table No. 6. Current weather conditions of Miami, Florida (Miami International Airport)
Name of the City Time frame: 6:30 am - 7:30 am EST
Miami, Florida
Altitude: Elev. 10ft.
Coordinates: 25.79°N ,
80.32°W
Local Time: 06:51 am UST Time: 11: 51 am
Temperature Barometric
Pressure
Wind
Speed in
Miles
per Hour
Wind
Direction
Relative
Humidity
Weather
Condition
F C
Day 1 - 10/11/2018
77 25 1016.6 NIL CALM 97
CLEAR
AND
HUMID
Time: EST 06:51
Day 2 - 11/11/2018
79 26.1 1017.9 NIL CALM 97
HUMID
AND
CLEARTime: EST 06:51
Day 3 - 12/11/2018
77 25 1017.9 4G8 E 81 WINDY
Time: EST 06:51
Day 4 -13/11/2018
79 26.1 1017.6 NIL CALM 94
CLEAR
AND
HUMID
Time: EST 06:51
Day 5 - 14/11/2018
80 26.6 1017.9 NIL CALM 99
CLEAR
AND
HUMIDTime: EST 06:51
Average 78.4 25.76 1017.58 93.6
(Created: Author)
Paraphrase This Document
Need a fresh take? Get an instant paraphrase of this document with our AI Paraphraser
8WEATHER REPORT ANALYSIS
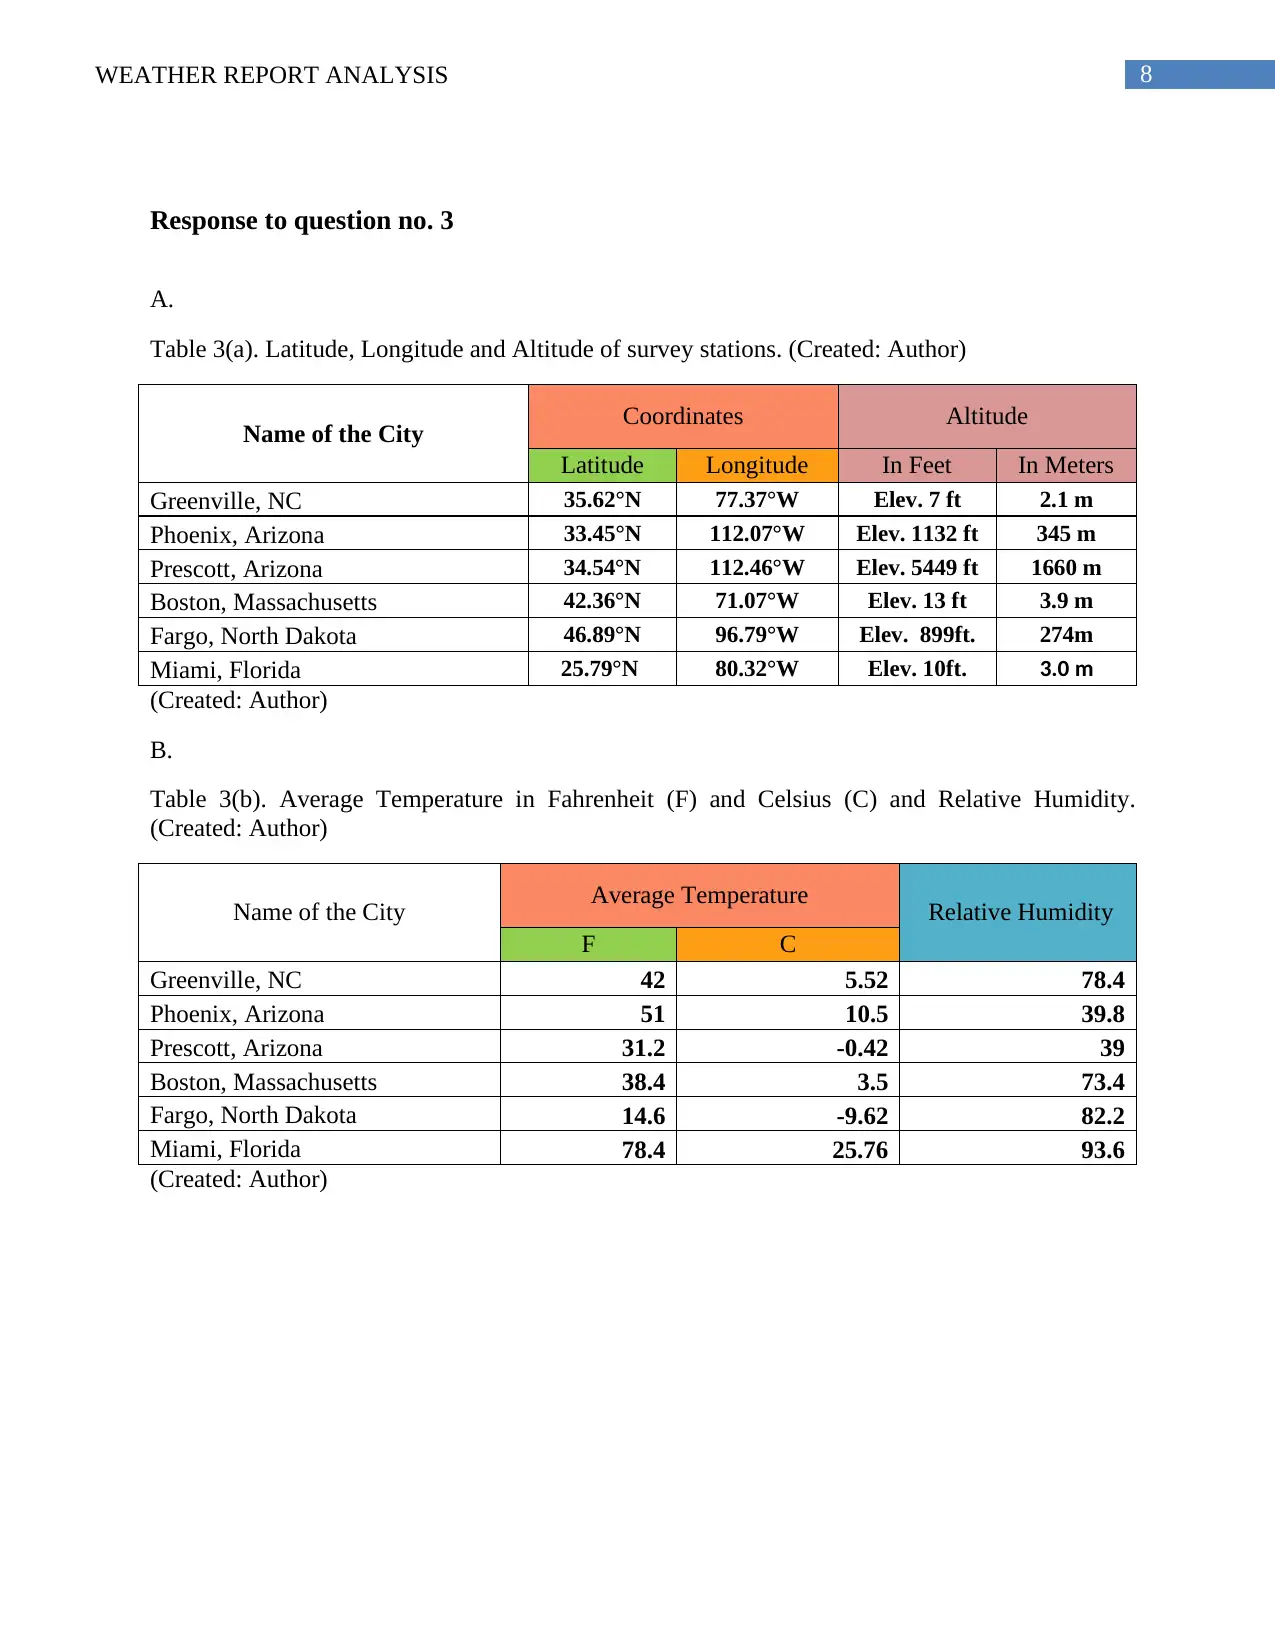
Response to question no. 3
A.
Table 3(a). Latitude, Longitude and Altitude of survey stations. (Created: Author)
Name of the City Coordinates Altitude
Latitude Longitude In Feet In Meters
Greenville, NC 35.62°N 77.37°W Elev. 7 ft 2.1 m
Phoenix, Arizona 33.45°N 112.07°W Elev. 1132 ft 345 m
Prescott, Arizona 34.54°N 112.46°W Elev. 5449 ft 1660 m
Boston, Massachusetts 42.36°N 71.07°W Elev. 13 ft 3.9 m
Fargo, North Dakota 46.89°N 96.79°W Elev. 899ft. 274m
Miami, Florida 25.79°N 80.32°W Elev. 10ft. 3.0 m
(Created: Author)
B.
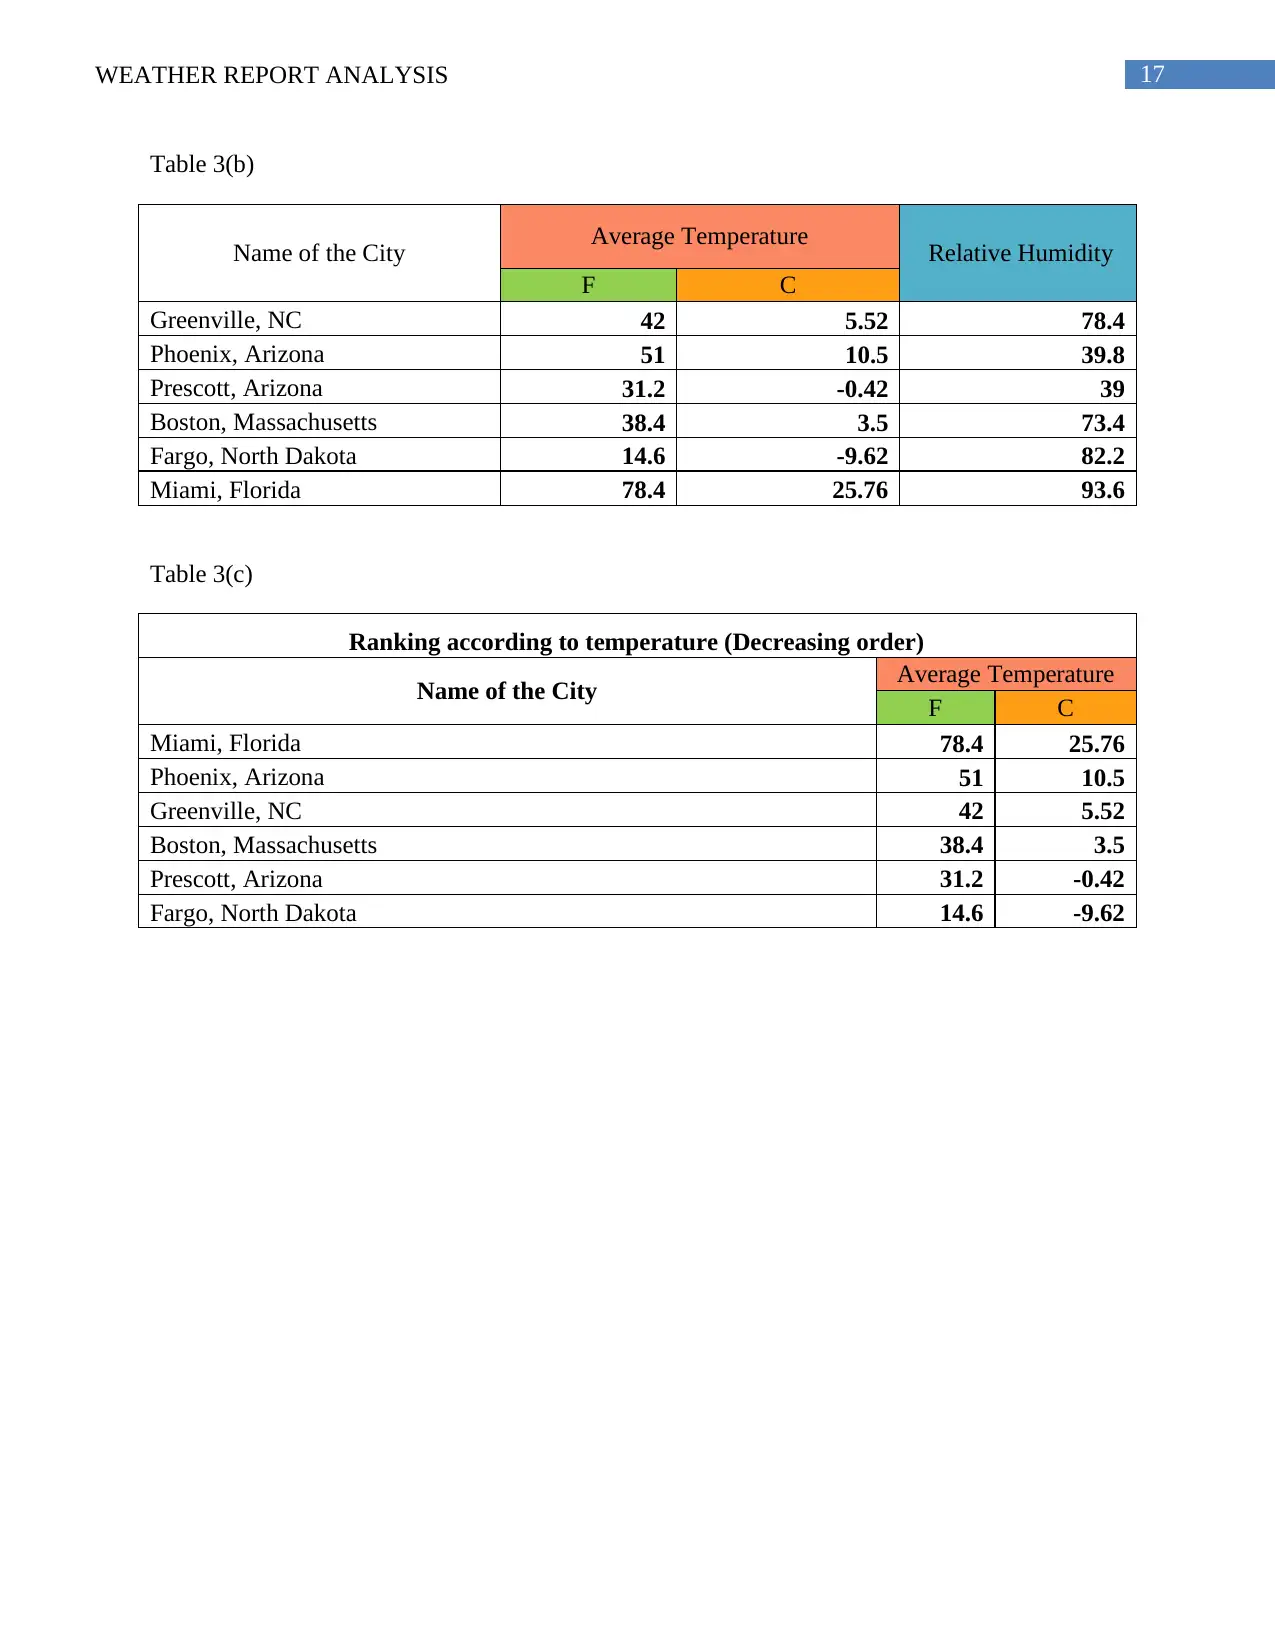
Table 3(b). Average Temperature in Fahrenheit (F) and Celsius (C) and Relative Humidity.
(Created: Author)
Name of the City Average Temperature Relative Humidity
F C
Greenville, NC 42 5.52 78.4
Phoenix, Arizona 51 10.5 39.8
Prescott, Arizona 31.2 -0.42 39
Boston, Massachusetts 38.4 3.5 73.4
Fargo, North Dakota 14.6 -9.62 82.2
Miami, Florida 78.4 25.76 93.6
(Created: Author)
Response to question no. 3
A.
Table 3(a). Latitude, Longitude and Altitude of survey stations. (Created: Author)
Name of the City Coordinates Altitude
Latitude Longitude In Feet In Meters
Greenville, NC 35.62°N 77.37°W Elev. 7 ft 2.1 m
Phoenix, Arizona 33.45°N 112.07°W Elev. 1132 ft 345 m
Prescott, Arizona 34.54°N 112.46°W Elev. 5449 ft 1660 m
Boston, Massachusetts 42.36°N 71.07°W Elev. 13 ft 3.9 m
Fargo, North Dakota 46.89°N 96.79°W Elev. 899ft. 274m
Miami, Florida 25.79°N 80.32°W Elev. 10ft. 3.0 m
(Created: Author)
B.
Table 3(b). Average Temperature in Fahrenheit (F) and Celsius (C) and Relative Humidity.
(Created: Author)
Name of the City Average Temperature Relative Humidity
F C
Greenville, NC 42 5.52 78.4
Phoenix, Arizona 51 10.5 39.8
Prescott, Arizona 31.2 -0.42 39
Boston, Massachusetts 38.4 3.5 73.4
Fargo, North Dakota 14.6 -9.62 82.2
Miami, Florida 78.4 25.76 93.6
(Created: Author)
9WEATHER REPORT ANALYSIS
C.
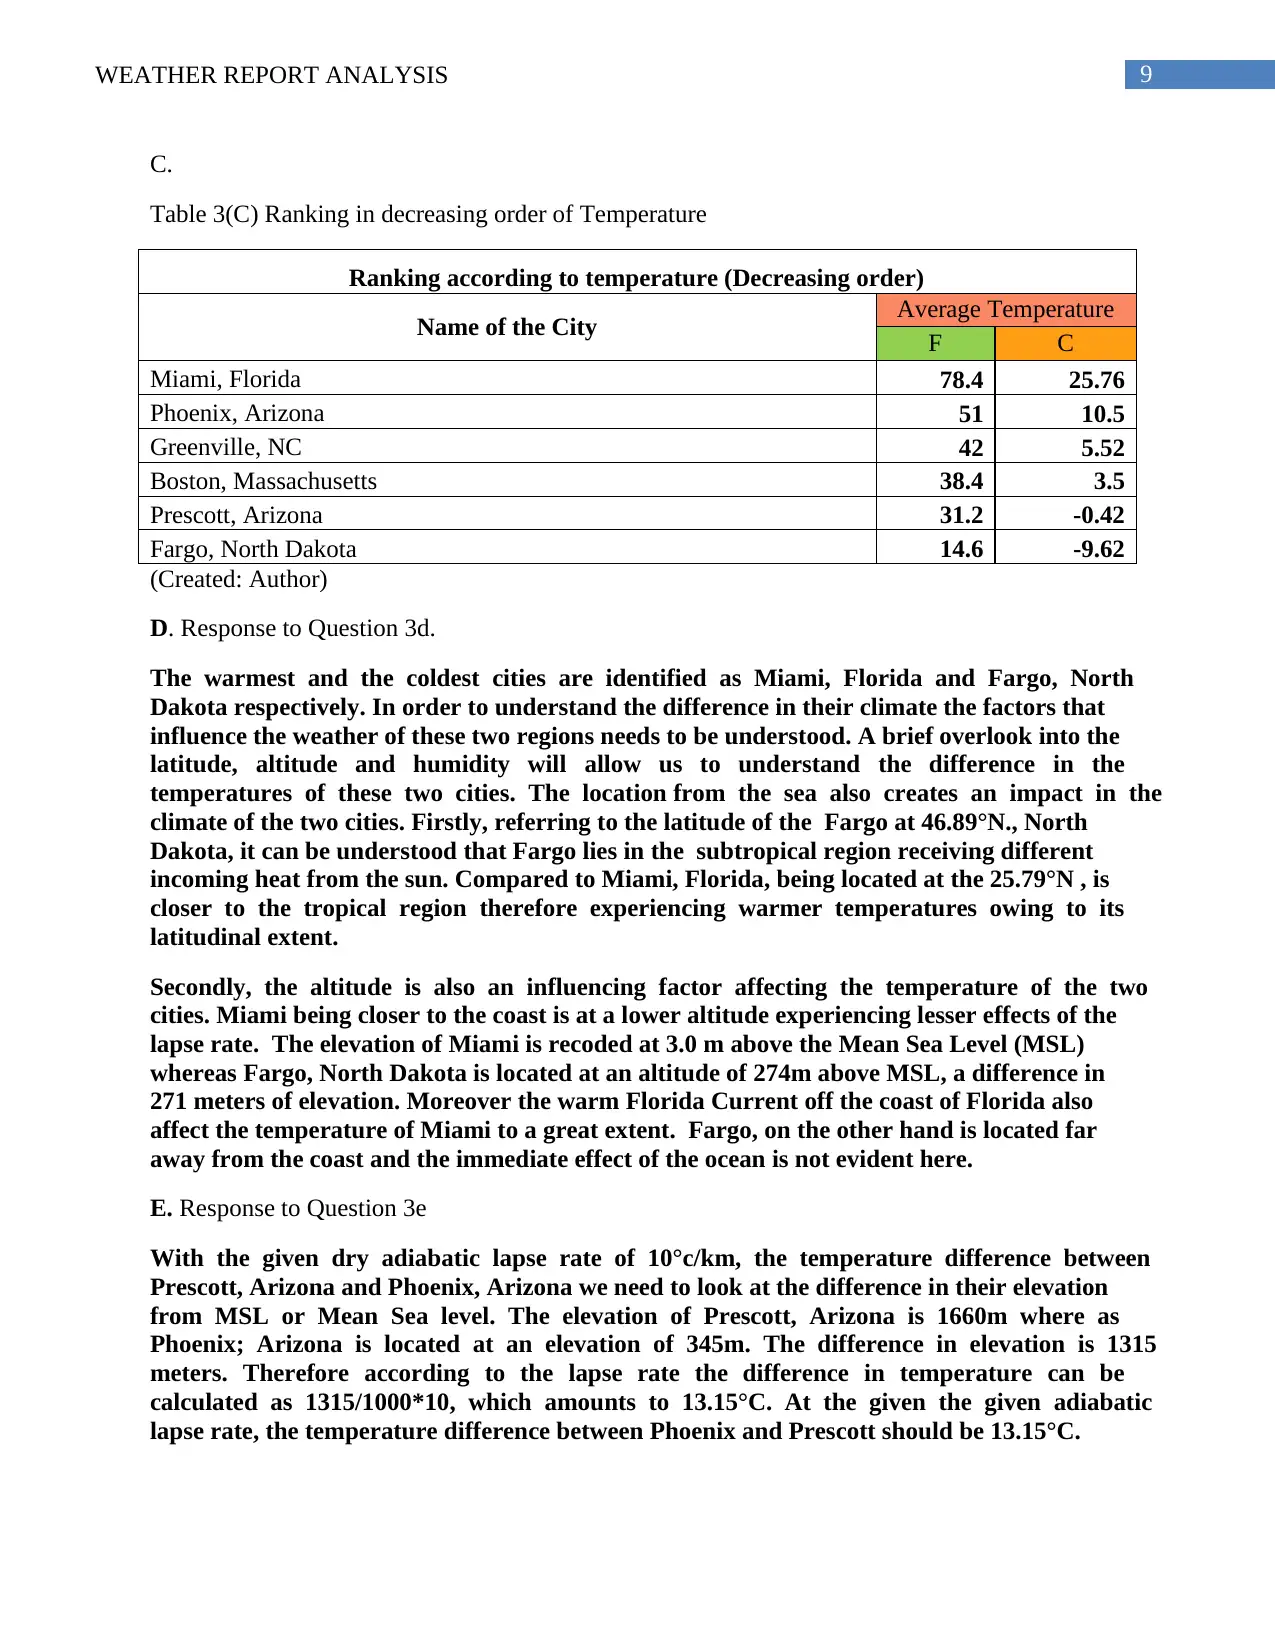
Table 3(C) Ranking in decreasing order of Temperature
Ranking according to temperature (Decreasing order)
Name of the City Average Temperature
F C
Miami, Florida 78.4 25.76
Phoenix, Arizona 51 10.5
Greenville, NC 42 5.52
Boston, Massachusetts 38.4 3.5
Prescott, Arizona 31.2 -0.42
Fargo, North Dakota 14.6 -9.62
(Created: Author)
D. Response to Question 3d.
The warmest and the coldest cities are identified as Miami, Florida and Fargo, North
Dakota respectively. In order to understand the difference in their climate the factors that
influence the weather of these two regions needs to be understood. A brief overlook into the
latitude, altitude and humidity will allow us to understand the difference in the
temperatures of these two cities. The location from the sea also creates an impact in the
climate of the two cities. Firstly, referring to the latitude of the Fargo at 46.89°N., North
Dakota, it can be understood that Fargo lies in the subtropical region receiving different
incoming heat from the sun. Compared to Miami, Florida, being located at the 25.79°N , is
closer to the tropical region therefore experiencing warmer temperatures owing to its
latitudinal extent.
Secondly, the altitude is also an influencing factor affecting the temperature of the two
cities. Miami being closer to the coast is at a lower altitude experiencing lesser effects of the
lapse rate. The elevation of Miami is recoded at 3.0 m above the Mean Sea Level (MSL)
whereas Fargo, North Dakota is located at an altitude of 274m above MSL, a difference in
271 meters of elevation. Moreover the warm Florida Current off the coast of Florida also
affect the temperature of Miami to a great extent. Fargo, on the other hand is located far
away from the coast and the immediate effect of the ocean is not evident here.
E. Response to Question 3e
With the given dry adiabatic lapse rate of 10°c/km, the temperature difference between
Prescott, Arizona and Phoenix, Arizona we need to look at the difference in their elevation
from MSL or Mean Sea level. The elevation of Prescott, Arizona is 1660m where as
Phoenix; Arizona is located at an elevation of 345m. The difference in elevation is 1315
meters. Therefore according to the lapse rate the difference in temperature can be
calculated as 1315/1000*10, which amounts to 13.15°C. At the given the given adiabatic
lapse rate, the temperature difference between Phoenix and Prescott should be 13.15°C.
C.
Table 3(C) Ranking in decreasing order of Temperature
Ranking according to temperature (Decreasing order)
Name of the City Average Temperature
F C
Miami, Florida 78.4 25.76
Phoenix, Arizona 51 10.5
Greenville, NC 42 5.52
Boston, Massachusetts 38.4 3.5
Prescott, Arizona 31.2 -0.42
Fargo, North Dakota 14.6 -9.62
(Created: Author)
D. Response to Question 3d.
The warmest and the coldest cities are identified as Miami, Florida and Fargo, North
Dakota respectively. In order to understand the difference in their climate the factors that
influence the weather of these two regions needs to be understood. A brief overlook into the
latitude, altitude and humidity will allow us to understand the difference in the
temperatures of these two cities. The location from the sea also creates an impact in the
climate of the two cities. Firstly, referring to the latitude of the Fargo at 46.89°N., North
Dakota, it can be understood that Fargo lies in the subtropical region receiving different
incoming heat from the sun. Compared to Miami, Florida, being located at the 25.79°N , is
closer to the tropical region therefore experiencing warmer temperatures owing to its
latitudinal extent.
Secondly, the altitude is also an influencing factor affecting the temperature of the two
cities. Miami being closer to the coast is at a lower altitude experiencing lesser effects of the
lapse rate. The elevation of Miami is recoded at 3.0 m above the Mean Sea Level (MSL)
whereas Fargo, North Dakota is located at an altitude of 274m above MSL, a difference in
271 meters of elevation. Moreover the warm Florida Current off the coast of Florida also
affect the temperature of Miami to a great extent. Fargo, on the other hand is located far
away from the coast and the immediate effect of the ocean is not evident here.
E. Response to Question 3e
With the given dry adiabatic lapse rate of 10°c/km, the temperature difference between
Prescott, Arizona and Phoenix, Arizona we need to look at the difference in their elevation
from MSL or Mean Sea level. The elevation of Prescott, Arizona is 1660m where as
Phoenix; Arizona is located at an elevation of 345m. The difference in elevation is 1315
meters. Therefore according to the lapse rate the difference in temperature can be
calculated as 1315/1000*10, which amounts to 13.15°C. At the given the given adiabatic
lapse rate, the temperature difference between Phoenix and Prescott should be 13.15°C.
10WEATHER REPORT ANALYSIS
F. Response to question no. 3f
The major difference in the average temperature of Phoenix and Prescott is due to the
variation in their altitudes. The cities lie in close in proximity to each other, and the
Relative Humidity is nearly similar. The fact that Prescott is located at a fairly higher
altitude than Phoenix, Arizona, this decreases the temperature at normal lapse rate causing
differences in the temperature.
G. Response to Question no. 3g
The most and the least humid cities include the Miami, Florida and the Prescott, Arizona
respectively. The humidity of a region is mostly dependent upon the temperature of the
region. Taking a look at the temperature status of Miami, Florida and Prescott, we can
understand that Miami being at a lower latitude, closer to tropic and being closer to sea
experiences higher temperatures than Prescott, Arizona. Humidity of a place is the actually
the amount of water vapour present in the air, which is directly related to the amount of
moisture that a parcel of air can hold. Miami, Florida being located near the sea will
obviously experience more humidity since the temperature being high and the supply of
moisture from the sea adds to the humid condition of the city. On the other hand Prescott
being higher in the altitude, and far away from the sea, experiences lesser temperatures
which allow for less humidity to be present. The average temperature of Prescott being
negative, the chance for moisture to exist in dry air decreases. Most of the moisture is
condensed before creating conditions for humidity.
H. Response to question no. 3h
Fargo, North Dakota has the strongest wind speed, the average wind speed being 10. 4
miles per hour. Fargo lies in the region of Low pressure with and data of the consecutive
days reveal the changing barometric pressure over Fargo. As it is known the wind speed is
affected by the pressure overlying in the region and wind moves from regions of high
pressure to regions of low pressure. There have been high and low pressure conditions over
Fargo over the five day period and we can find a stationary front over the region giving it
high pressure. Fargo has experienced wind flow regularly during the observation period.
The alternating high and low pressure in the region has created such cases of wind flow
resulting in high wind speed among the surveyed stations over the five day period.
Secure Best Marks with AI Grader
Need help grading? Try our AI Grader for instant feedback on your assignments.
11WEATHER REPORT ANALYSIS
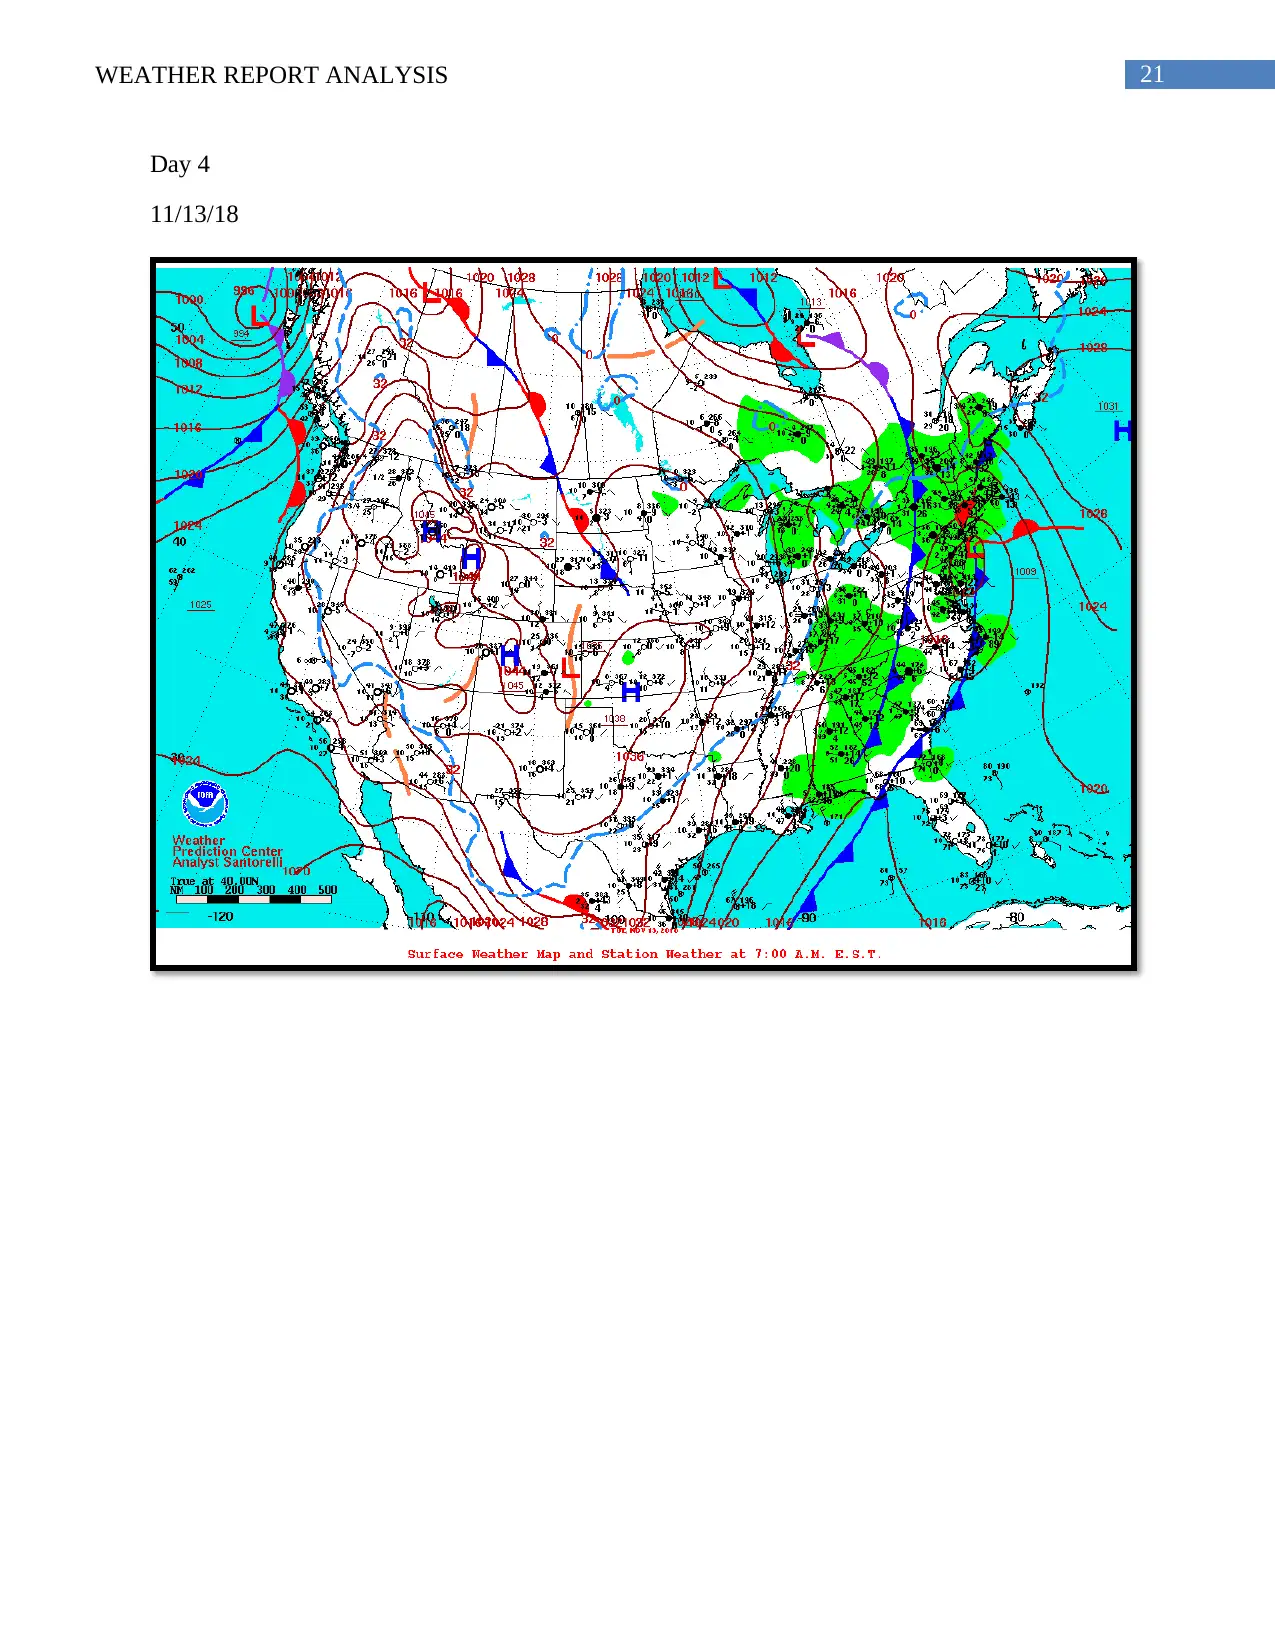
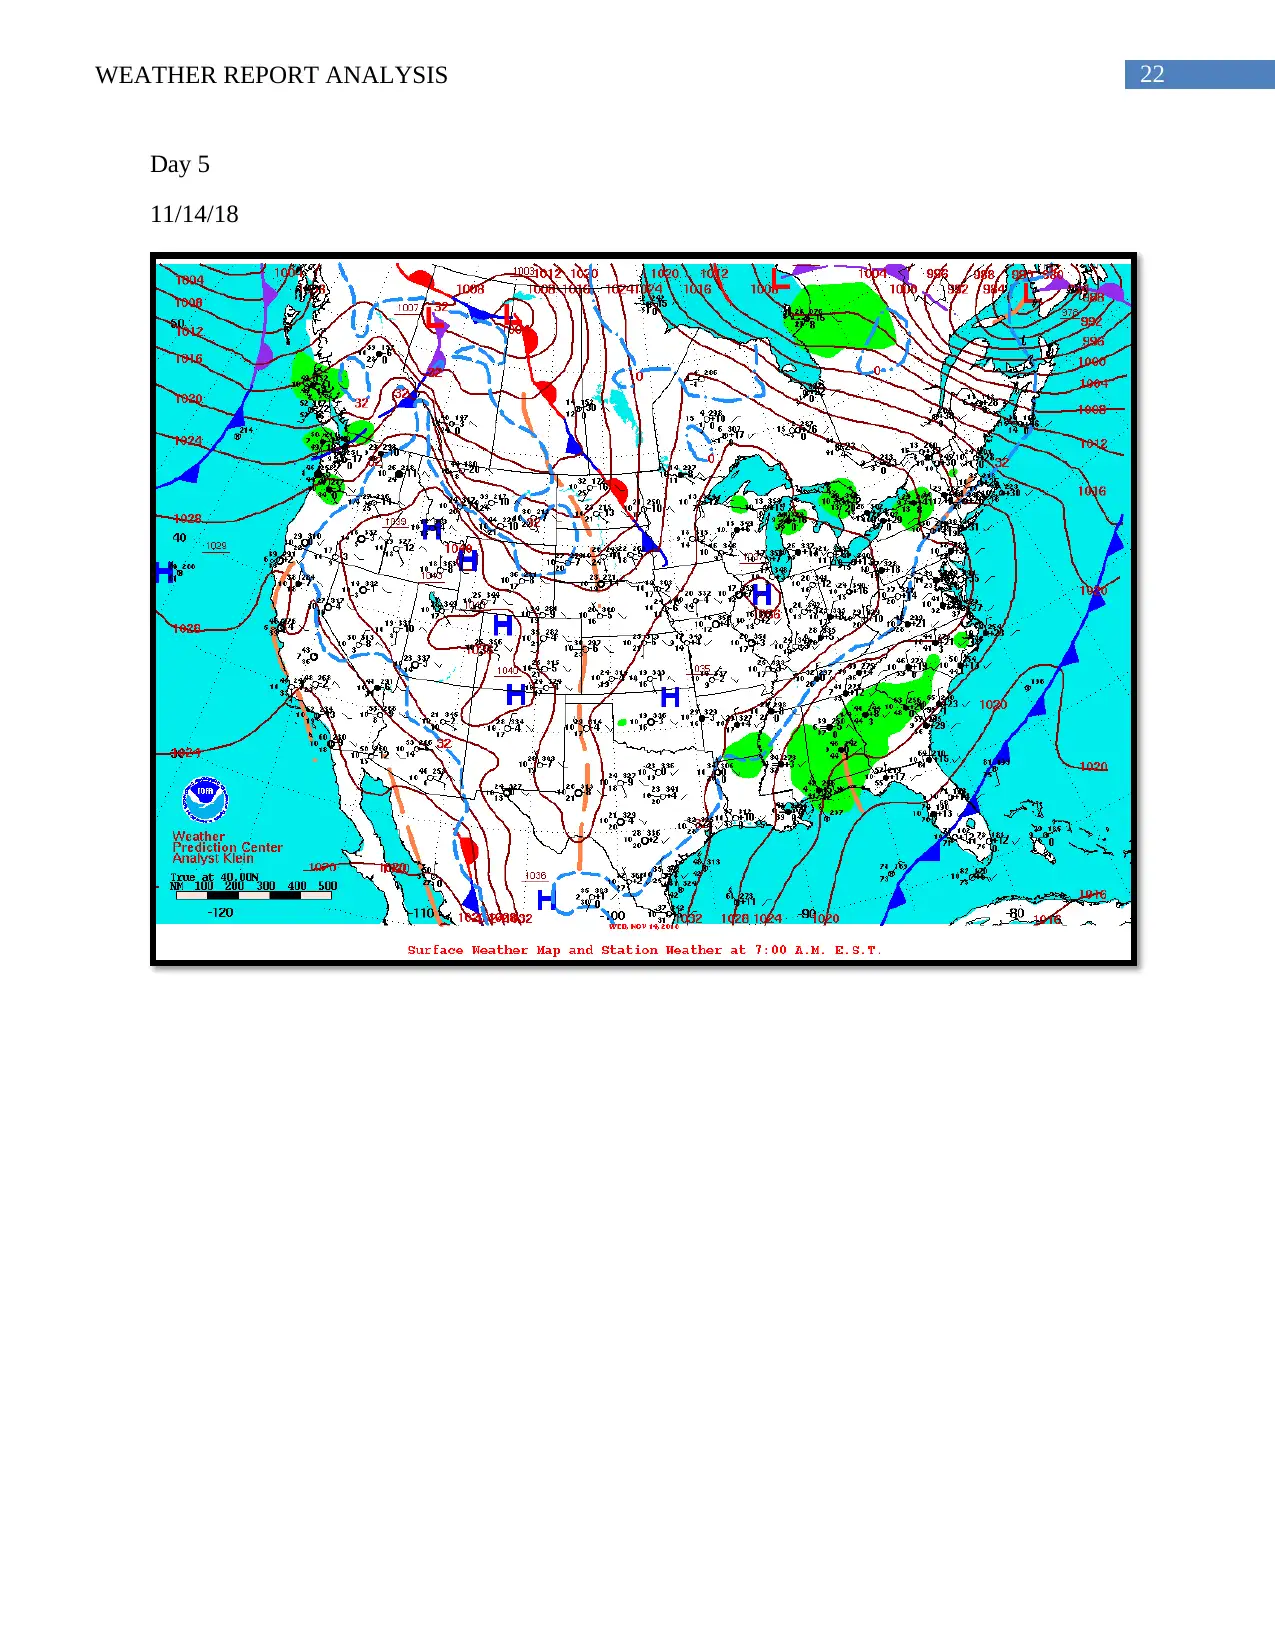
I. Response to Question no. i
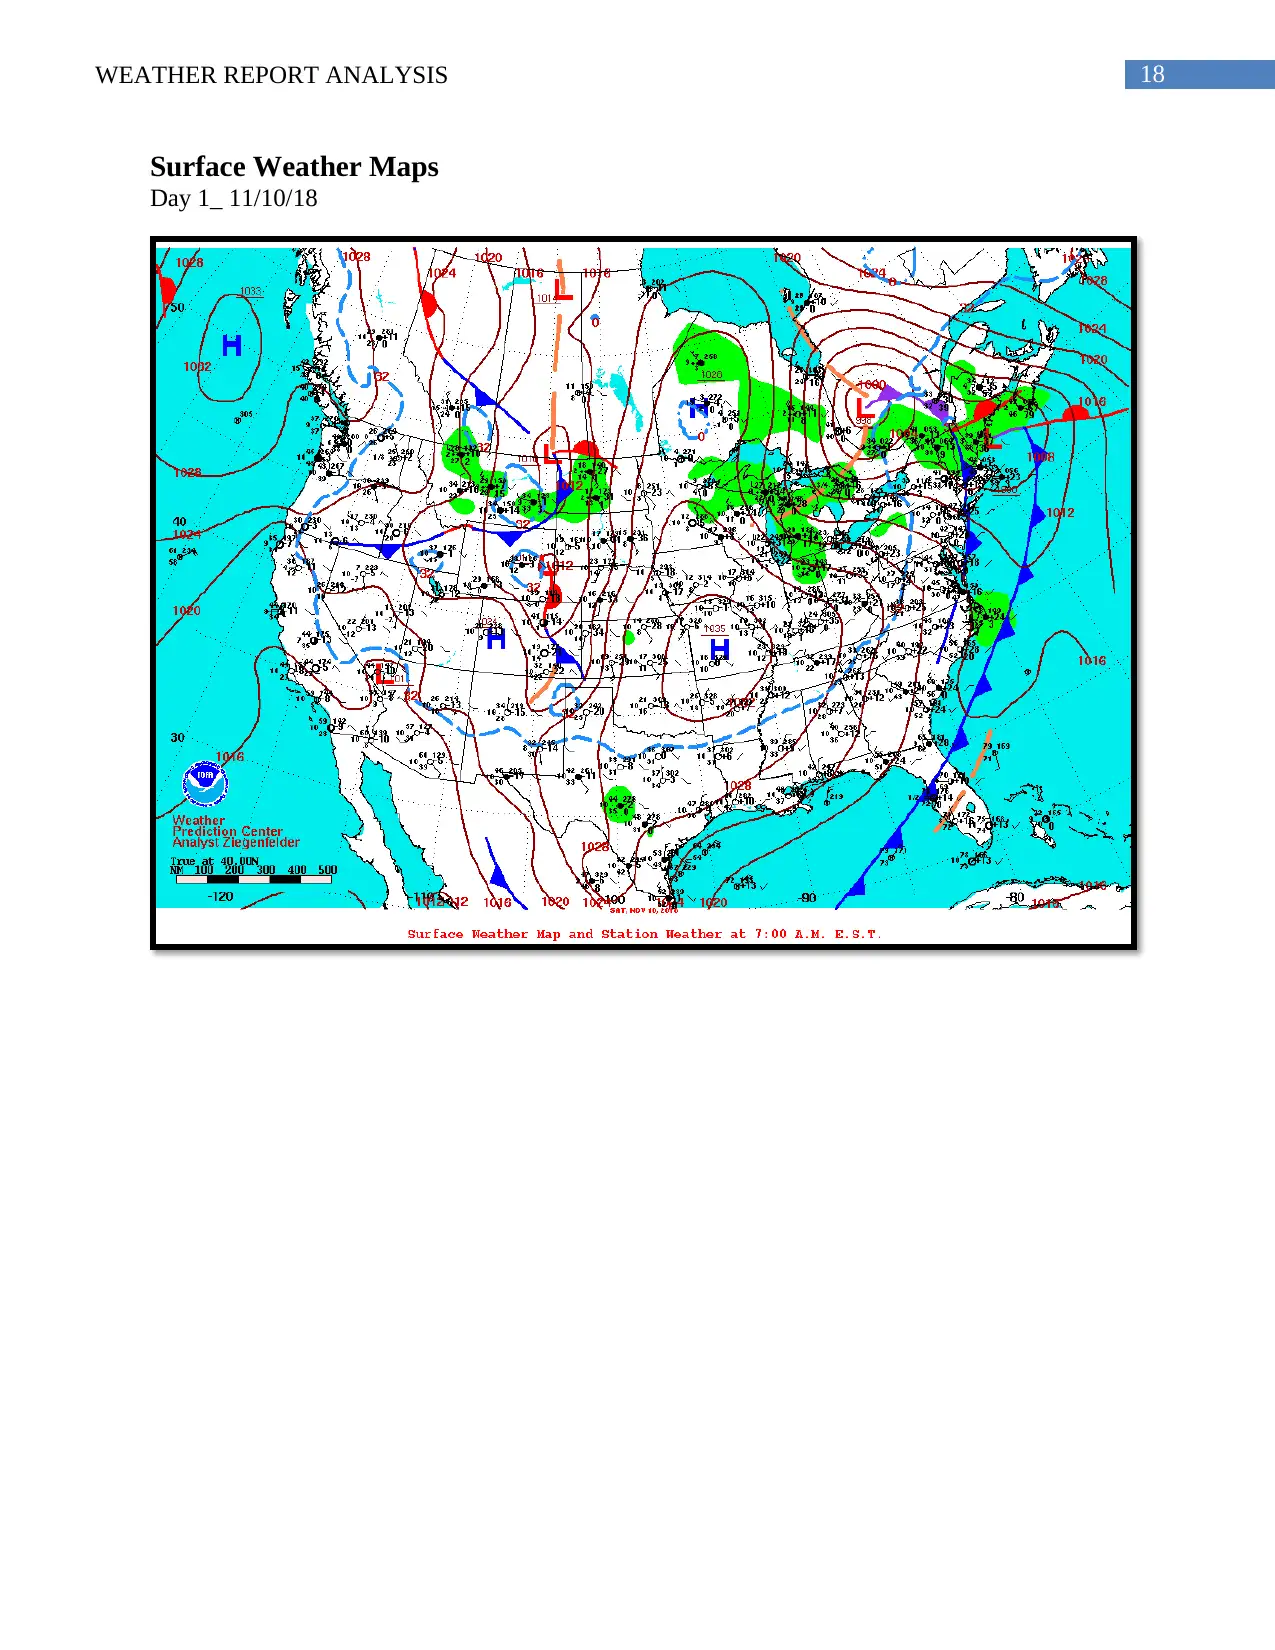
The cities near the coast have majorly experienced fronts during the observation period
and passage of mostly cold fronts are seen over Boston, Massachusetts; Greenville, North
Carolina; and Miami, Florida. The existence of the cold fronts is seen on 10 th of November
over Boston and Miami. Cold front is also observed on 13th and 14th of November over
Greenville city, North Carolina; Boston, Massachusetts; Miami, Florida. The synoptic
charts were obtained at 7:00am EST and 12:00 pm at Zulu time or UST. Prescott and
Phoenix did not experience any frontal occurrences. However, Fargo, north Dakota and
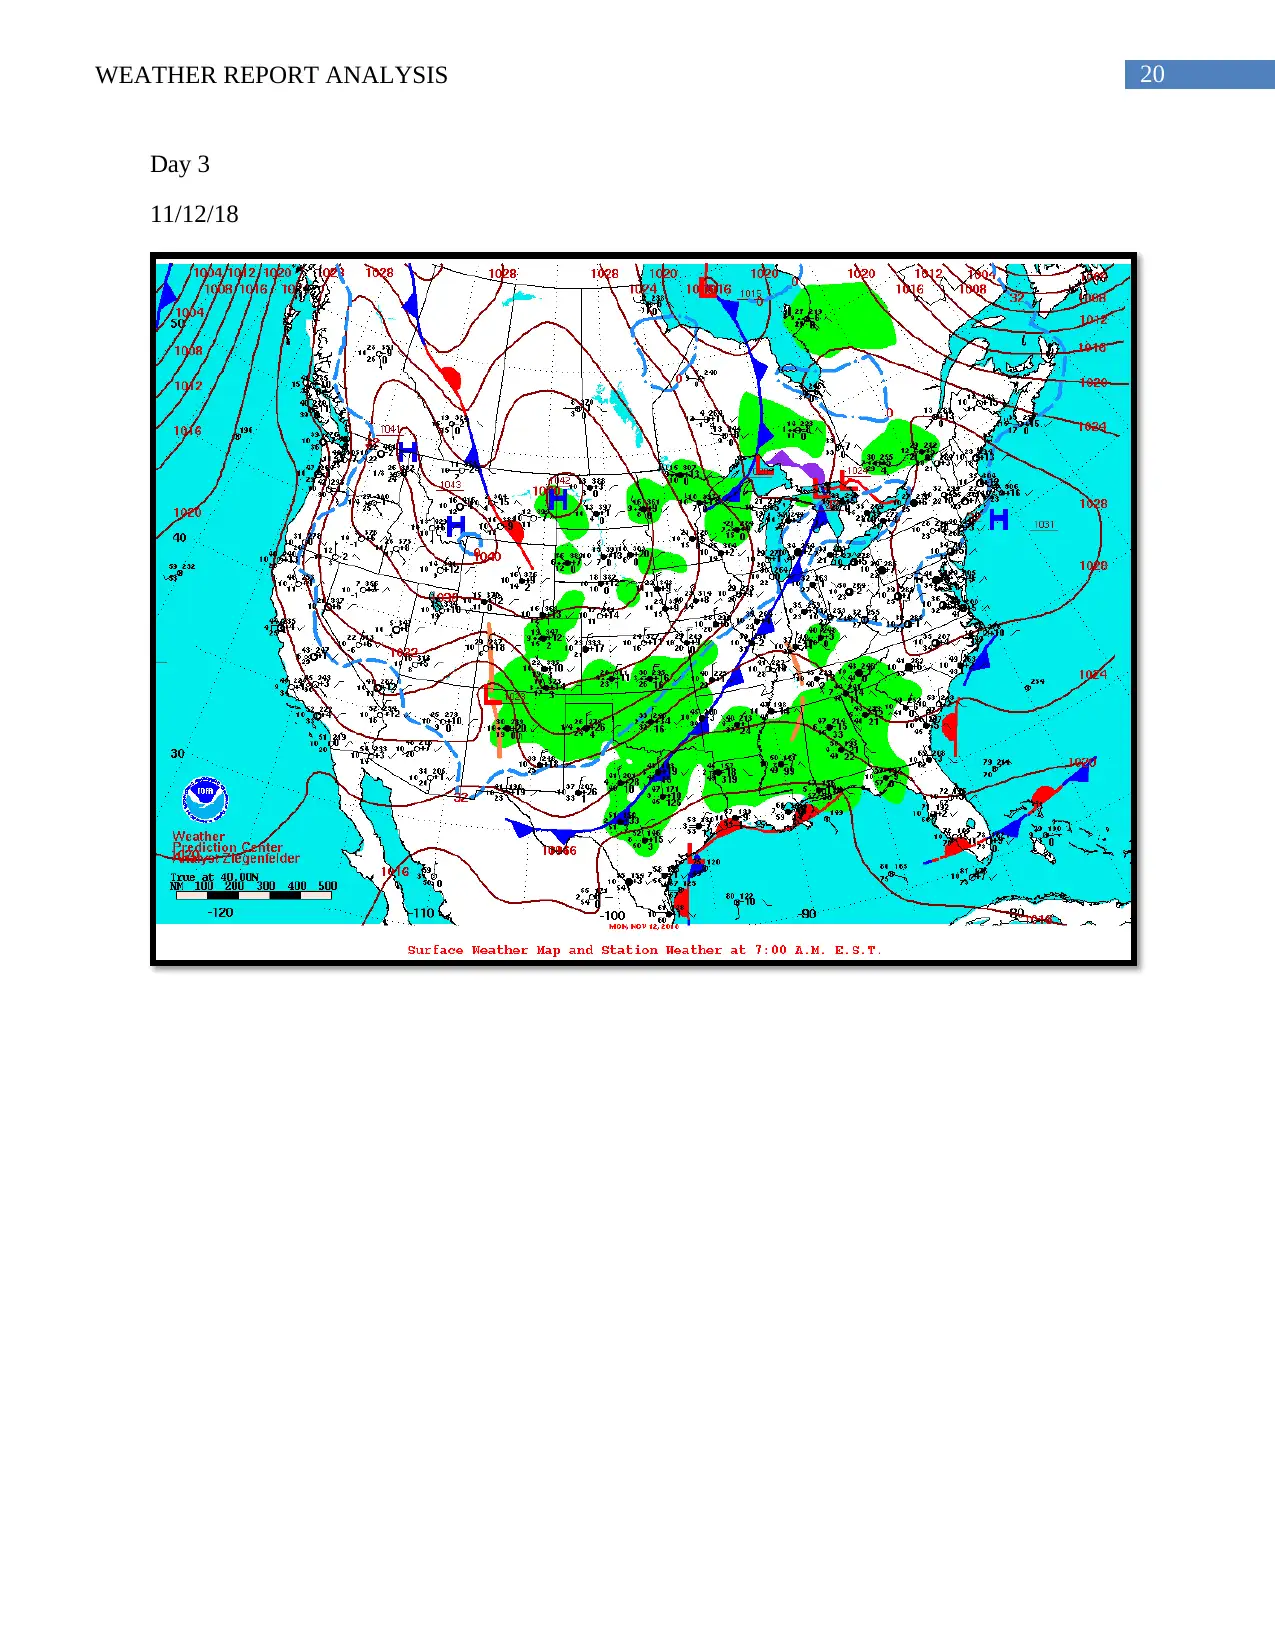
Miami, Florida did experience Occluded Fronts on 13 th of November and 12 th of November
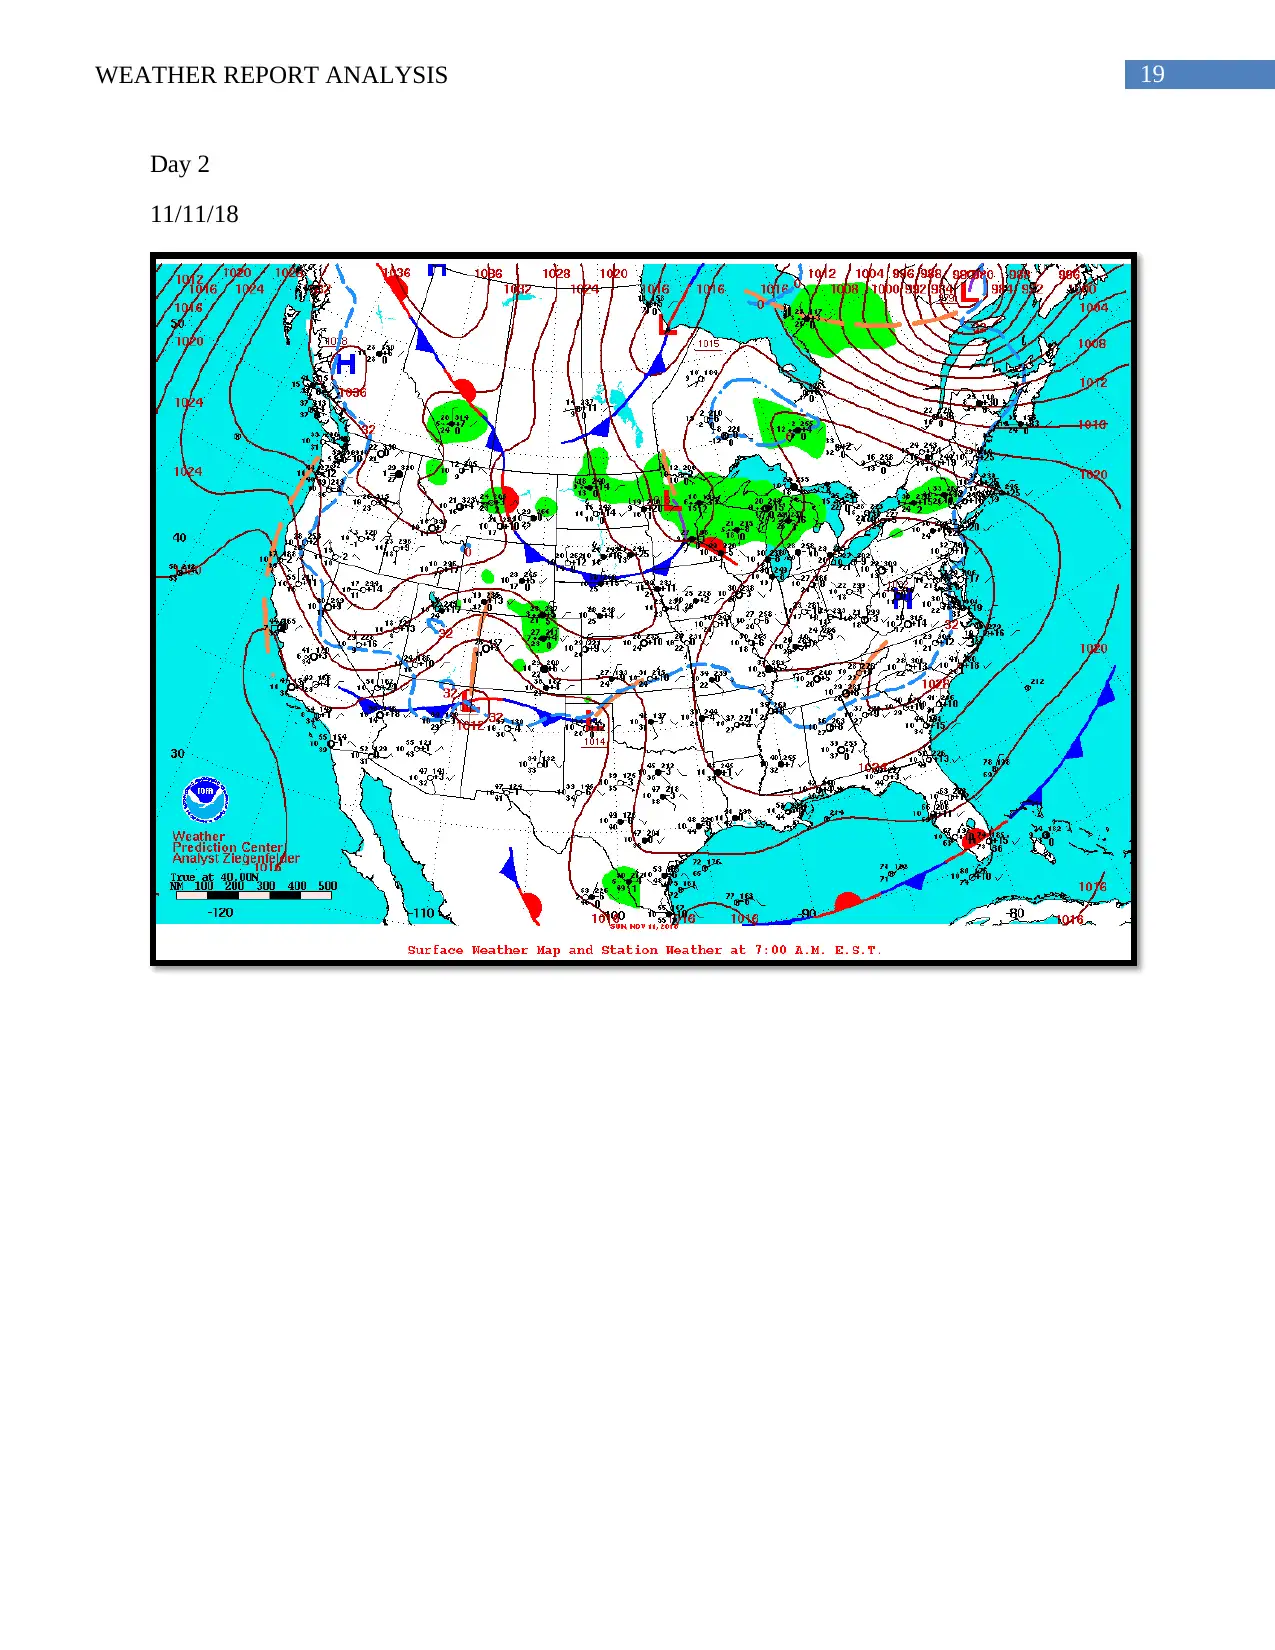
respectively. Miami also observes Occluded fronts during 11th and 12th of November.
The change in the weather can be observed from the changing pressure and frontal
passages. A brief look at the temperature of the survey stations prior to the fronts gives an
indication of their effect. There is a change of temperature in Miami on12th when we find
an Occluded front over it. The temperature drops thereafter with the incoming cold
Frontal passage. There is a change in barometric pressure along with the change in the
fonts. A rise in humidity is also observed with the existing cold fronts. Once the frontal
activity has passed, we find a drop in temperature, an increase in barometric pressure, a
increase in specific humidity and wind flow over the region. Passing of the fronts is
generally characterized with wind movements which have been observed from the collected
data. Generally a gust is experienced while passage of the front and there is gust
observation in the data. Fargo, North Dakota mostly experienced Occluded fronts during
the observation period has experienced weather conditions with colder temperatures and
regular wind movements. This is mostly due to the occlusion of the warm and cold fronts.
The average wind speed of Fargo being 10.4 miles per hour with moderately high relative
humidity. Generally occluded fronts are experienced by stormy weather but we find clear
weather conditions on 14 th for Fargo. Miami mostly experienced calm weather in terms of
winds and experienced gust during the recorded observation on 12 th with an occluded front
during that day. Boston was mostly windy with clear weather during the frontal passage.
Mostly cold fronts with high humidity and low pressures with the existence of the front.
Prescott and Phoenix have experienced mostly normal weather with cloud covers. Phoenix
had low pressures in the initial days and gradually rising thereafter. Low humidity with
relative moderate temperature was observed. No Frontal passage is seen over both Phoenix
and Prescott during the observation period. Greenville has experienced light rain prior to
the frontal passage. There had been fairly low temperature and above average barometric
pressure over the observation period. There was a cold front on 13th of November over
Greenville, north Carolina and the barometric pressure had reduced to 1017.5 milibars
during that day.
No instances of extratropical cyclones have been observed, but conditions closer to
formation of extra tropical cyclones were present. General conditions with mild weather
I. Response to Question no. i
The cities near the coast have majorly experienced fronts during the observation period
and passage of mostly cold fronts are seen over Boston, Massachusetts; Greenville, North
Carolina; and Miami, Florida. The existence of the cold fronts is seen on 10 th of November
over Boston and Miami. Cold front is also observed on 13th and 14th of November over
Greenville city, North Carolina; Boston, Massachusetts; Miami, Florida. The synoptic
charts were obtained at 7:00am EST and 12:00 pm at Zulu time or UST. Prescott and
Phoenix did not experience any frontal occurrences. However, Fargo, north Dakota and
Miami, Florida did experience Occluded Fronts on 13 th of November and 12 th of November
respectively. Miami also observes Occluded fronts during 11th and 12th of November.
The change in the weather can be observed from the changing pressure and frontal
passages. A brief look at the temperature of the survey stations prior to the fronts gives an
indication of their effect. There is a change of temperature in Miami on12th when we find
an Occluded front over it. The temperature drops thereafter with the incoming cold
Frontal passage. There is a change in barometric pressure along with the change in the
fonts. A rise in humidity is also observed with the existing cold fronts. Once the frontal
activity has passed, we find a drop in temperature, an increase in barometric pressure, a
increase in specific humidity and wind flow over the region. Passing of the fronts is
generally characterized with wind movements which have been observed from the collected
data. Generally a gust is experienced while passage of the front and there is gust
observation in the data. Fargo, North Dakota mostly experienced Occluded fronts during
the observation period has experienced weather conditions with colder temperatures and
regular wind movements. This is mostly due to the occlusion of the warm and cold fronts.
The average wind speed of Fargo being 10.4 miles per hour with moderately high relative
humidity. Generally occluded fronts are experienced by stormy weather but we find clear
weather conditions on 14 th for Fargo. Miami mostly experienced calm weather in terms of
winds and experienced gust during the recorded observation on 12 th with an occluded front
during that day. Boston was mostly windy with clear weather during the frontal passage.
Mostly cold fronts with high humidity and low pressures with the existence of the front.
Prescott and Phoenix have experienced mostly normal weather with cloud covers. Phoenix
had low pressures in the initial days and gradually rising thereafter. Low humidity with
relative moderate temperature was observed. No Frontal passage is seen over both Phoenix
and Prescott during the observation period. Greenville has experienced light rain prior to
the frontal passage. There had been fairly low temperature and above average barometric
pressure over the observation period. There was a cold front on 13th of November over
Greenville, north Carolina and the barometric pressure had reduced to 1017.5 milibars
during that day.
No instances of extratropical cyclones have been observed, but conditions closer to
formation of extra tropical cyclones were present. General conditions with mild weather
12WEATHER REPORT ANALYSIS
was experienced which normally are observed during extratropical cyclones. No instances
of extreme weather conditions are seen. Mostly during the observation period mild weather
with average conditions were observed across all the survey stations.
was experienced which normally are observed during extratropical cyclones. No instances
of extreme weather conditions are seen. Mostly during the observation period mild weather
with average conditions were observed across all the survey stations.
13WEATHER REPORT ANALYSIS
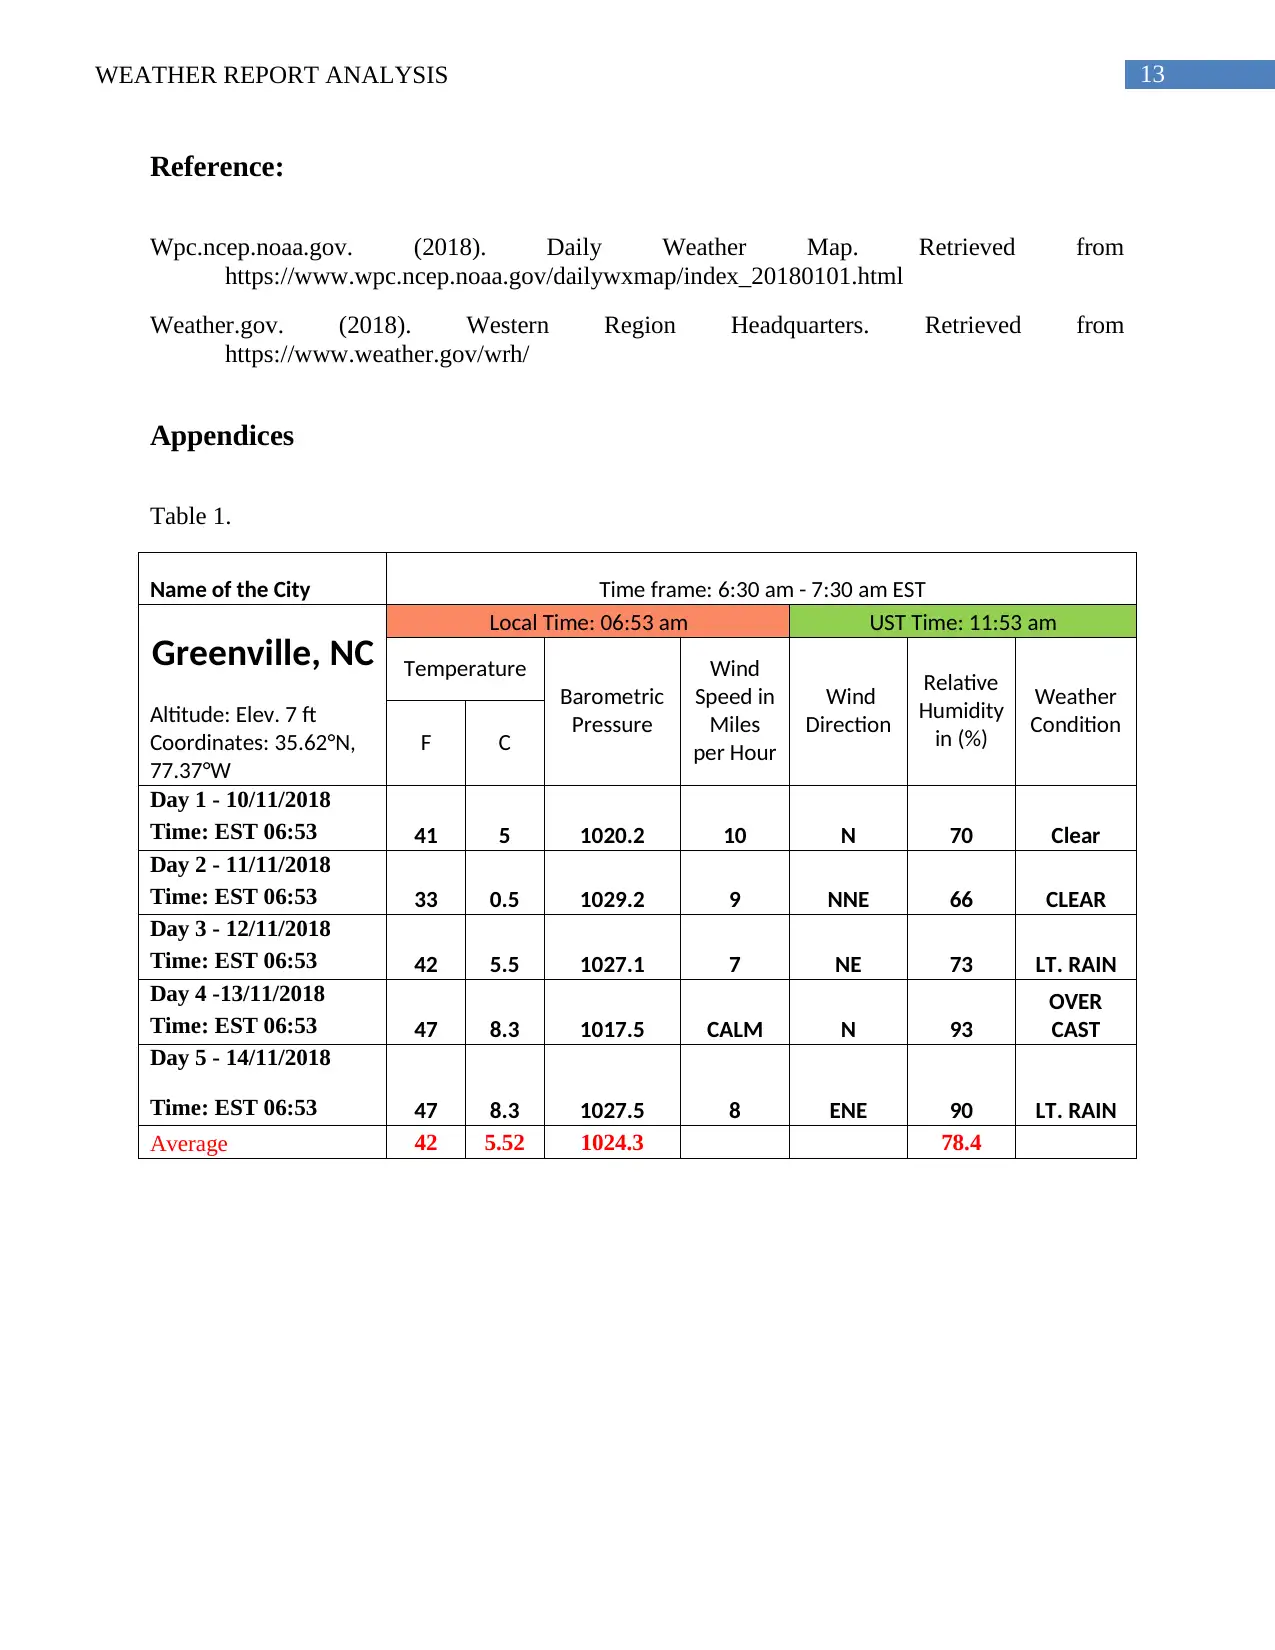
Reference:
Wpc.ncep.noaa.gov. (2018). Daily Weather Map. Retrieved from
https://www.wpc.ncep.noaa.gov/dailywxmap/index_20180101.html
Weather.gov. (2018). Western Region Headquarters. Retrieved from
https://www.weather.gov/wrh/
Appendices
Table 1.
Name of the City Time frame: 6:30 am - 7:30 am EST
Greenville, NC Local Time: 06:53 am UST Time: 11:53 am
Temperature
Barometric
Pressure
Wind
Speed in
Miles
per Hour
Wind
Direction
Relative
Humidity
in (%)
Weather
ConditionAltitude: Elev. 7 ft
Coordinates: 35.62°N,
77.37°W
F C
Day 1 - 10/11/2018
41 5 1020.2 10 N 70 ClearTime: EST 06:53
Day 2 - 11/11/2018
33 0.5 1029.2 9 NNE 66 CLEARTime: EST 06:53
Day 3 - 12/11/2018
42 5.5 1027.1 7 NE 73 LT. RAINTime: EST 06:53
Day 4 -13/11/2018
47 8.3 1017.5 CALM N 93
OVER
CASTTime: EST 06:53
Day 5 - 14/11/2018
47 8.3 1027.5 8 ENE 90 LT. RAINTime: EST 06:53
Average 42 5.52 1024.3 78.4
Paraphrase This Document
Need a fresh take? Get an instant paraphrase of this document with our AI Paraphraser
14WEATHER REPORT ANALYSIS
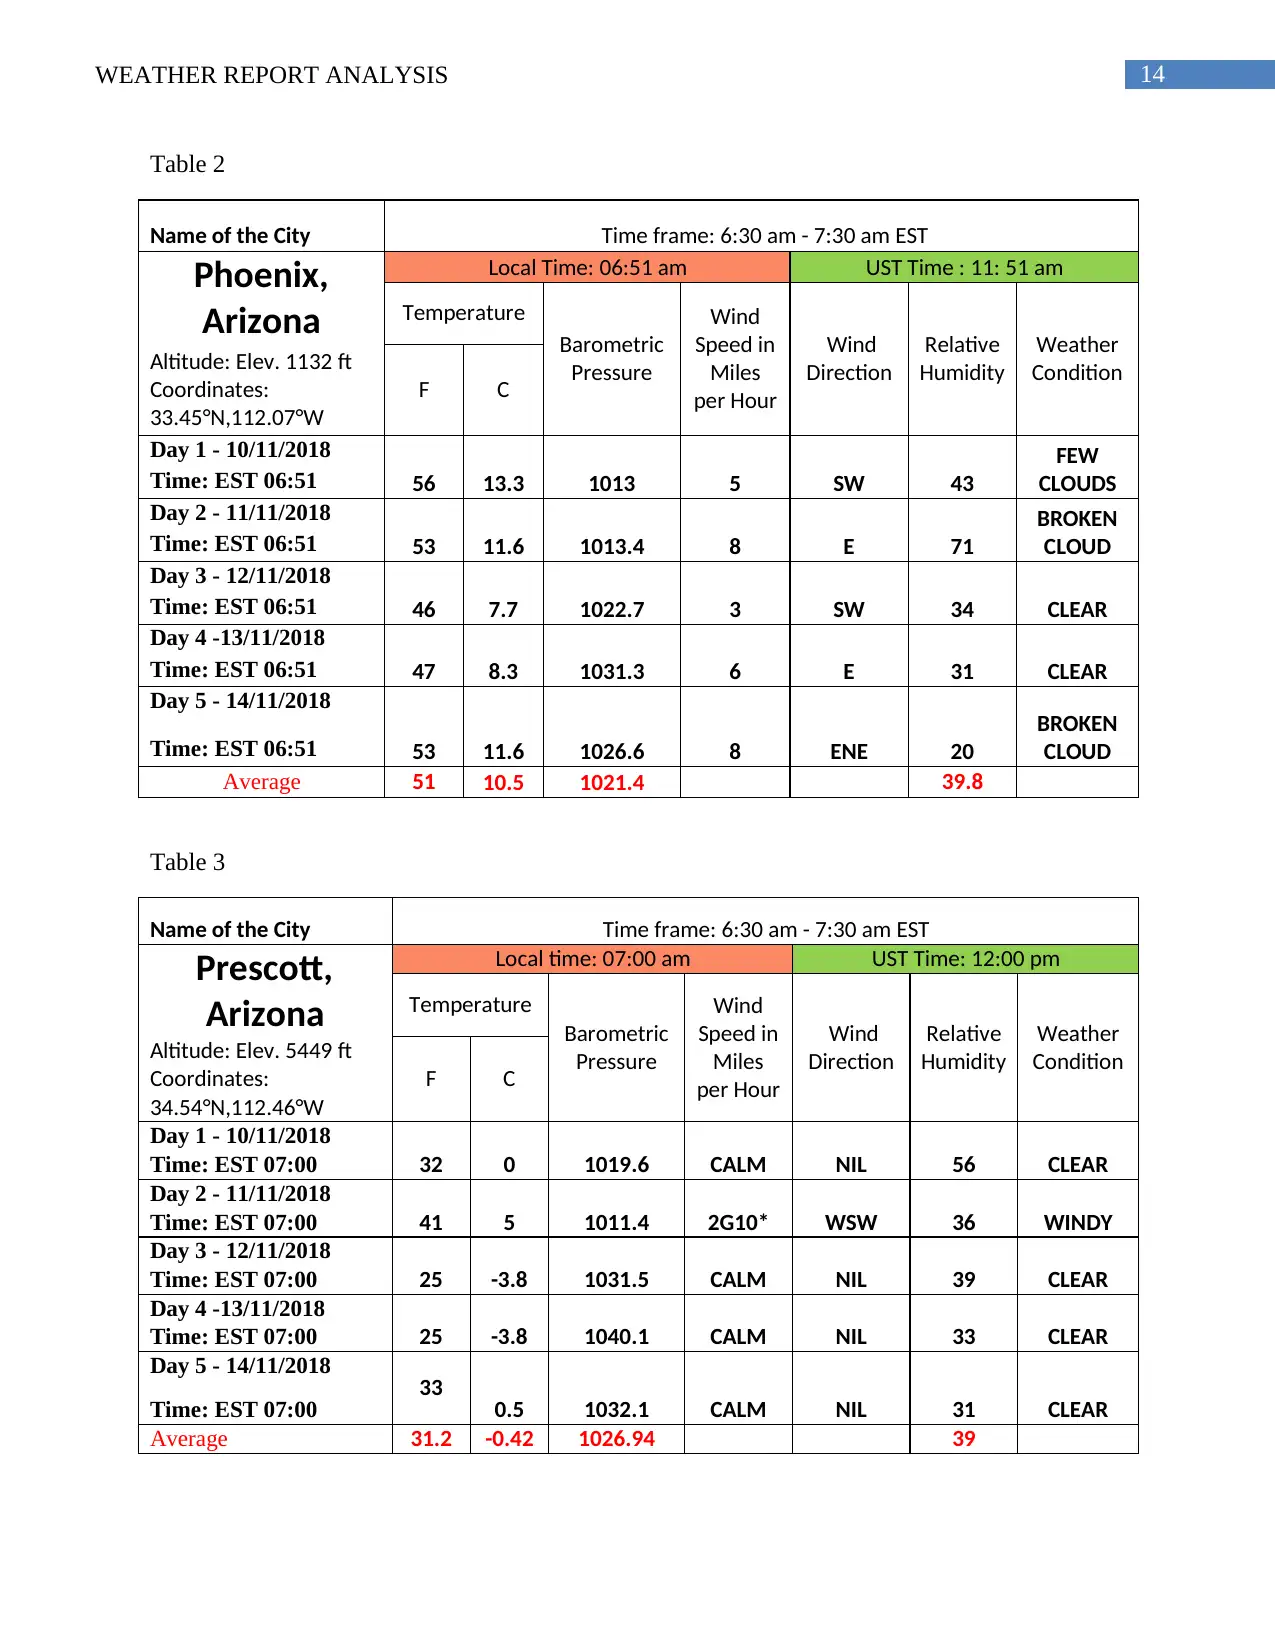
Table 2
Name of the City Time frame: 6:30 am - 7:30 am EST
Phoenix,
Arizona
Local Time: 06:51 am UST Time : 11: 51 am
Temperature
Barometric
Pressure
Wind
Speed in
Miles
per Hour
Wind
Direction
Relative
Humidity
Weather
ConditionAltitude: Elev. 1132 ft
Coordinates:
33.45°N,112.07°W
F C
Day 1 - 10/11/2018
56 13.3 1013 5 SW 43
FEW
CLOUDSTime: EST 06:51
Day 2 - 11/11/2018
53 11.6 1013.4 8 E 71
BROKEN
CLOUDTime: EST 06:51
Day 3 - 12/11/2018
46 7.7 1022.7 3 SW 34 CLEARTime: EST 06:51
Day 4 -13/11/2018
47 8.3 1031.3 6 E 31 CLEARTime: EST 06:51
Day 5 - 14/11/2018
53 11.6 1026.6 8 ENE 20
BROKEN
CLOUDTime: EST 06:51
Average 51 10.5 1021.4 39.8
Table 3
Name of the City Time frame: 6:30 am - 7:30 am EST
Prescott,
Arizona
Local time: 07:00 am UST Time: 12:00 pm
Temperature
Barometric
Pressure
Wind
Speed in
Miles
per Hour
Wind
Direction
Relative
Humidity
Weather
ConditionAltitude: Elev. 5449 ft
Coordinates:
34.54°N,112.46°W
F C
Day 1 - 10/11/2018
32 0 1019.6 CALM NIL 56 CLEARTime: EST 07:00
Day 2 - 11/11/2018
41 5 1011.4 2G10* WSW 36 WINDYTime: EST 07:00
Day 3 - 12/11/2018
25 -3.8 1031.5 CALM NIL 39 CLEARTime: EST 07:00
Day 4 -13/11/2018
25 -3.8 1040.1 CALM NIL 33 CLEARTime: EST 07:00
Day 5 - 14/11/2018 33 0.5 1032.1 CALM NIL 31 CLEARTime: EST 07:00
Average 31.2 -0.42 1026.94 39
15WEATHER REPORT ANALYSIS
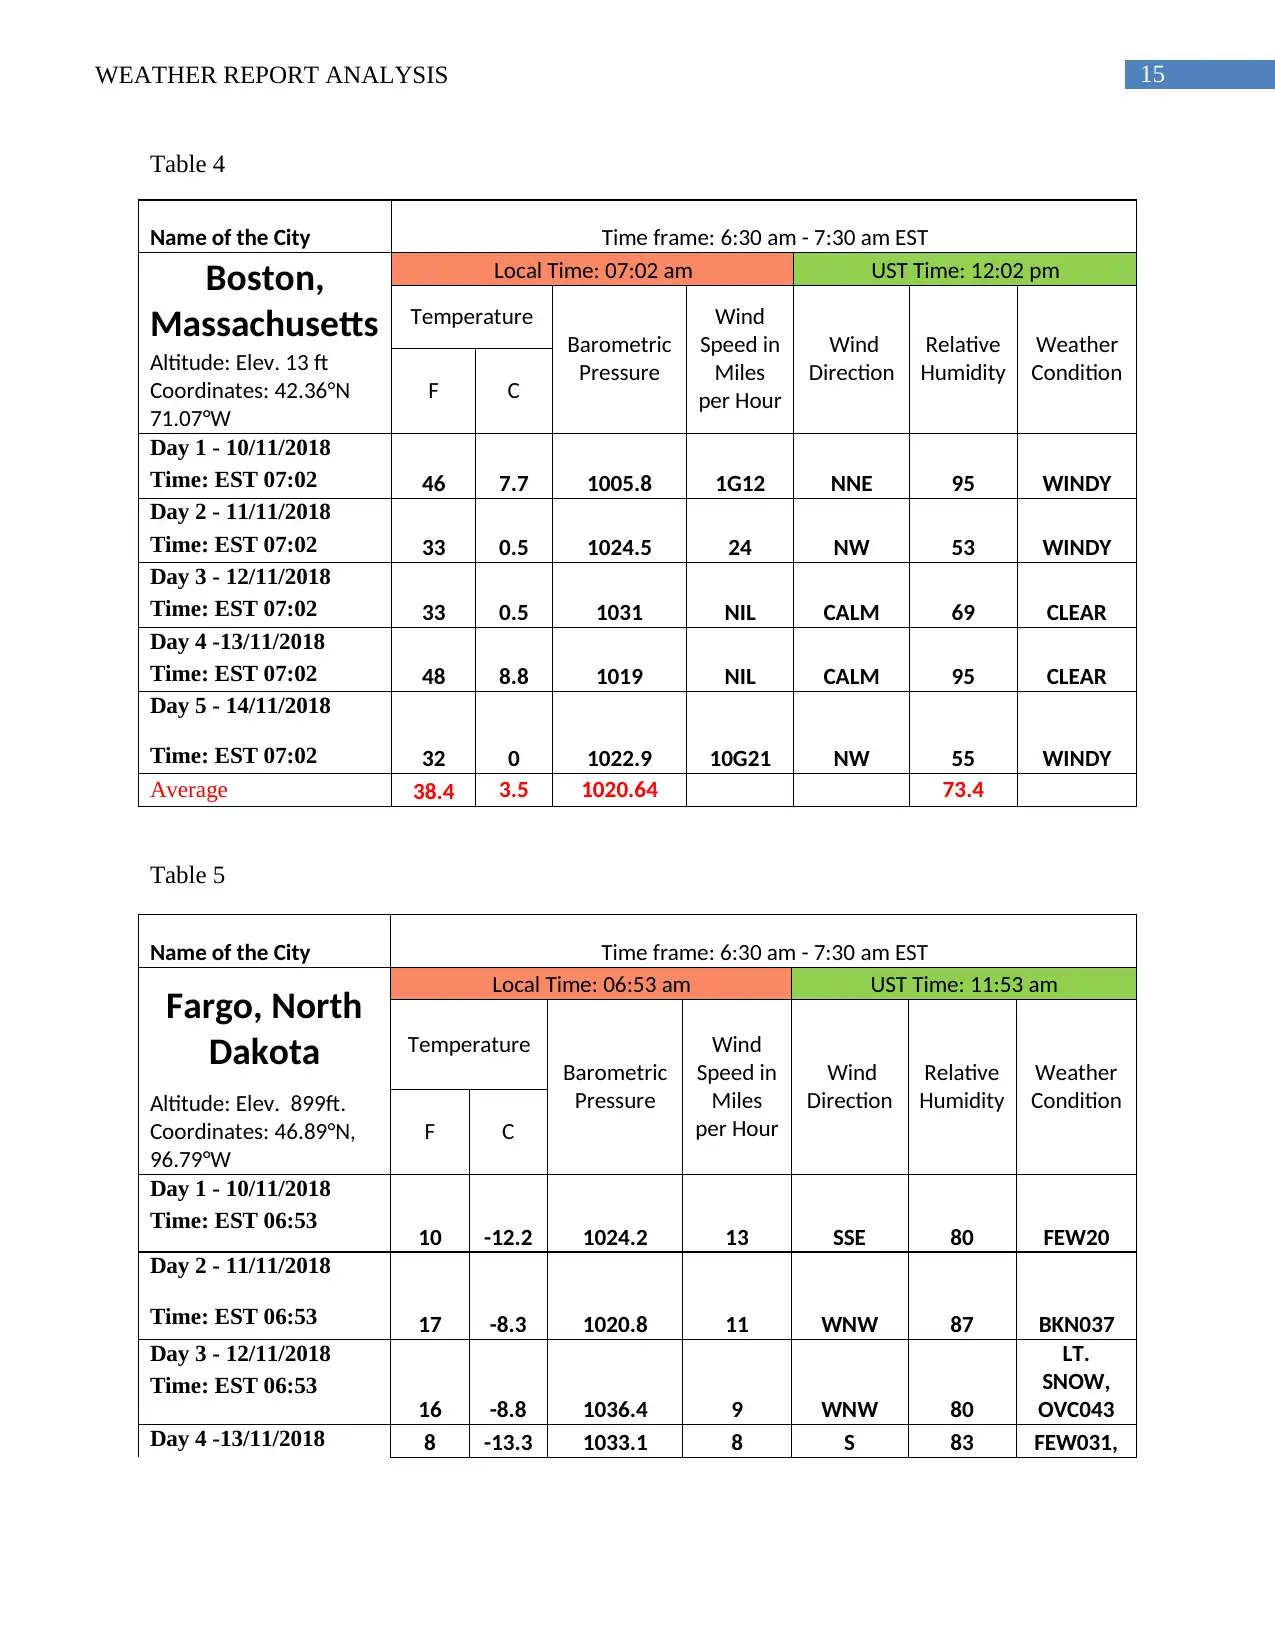
Table 4
Name of the City Time frame: 6:30 am - 7:30 am EST
Boston,
Massachusetts
Local Time: 07:02 am UST Time: 12:02 pm
Temperature
Barometric
Pressure
Wind
Speed in
Miles
per Hour
Wind
Direction
Relative
Humidity
Weather
ConditionAltitude: Elev. 13 ft
Coordinates: 42.36°N
71.07°W
F C
Day 1 - 10/11/2018
46 7.7 1005.8 1G12 NNE 95 WINDYTime: EST 07:02
Day 2 - 11/11/2018
33 0.5 1024.5 24 NW 53 WINDYTime: EST 07:02
Day 3 - 12/11/2018
33 0.5 1031 NIL CALM 69 CLEARTime: EST 07:02
Day 4 -13/11/2018
48 8.8 1019 NIL CALM 95 CLEARTime: EST 07:02
Day 5 - 14/11/2018
32 0 1022.9 10G21 NW 55 WINDYTime: EST 07:02
Average 38.4 3.5 1020.64 73.4
Table 5
Name of the City Time frame: 6:30 am - 7:30 am EST
Fargo, North
Dakota
Local Time: 06:53 am UST Time: 11:53 am
Temperature
Barometric
Pressure
Wind
Speed in
Miles
per Hour
Wind
Direction
Relative
Humidity
Weather
ConditionAltitude: Elev. 899ft.
Coordinates: 46.89°N,
96.79°W
F C
Day 1 - 10/11/2018
10 -12.2 1024.2 13 SSE 80 FEW20
Time: EST 06:53
Day 2 - 11/11/2018
17 -8.3 1020.8 11 WNW 87 BKN037Time: EST 06:53
Day 3 - 12/11/2018
16 -8.8 1036.4 9 WNW 80
LT.
SNOW,
OVC043
Time: EST 06:53
Day 4 -13/11/2018 8 -13.3 1033.1 8 S 83 FEW031,
16WEATHER REPORT ANALYSIS
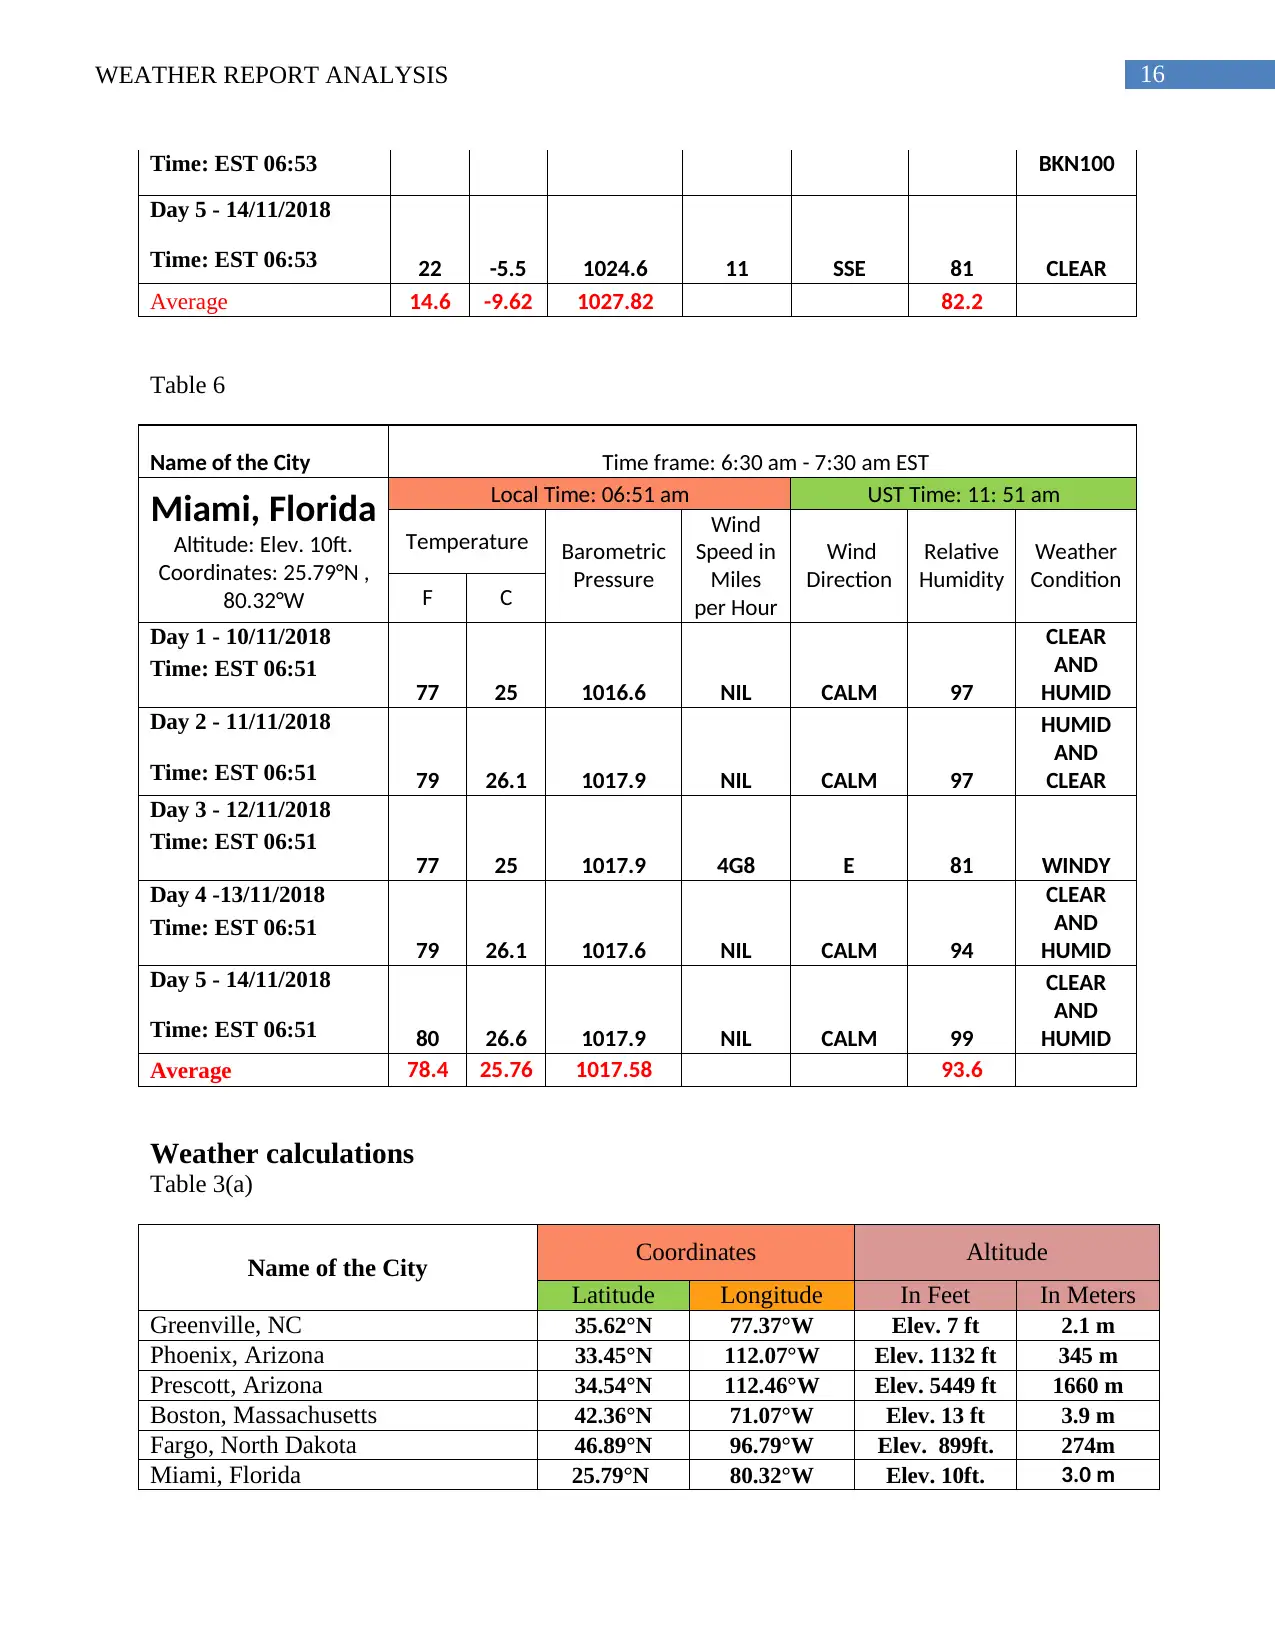
Time: EST 06:53 BKN100
Day 5 - 14/11/2018
22 -5.5 1024.6 11 SSE 81 CLEARTime: EST 06:53
Average 14.6 -9.62 1027.82 82.2
Table 6
Name of the City Time frame: 6:30 am - 7:30 am EST
Miami, Florida
Altitude: Elev. 10ft.
Coordinates: 25.79°N ,
80.32°W
Local Time: 06:51 am UST Time: 11: 51 am
Temperature Barometric
Pressure
Wind
Speed in
Miles
per Hour
Wind
Direction
Relative
Humidity
Weather
Condition
F C
Day 1 - 10/11/2018
77 25 1016.6 NIL CALM 97
CLEAR
AND
HUMID
Time: EST 06:51
Day 2 - 11/11/2018
79 26.1 1017.9 NIL CALM 97
HUMID
AND
CLEARTime: EST 06:51
Day 3 - 12/11/2018
77 25 1017.9 4G8 E 81 WINDY
Time: EST 06:51
Day 4 -13/11/2018
79 26.1 1017.6 NIL CALM 94
CLEAR
AND
HUMID
Time: EST 06:51
Day 5 - 14/11/2018
80 26.6 1017.9 NIL CALM 99
CLEAR
AND
HUMIDTime: EST 06:51
Average 78.4 25.76 1017.58 93.6
Weather calculations
Table 3(a)
Name of the City Coordinates Altitude
Latitude Longitude In Feet In Meters
Greenville, NC 35.62°N 77.37°W Elev. 7 ft 2.1 m
Phoenix, Arizona 33.45°N 112.07°W Elev. 1132 ft 345 m
Prescott, Arizona 34.54°N 112.46°W Elev. 5449 ft 1660 m
Boston, Massachusetts 42.36°N 71.07°W Elev. 13 ft 3.9 m
Fargo, North Dakota 46.89°N 96.79°W Elev. 899ft. 274m
Miami, Florida 25.79°N 80.32°W Elev. 10ft. 3.0 m
Secure Best Marks with AI Grader
Need help grading? Try our AI Grader for instant feedback on your assignments.
17WEATHER REPORT ANALYSIS
Table 3(b)
Name of the City Average Temperature Relative Humidity
F C
Greenville, NC 42 5.52 78.4
Phoenix, Arizona 51 10.5 39.8
Prescott, Arizona 31.2 -0.42 39
Boston, Massachusetts 38.4 3.5 73.4
Fargo, North Dakota 14.6 -9.62 82.2
Miami, Florida 78.4 25.76 93.6
Table 3(c)
Ranking according to temperature (Decreasing order)
Name of the City Average Temperature
F C
Miami, Florida 78.4 25.76
Phoenix, Arizona 51 10.5
Greenville, NC 42 5.52
Boston, Massachusetts 38.4 3.5
Prescott, Arizona 31.2 -0.42
Fargo, North Dakota 14.6 -9.62
18WEATHER REPORT ANALYSIS
Surface Weather Maps
Day 1_ 11/10/18
Surface Weather Maps
Day 1_ 11/10/18
19WEATHER REPORT ANALYSIS
Day 2
11/11/18
Day 2
11/11/18
Paraphrase This Document
Need a fresh take? Get an instant paraphrase of this document with our AI Paraphraser
20WEATHER REPORT ANALYSIS
Day 3
11/12/18
Day 3
11/12/18
21WEATHER REPORT ANALYSIS
Day 4
11/13/18
Day 4
11/13/18
22WEATHER REPORT ANALYSIS
Day 5
11/14/18
Day 5
11/14/18
1 out of 22
Your All-in-One AI-Powered Toolkit for Academic Success.
+13062052269
info@desklib.com
Available 24*7 on WhatsApp / Email
![[object Object]](/_next/static/media/star-bottom.7253800d.svg)
Unlock your academic potential
© 2024 | Zucol Services PVT LTD | All rights reserved.