Week 1 Project: Statistical Analysis and Hypothesis Testing Report
VerifiedAdded on 2023/01/06
|7
|1067
|28
Project
AI Summary
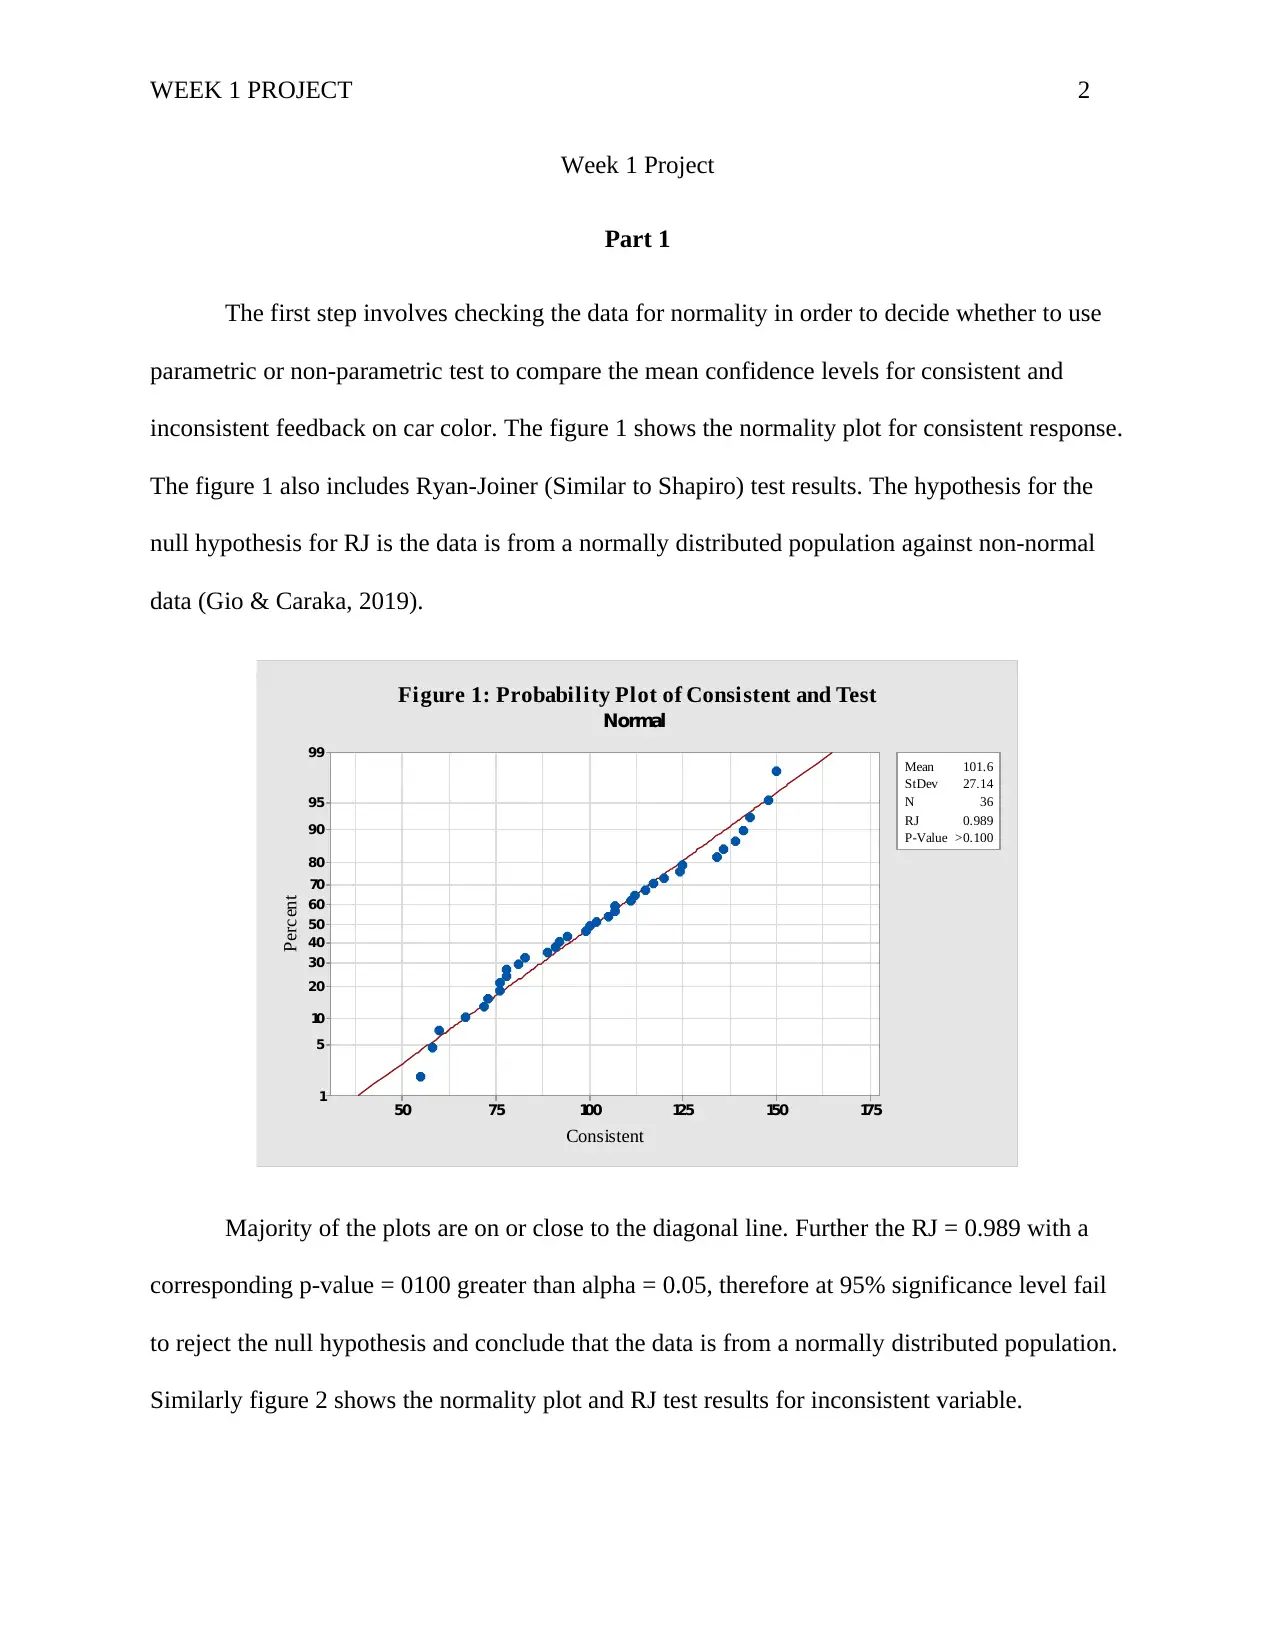
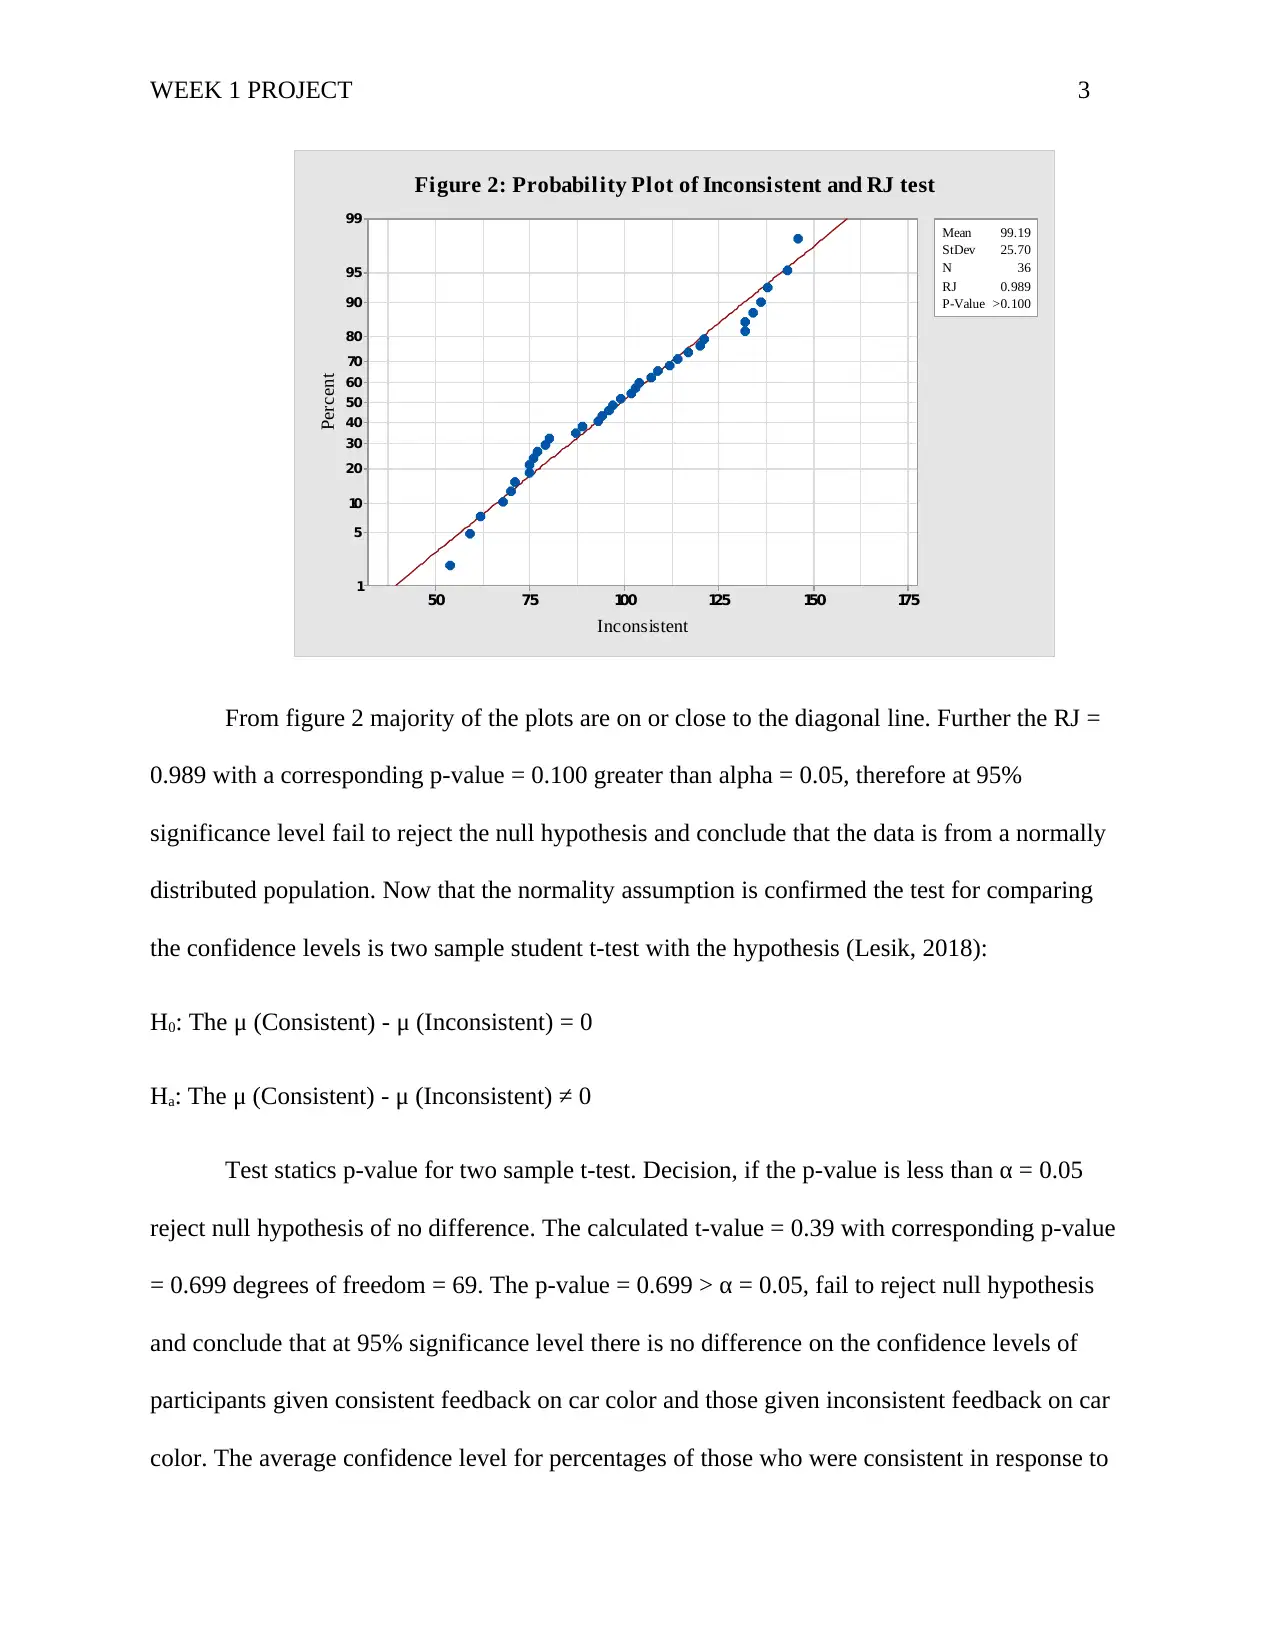
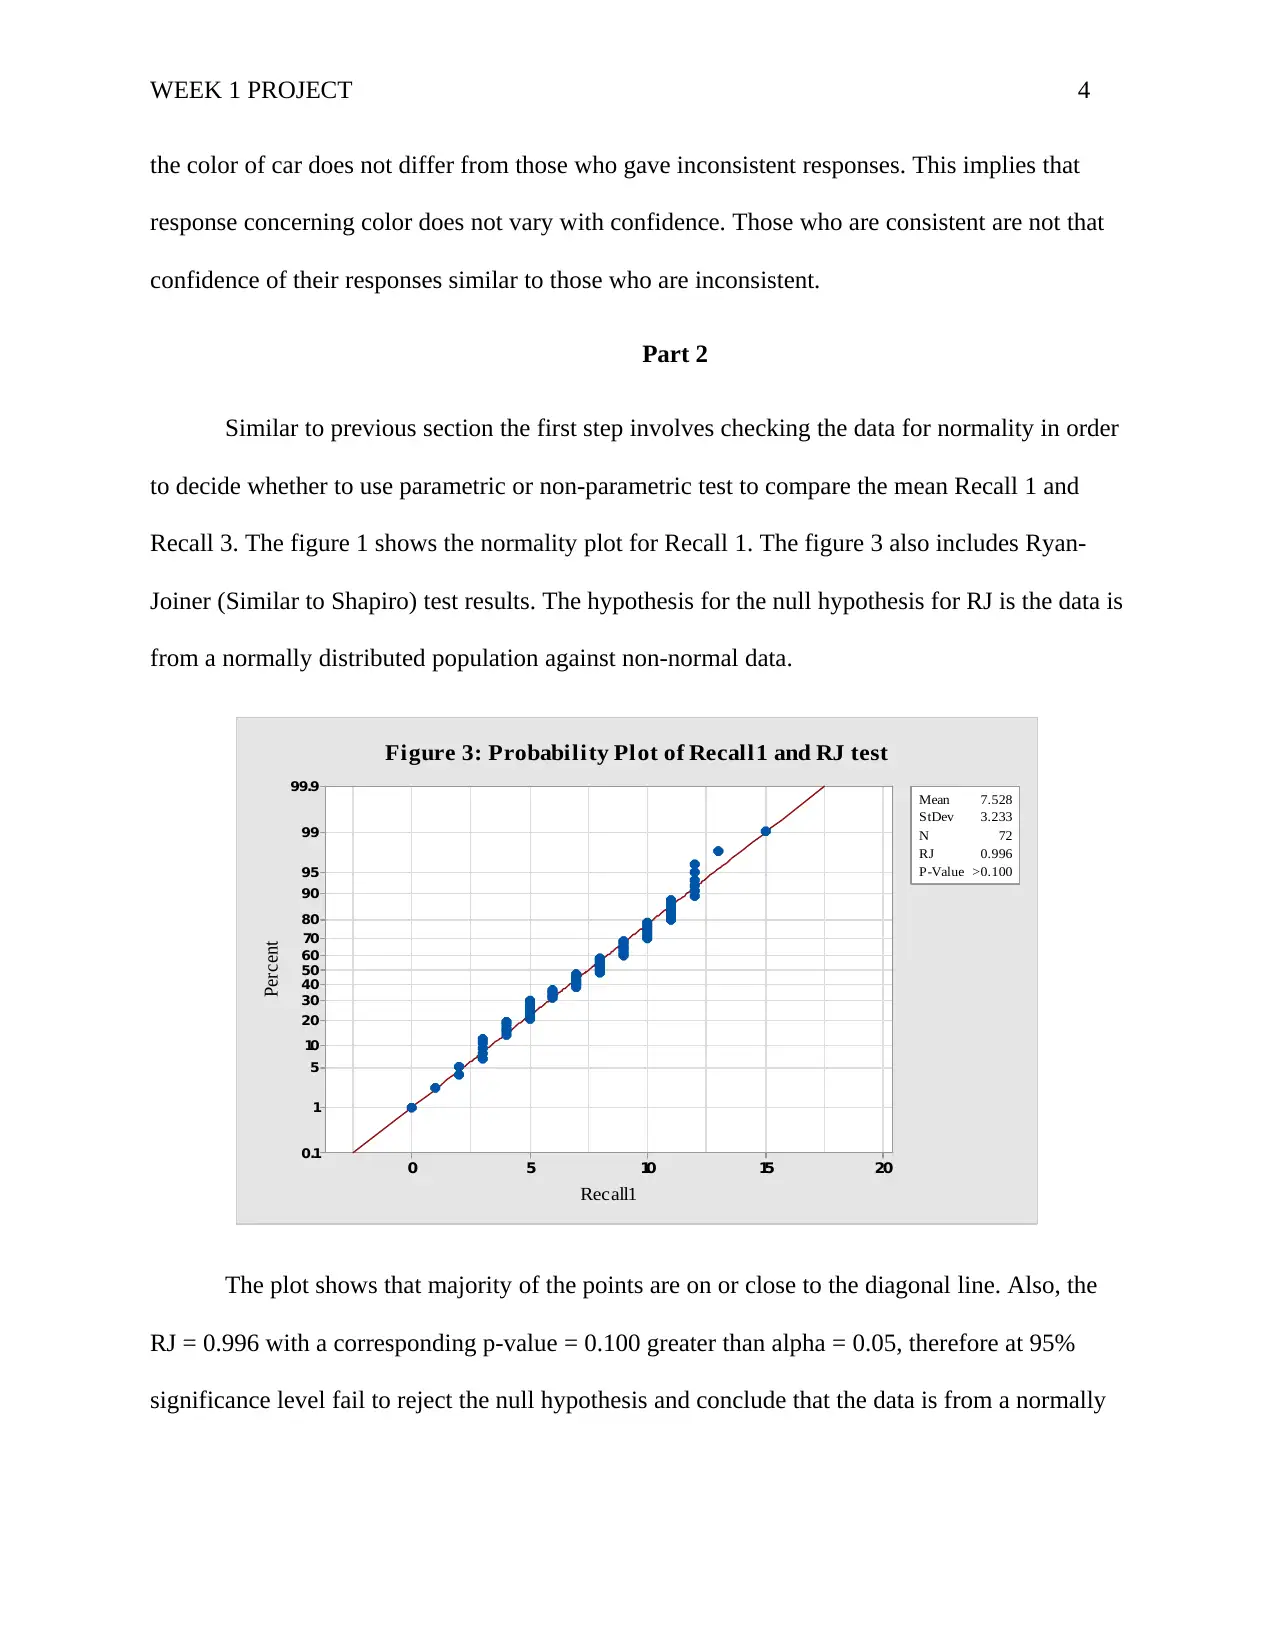
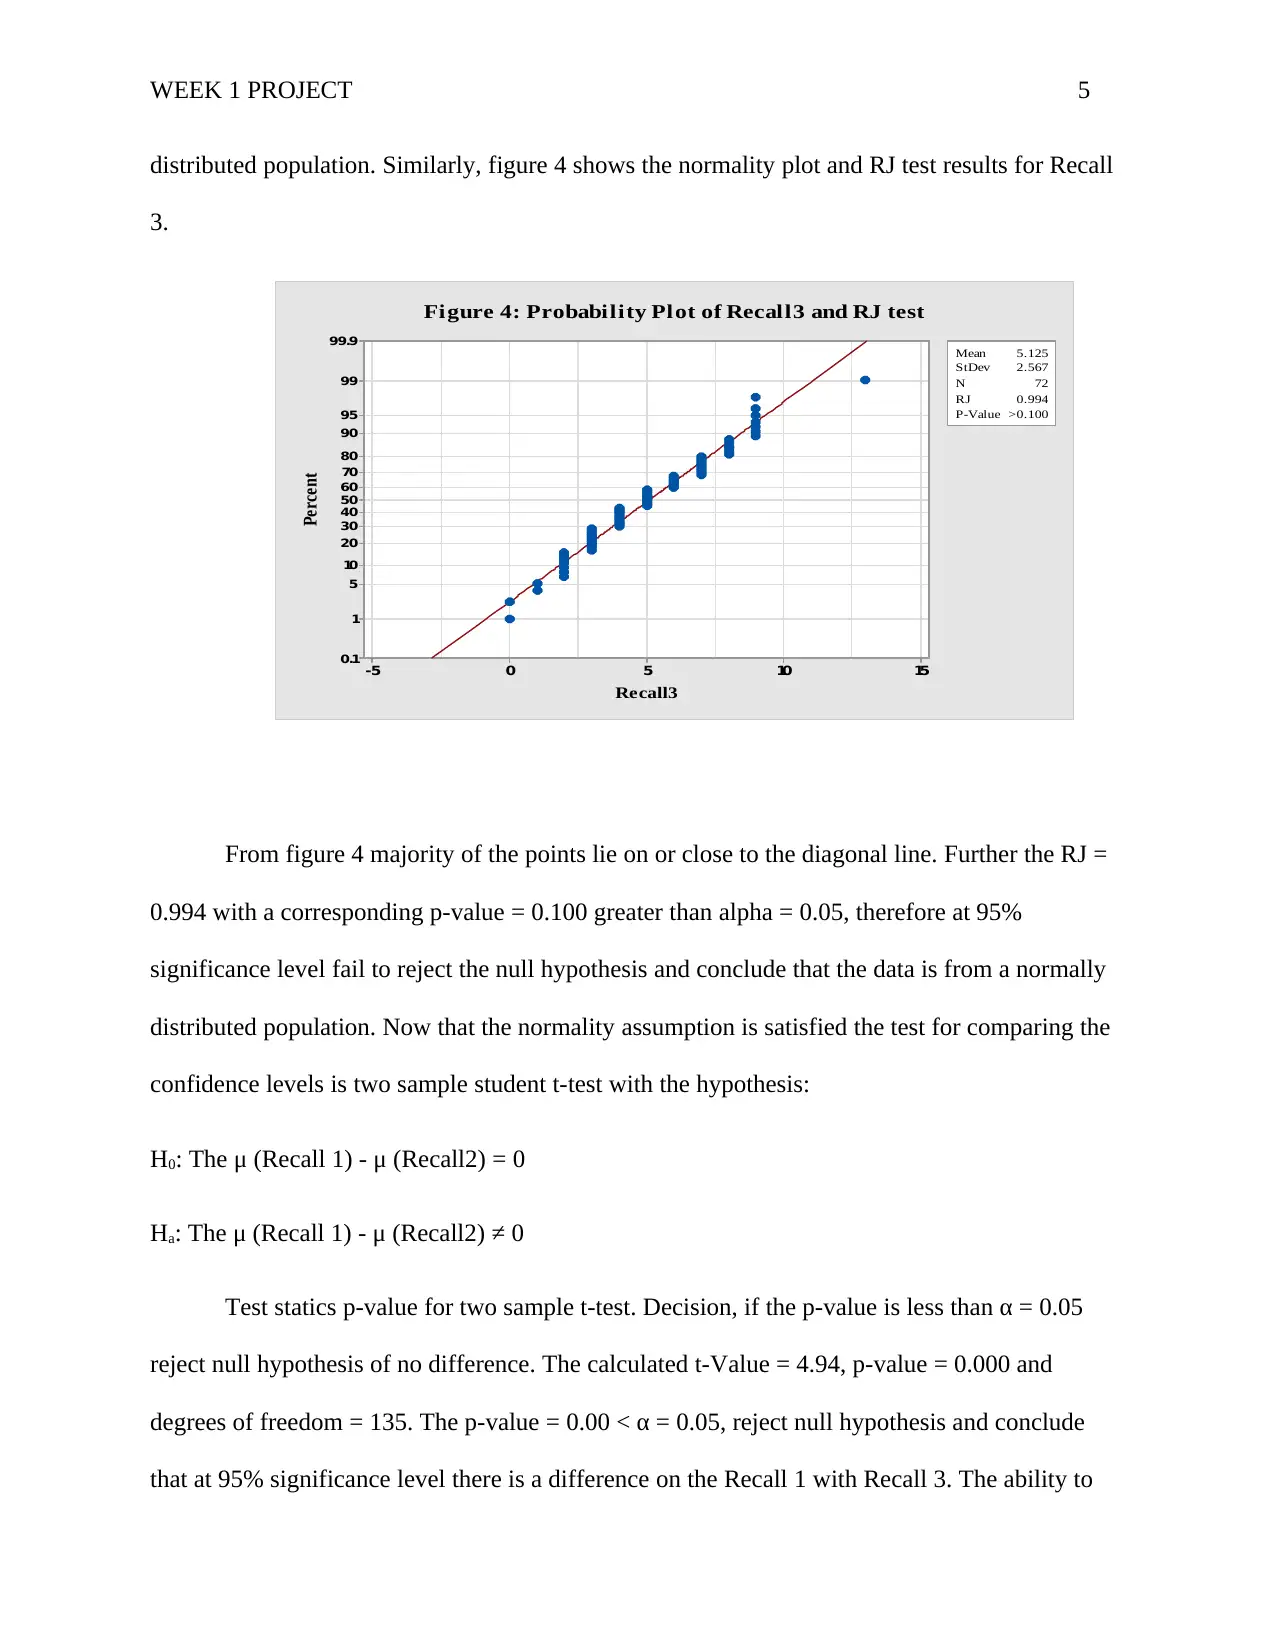
This project presents a statistical analysis of two datasets. The analysis begins by checking for data normality using probability plots and the Ryan-Joiner test. The project then employs two-sample student t-tests to compare confidence levels in the first dataset, concluding that there is no significant difference between consistent and inconsistent feedback on car color. The second part of the project similarly tests for normality and uses t-tests to compare recall abilities at different times, finding a significant difference between the first and third recalls, indicating a decrease in recall ability over time. The analysis includes statistical values such as t-values, p-values, and degrees of freedom, and interprets these values to draw conclusions about the data. The project is supported by references to relevant statistical resources.
1 out of 7
Related Documents


Your All-in-One AI-Powered Toolkit for Academic Success.
+13062052269
info@desklib.com
Available 24*7 on WhatsApp / Email
![[object Object]](/_next/static/media/star-bottom.7253800d.svg)
Copyright © 2020–2026 A2Z Services. All Rights Reserved. Developed and managed by ZUCOL.