FNSACC604A - Westfield Corporation Financial Statement Analysis
VerifiedAdded on 2023/06/10
|11
|1696
|63
Report
AI Summary
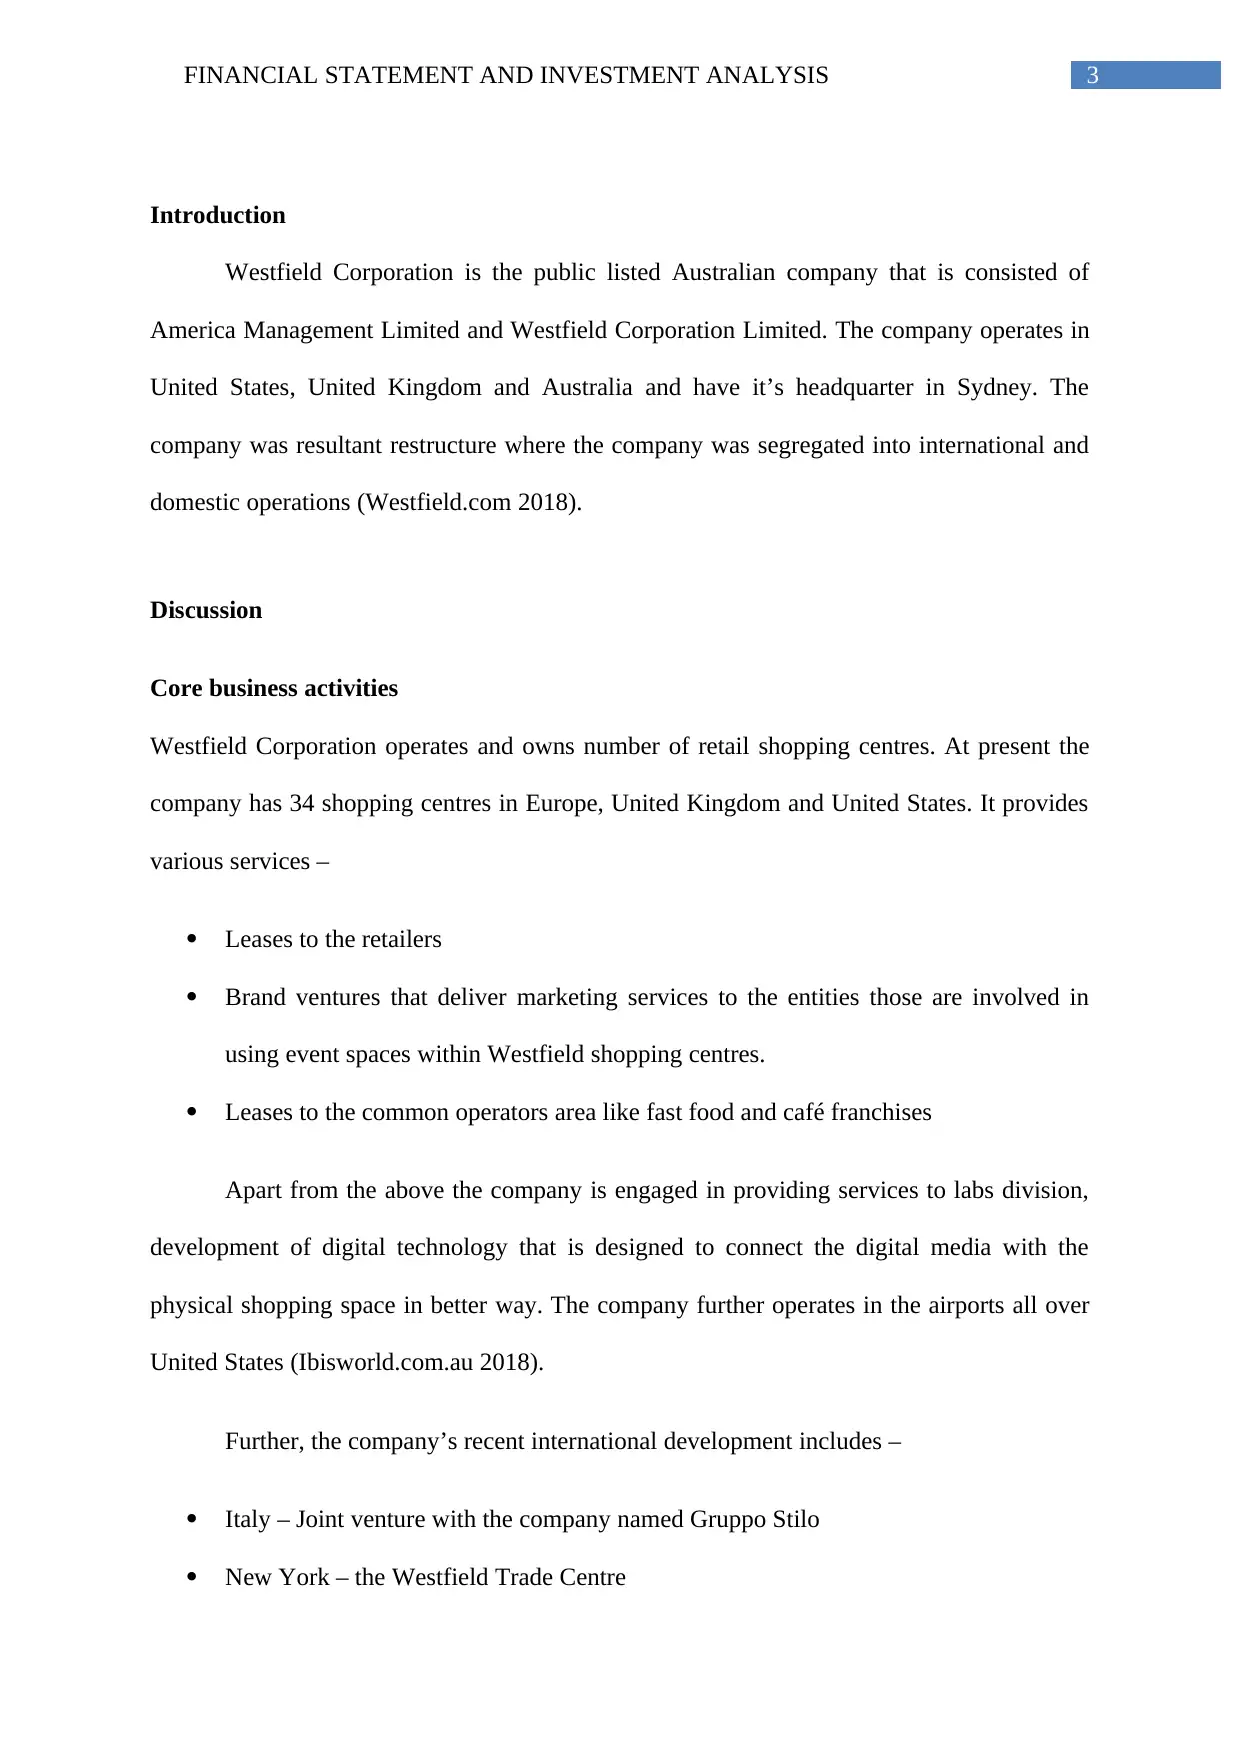
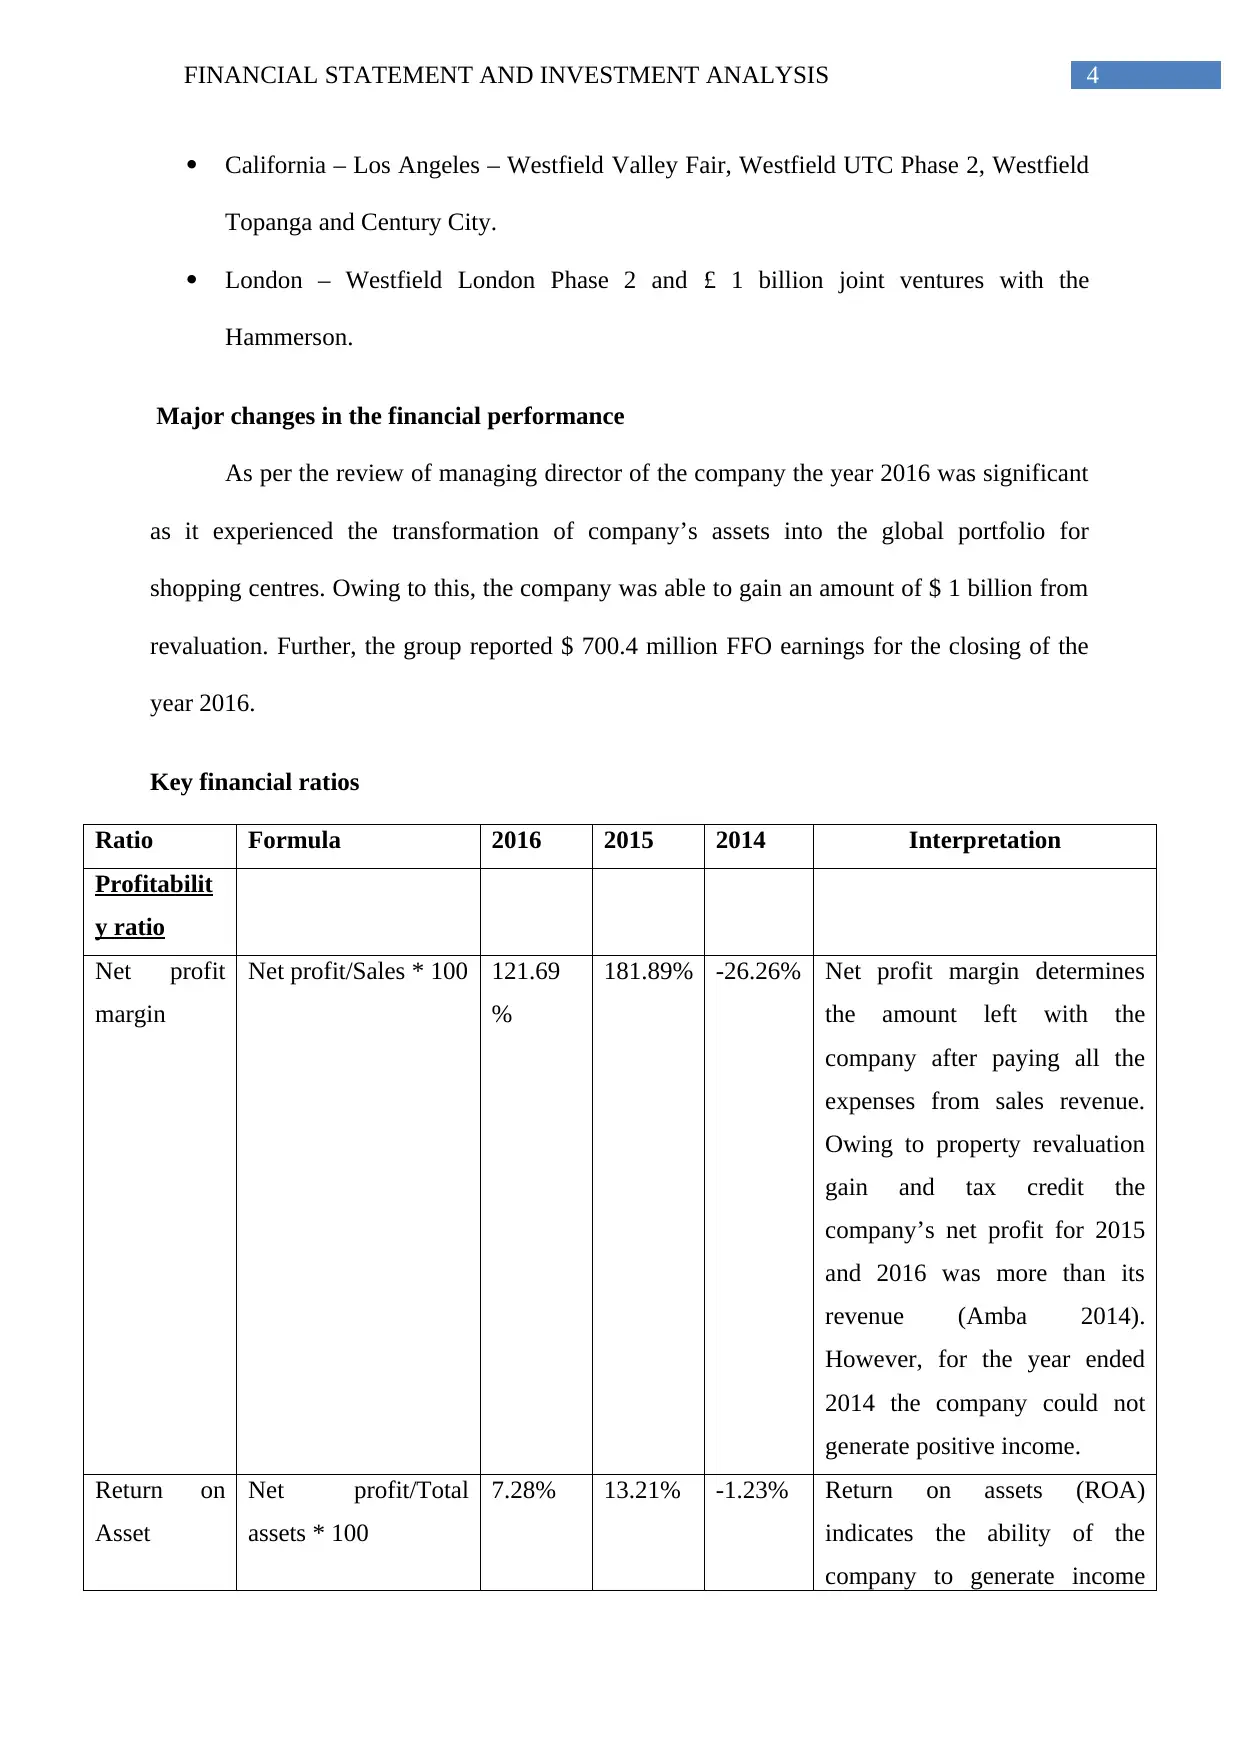
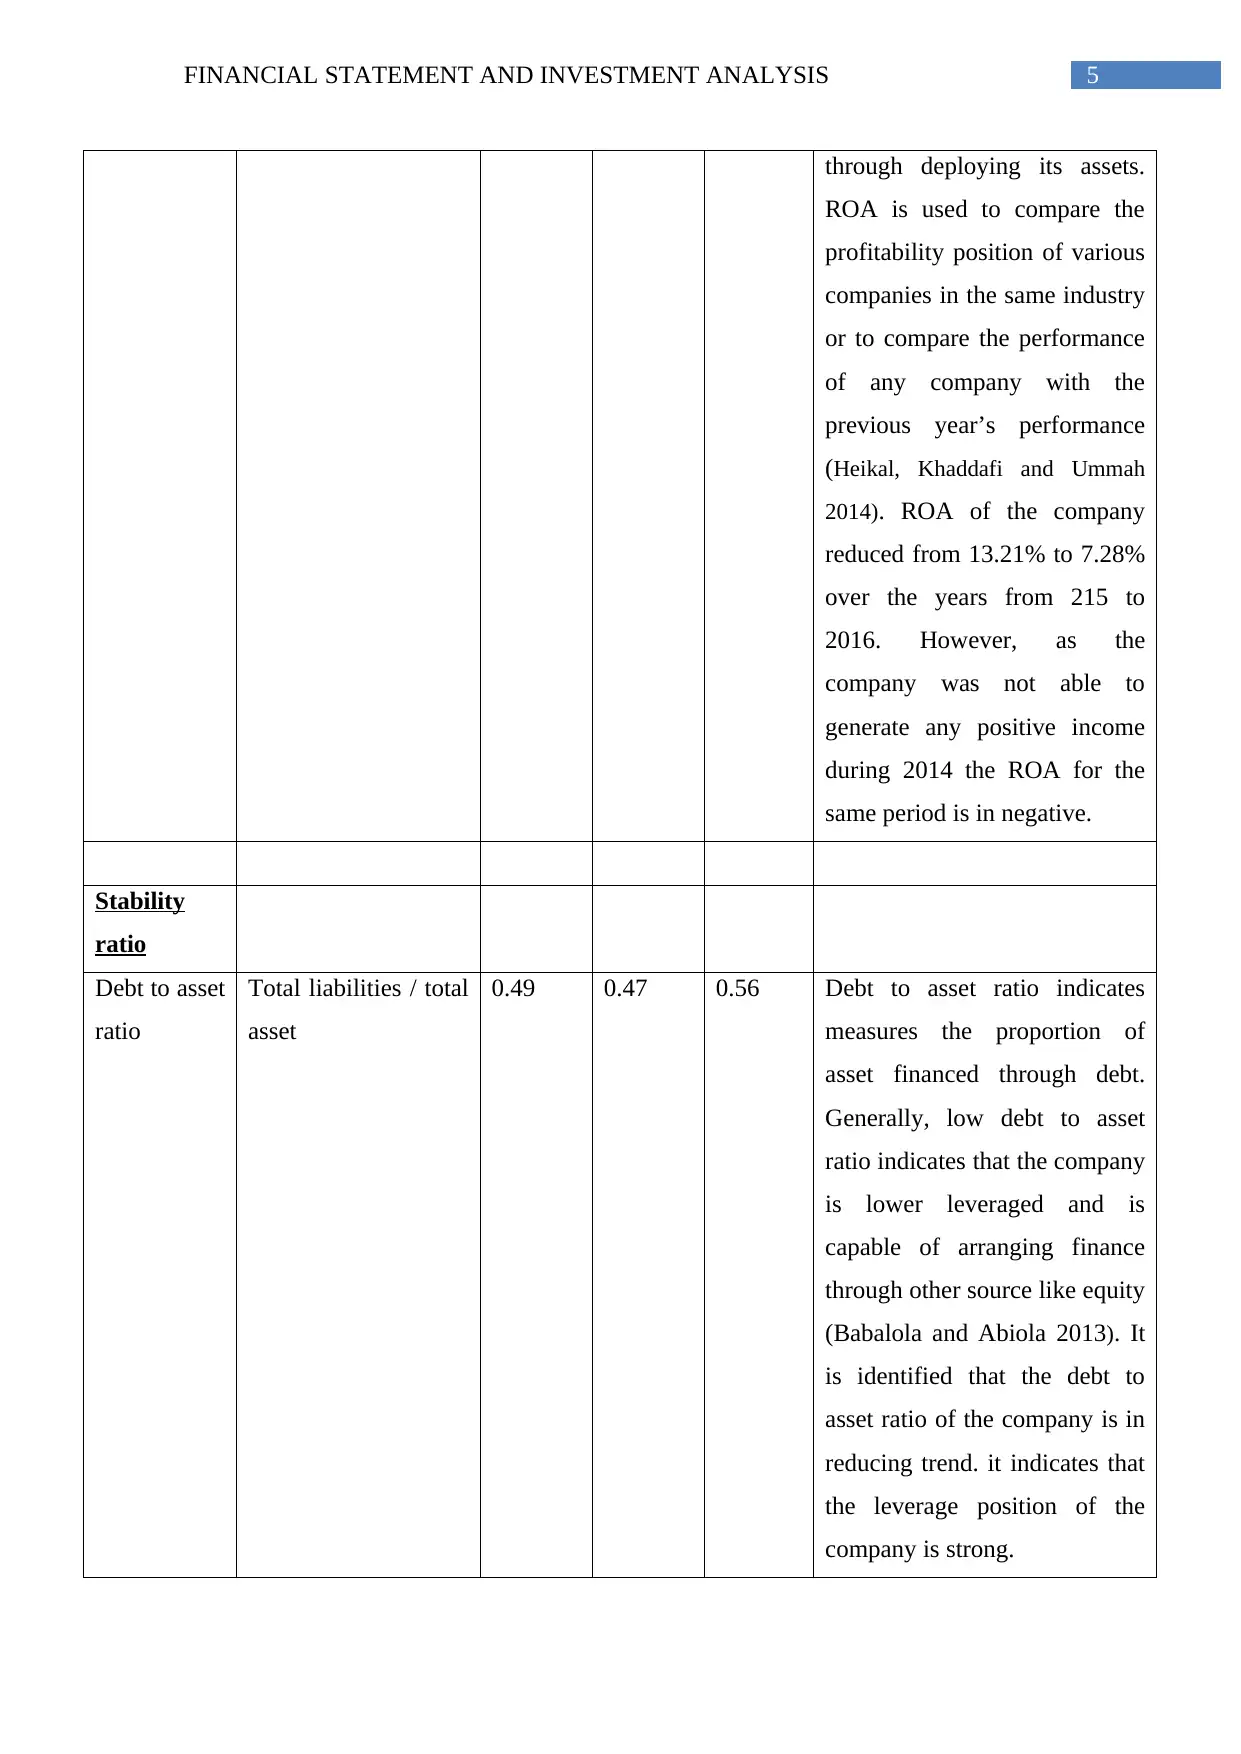
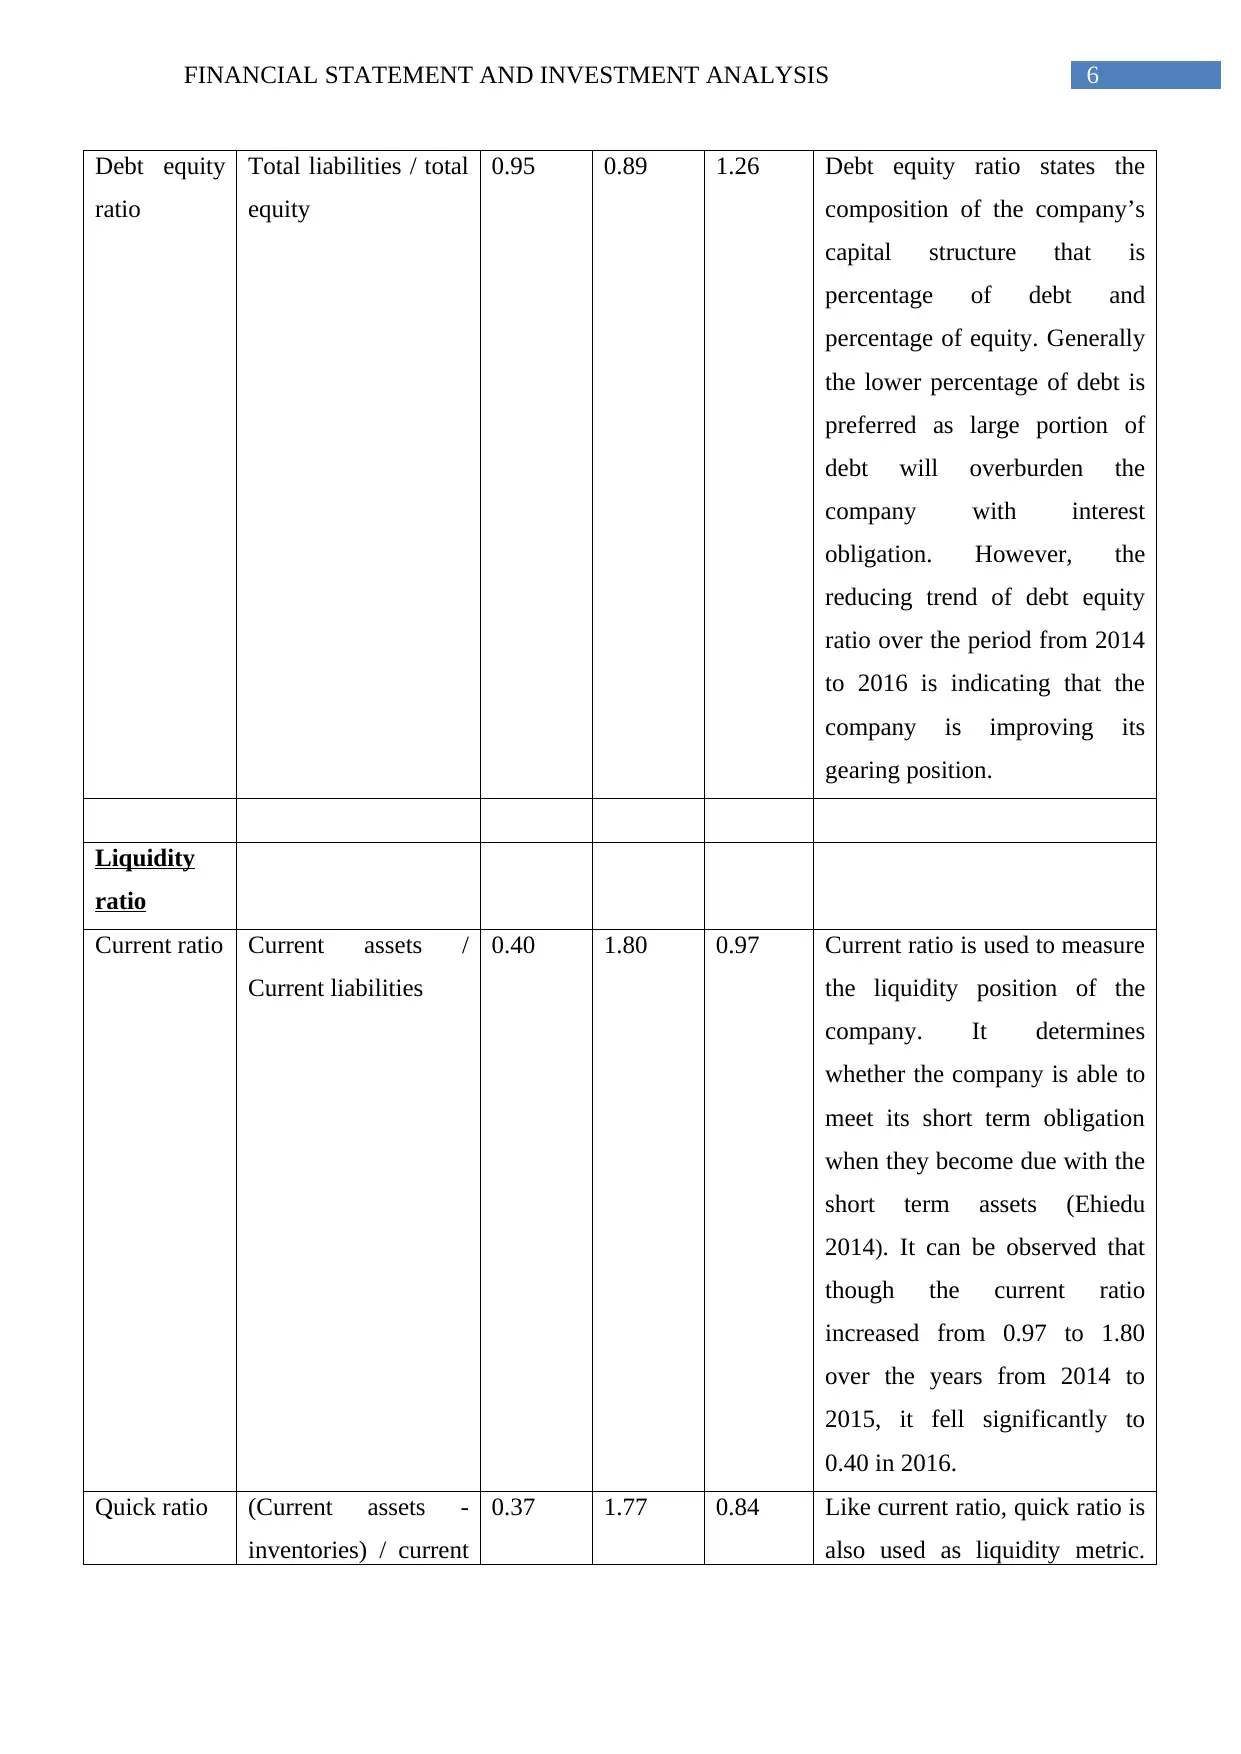
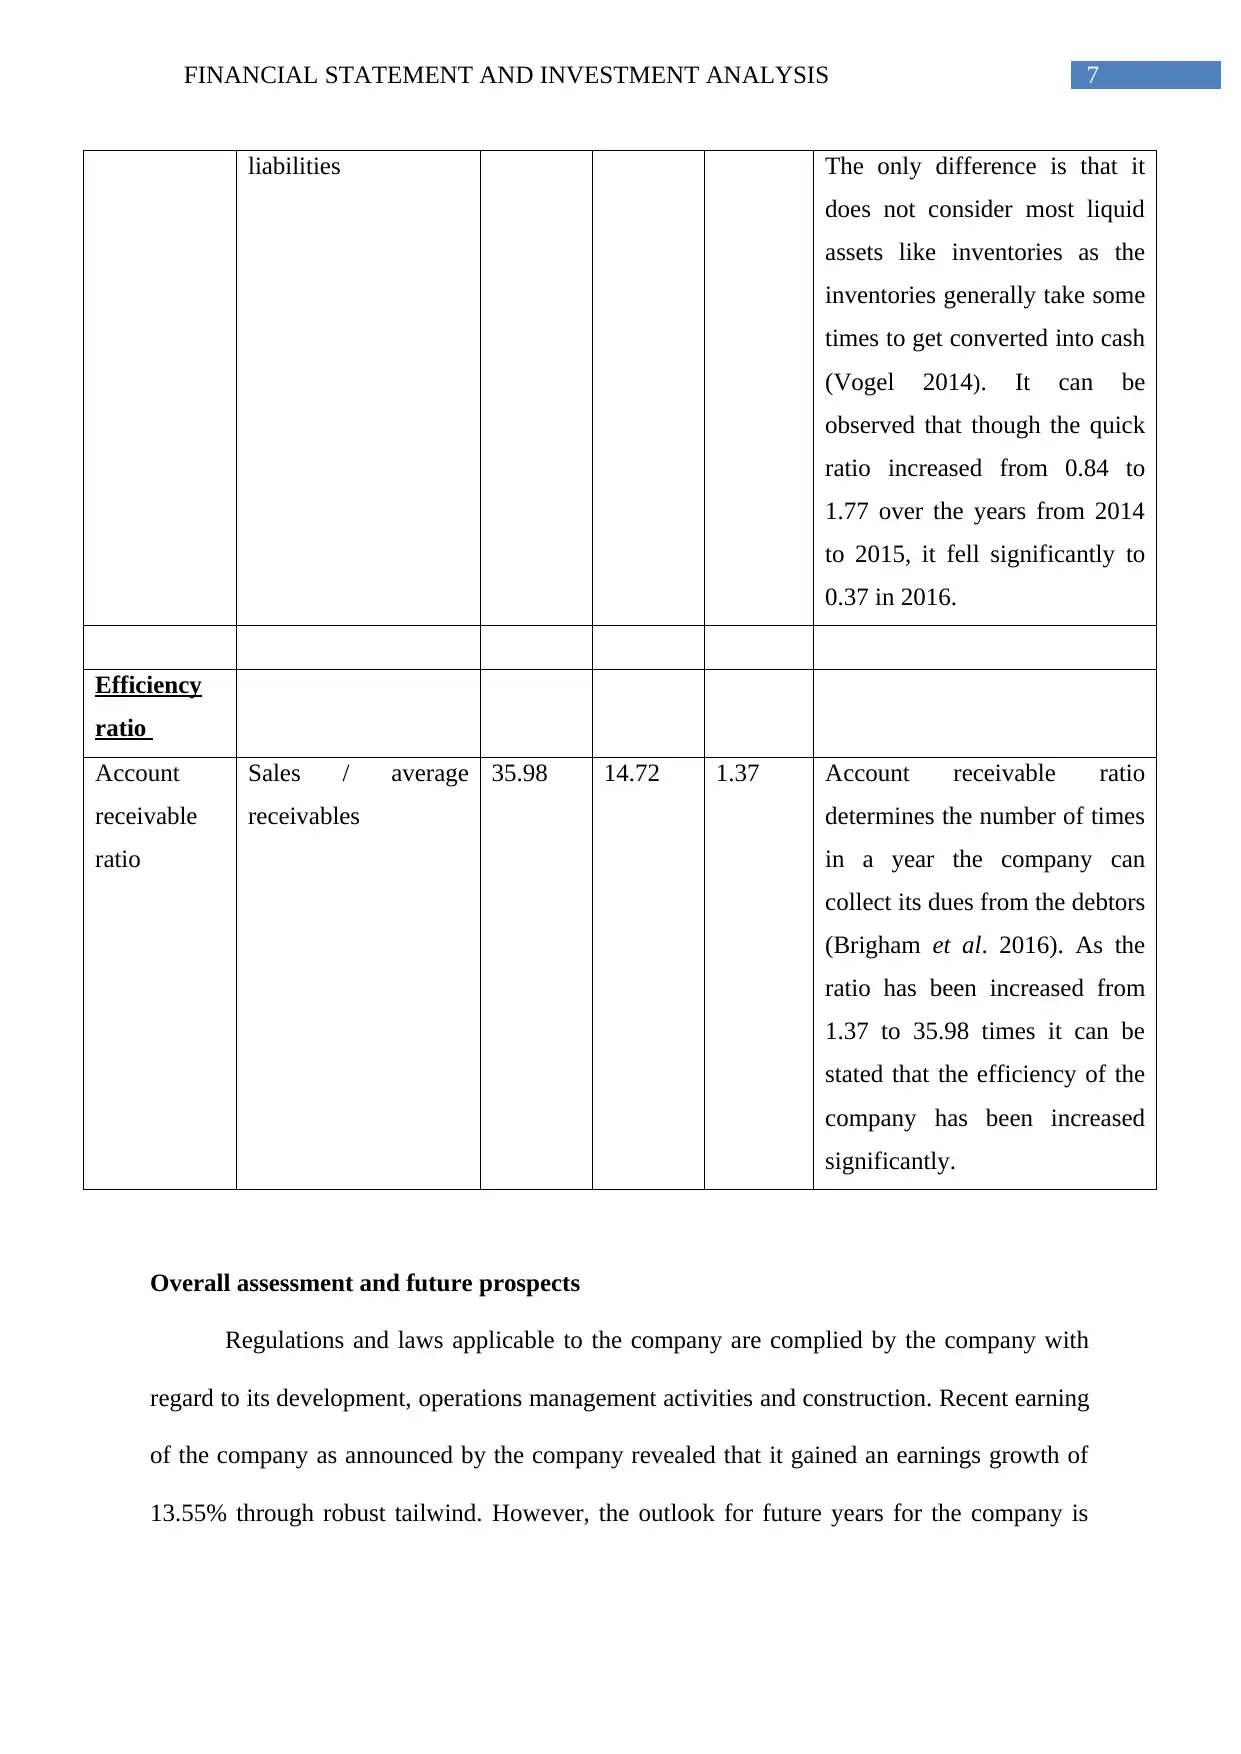
This report provides a financial statement and investment analysis of Westfield Corporation, examining its financial performance and position using annual reports and key financial ratios from 2014 to 2016. It discusses the company's core business activities, including retail shopping center operations, leases, and digital technology development. The analysis includes a review of the managing director's report, highlighting significant changes in financial performance, such as gains from property revaluation. Key financial ratios, including profitability, stability, liquidity, and efficiency ratios, are calculated and interpreted to assess the company's financial health. The report concludes with an overall assessment of Westfield Corporation's future prospects, noting a potential decline in earnings and recommending improvements in liquidity and profitability. Desklib provides access to similar solved assignments for students.

1 out of 11
Related Documents


Your All-in-One AI-Powered Toolkit for Academic Success.
+13062052269
info@desklib.com
Available 24*7 on WhatsApp / Email
![[object Object]](/_next/static/media/star-bottom.7253800d.svg)
Copyright © 2020–2026 A2Z Services. All Rights Reserved. Developed and managed by ZUCOL.