Financial Analysis of Woolworths Group Limited
VerifiedAdded on 2023/06/05
|27
|5079
|120
AI Summary
This report focuses on the financial analysis of Woolworths’ performance for the past two years. Ratio analysis, trend analysis and common size analysis has been conducted. The outcome of the analysis is that Woolworths has improved its profitability in 2017 as compare to 2016. Moreover, its efficiency and long term solvency position has also enhanced in the last year. It provides insights about the liquidity, profitability, solvency and other situations of the company which helps the group of investors to decide whether to invest in it or not.
Contribute Materials
Your contribution can guide someone’s learning journey. Share your
documents today.
RUNNING HEAD: ACCOUNTING FOR MANAGERS
Financial analysis
Financial analysis
Secure Best Marks with AI Grader
Need help grading? Try our AI Grader for instant feedback on your assignments.
Accounting for managers 2
Executive Summary
This report focuses on the financial analysis of Woolworths’ performance for the past two years.
The first part of the report gives a brief introduction about the company’s overview and the retail
industry of Australia. In the later part, ratio analysis, trend analysis and common size analysis
has been conducted. The outcome of the analysis is that Woolworths has improved its
profitability in 2017 as compare to 2016. Moreover, its efficiency and long term solvency
position has also enhanced in the last year. In the last, it is recommended to the investors that
they should make investment in Woolworths Group as the company is focused on providing high
returns and dividends to them. Moreover, its financial risk is also low.
Accounting for managers 3
Contents
Introduction......................................................................................................................................4
Company Overview.........................................................................................................................4
Analysis and discussion...................................................................................................................6
Ratio analysis...............................................................................................................................6
Common Size statements...........................................................................................................11
Trend analysis............................................................................................................................12
Conclusions and Recommendations..............................................................................................13
References......................................................................................................................................14
Appendices....................................................................................................................................16
Appendix 1.................................................................................................................................16
Appendix 2.................................................................................................................................23
Accounting for managers 4
Introduction
Financial statement analysis is a procedure of evaluating and examining the financial
performance of the company for a particular period of time. It involves critical assessment of the
financial data presented in the statements which are been prepared at the end of accounting year.
Conducting such analysis is very important for the investors and management as it helps them to
know about the overall financial position of the entity and assist the potential investors in taking
their investment decisions. There are several methods through which an analyst can analyze the
financial statements and derive the reliable outcome (Parrino, Kidwell and Bates, 2011).
This report is focused on the financial analysis of Woolworths Group Limited for the past two
years. It involves calculation of various categorized ratios and preparation of common size
statements in order to support the analysis. Furthermore, a trend analysis of the figures of
revenue and net profit after tax has also been done to make the analysis more reliable and
relevant. The scope of the report is that it covers all the quantitative data related to Woolworths
that reflected its performance and position in the past two years. It provides insights about the
liquidity, profitability, solvency and other situations of the company which helps the group of
investors to decide whether to invest in it or not. The main objective of the report is to give
recommendations to the potential investors about the financial position of Woolworths.
Company Overview
Woolworths is an Australia based company involved in the business of retailing. It is the second
largest retailer of the country after Wesfarmers. Apart from Australia, the company also has its
operations in New Zealand. It was founded in 1924 as the largest supermarket chain in the
Secure Best Marks with AI Grader
Need help grading? Try our AI Grader for instant feedback on your assignments.
Accounting for managers 5
country functioning through segments like BIG W, Endeavour Drinks and others. Woolworths is
also considered as the largest take away retailer of liquor in Australia. It solely covers 39% of the
Australian grocery market having prime focus on trading of food and liquor. Other business
activities of the company involve providing various hospitality services under the name
Australian Leisure and Hospitality Group. It is listed on ASX with a ticker ASX: WOW
(Bloomberg. 2018).
The contribution done by Woolworths in the retail industry of Australia reflects that the
corporation has achieved a significant and dominant position in Australian retail industry. The
main reason behind this achievement is the core business strategies formulated and followed by
the company. It strategies of expanding and growing its operations according to the plans,
prioritizing the strategies in context of extending leadership in all market segments, maximizing
the shareholders’ value and focusing on the overall growth of business has lead the company to
become the second largest retailer of the country. Moreover, the bargaining power of consumers
and suppliers is also significantly higher because of the huge number of supermarkets operating
in the country (Woolworths. 2017). However, the retail industry was affected by the economic
market conditions as decline in the same has affected the performance of the company. Also, it
has made a loss of $1235 million in 2016 due to the failure of its Masters Business and Big W
business. As far as environmental factors are considered, the company’s petrol and wine making
business are leaving an adverse impact on the environment which in a way affected its
profitability to a great extent.
According to Woolworth’s chairman words, the company was focused on modifying its
strategies in 2017. It exited the Masters Business and reset the strategy for BIG W. Though the
company has made progress but has faced threats from traditional competitors and discounters.
Accounting for managers 6
In addition, Woolworths has also brought culture in its working and was focused on improving
the health and care of its employees and other individuals working in the organization. In 2017, it
has also laid more emphasis on managing its capital appropriately and has declared a dividend of
84 cents during the year, reflecting an increase of 9.1% in the same. Overall, the performance
and position of the company has increased in 2017 as compare to 2016 (Woolworths. 2017).
Analysis and discussion
Ratio analysis
Profitability ratios
Net profit ratio: It measures the amount of net income or profit earned by the company
out of its total revenue. The figure is expressed in term percentage of total sales. A high
NPR is favourable as it indicates high profitability of the entity (Bragg, 2012).
In case of Woolworths, the NPR was -2.12% in 2016 which increased to 2.76% in 2017. This
was due to the loss made by the firm in 2016 which turned out to be a profit worth $1534 million
in 2017. The strong generation of cash and profit derived from Home Improvement result in the
increased profitability of the company. However, it was still below the industry average of
4.10% (Woolworths. 2017).
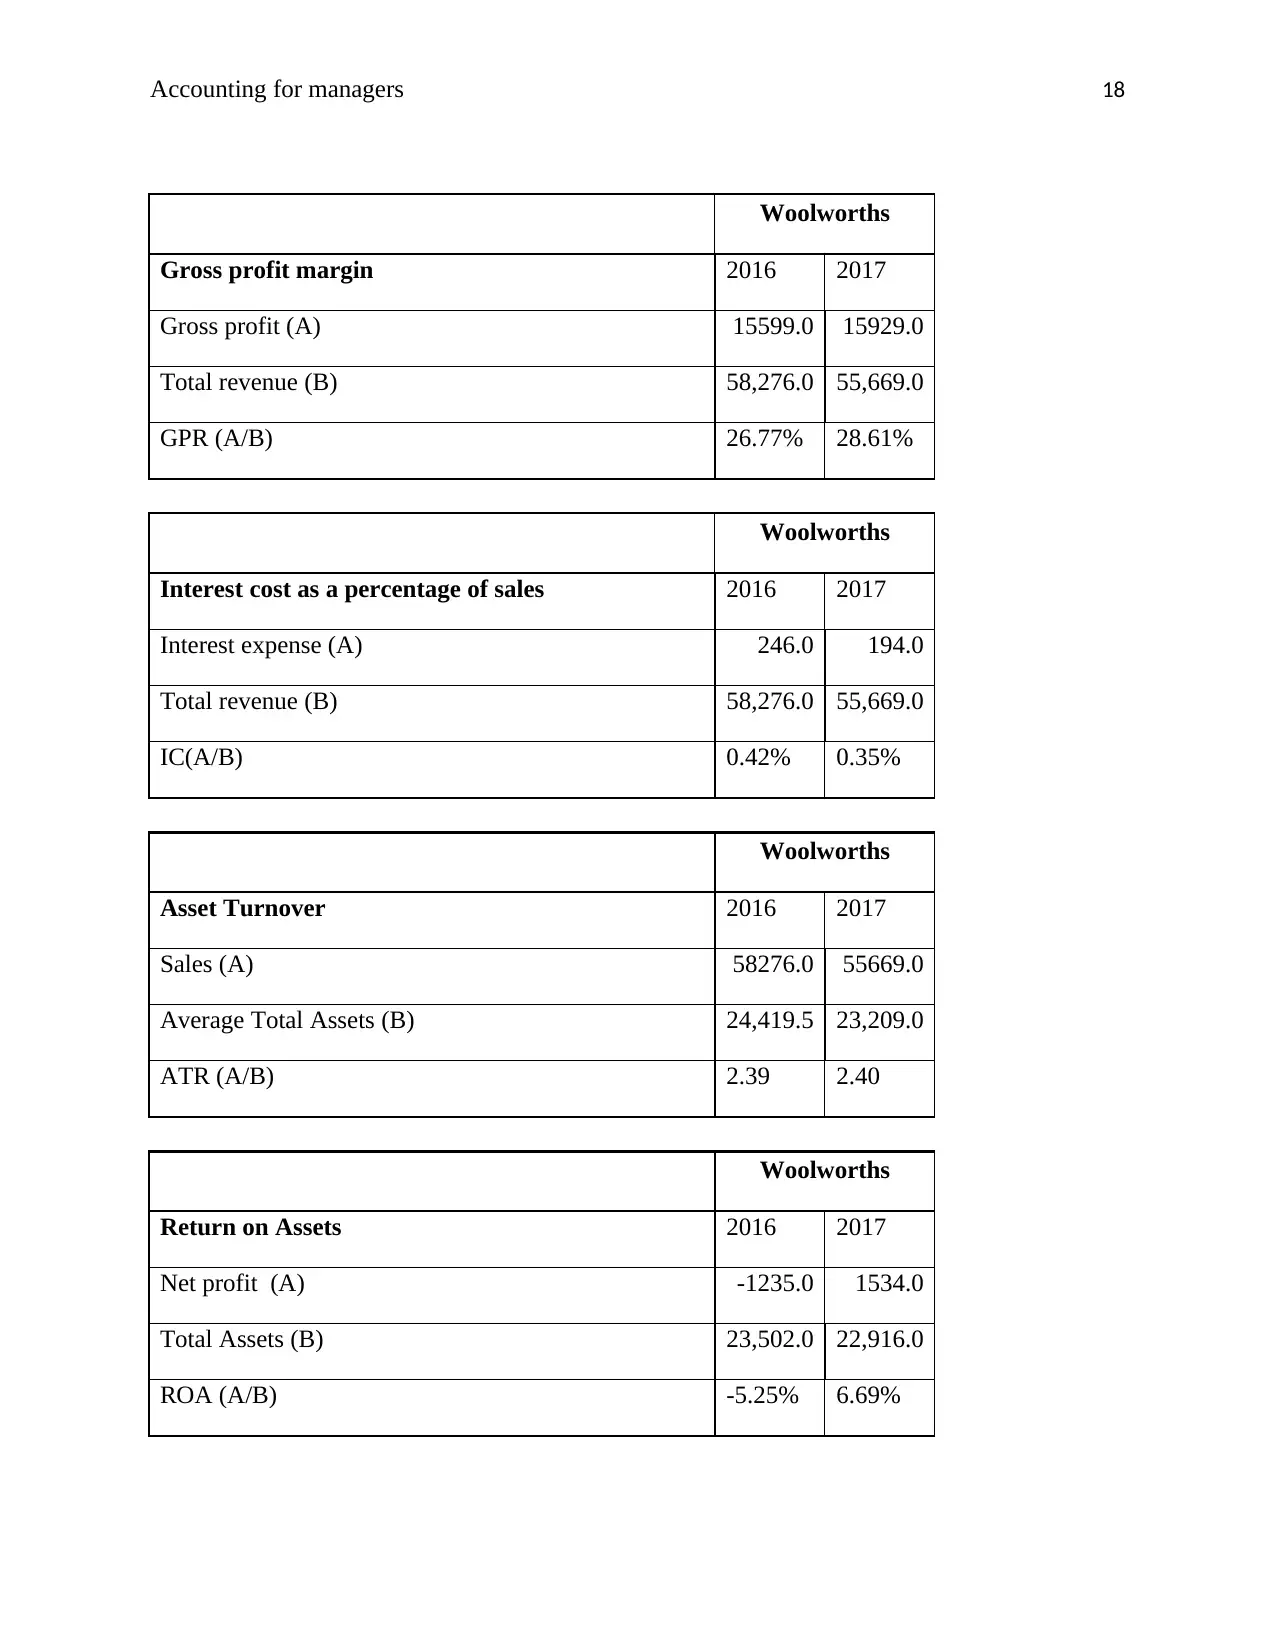
Gross profit ratio: It evaluates the amount of profit made by the entity after paying its
cost of sales from its total revenue. It is also expressed as a percentage of revenue (Bragg,
2012).
Same trend has been noticed in the GPR of Woolworths as it rose from 26.77% to 28.61% in
2017 but it was lower than the standard ratio of 35.09%. This was because of the significant
In addition, Woolworths has also brought culture in its working and was focused on improving
the health and care of its employees and other individuals working in the organization. In 2017, it
has also laid more emphasis on managing its capital appropriately and has declared a dividend of
84 cents during the year, reflecting an increase of 9.1% in the same. Overall, the performance
and position of the company has increased in 2017 as compare to 2016 (Woolworths. 2017).
Analysis and discussion
Ratio analysis
Profitability ratios
Net profit ratio: It measures the amount of net income or profit earned by the company
out of its total revenue. The figure is expressed in term percentage of total sales. A high
NPR is favourable as it indicates high profitability of the entity (Bragg, 2012).
In case of Woolworths, the NPR was -2.12% in 2016 which increased to 2.76% in 2017. This
was due to the loss made by the firm in 2016 which turned out to be a profit worth $1534 million
in 2017. The strong generation of cash and profit derived from Home Improvement result in the
increased profitability of the company. However, it was still below the industry average of
4.10% (Woolworths. 2017).
Gross profit ratio: It evaluates the amount of profit made by the entity after paying its
cost of sales from its total revenue. It is also expressed as a percentage of revenue (Bragg,
2012).
Same trend has been noticed in the GPR of Woolworths as it rose from 26.77% to 28.61% in
2017 but it was lower than the standard ratio of 35.09%. This was because of the significant
Accounting for managers 7
reduction in firm’s cost of goods sold from $42677 million to $39740 million. This has boosted
up the ratio last year.
Asset turnover: It shows the sales generated by the company with the efficient utilization
of its average total assets (Gibson, 2011).
Woolworths’ ATR increased from 2.39 to 2.40 in the past year and was also more than the
industry average of 1.10. This increase was due to the overall decrease in its average total assets
in 2017. The sale of inventories and PPE has generated revenue for the company and boosted up
the ratio.
Return on Assets: It indicates the amount of profit made by the firm by employing its
assets and other resources in the business (Godwin and Alderman, 2012).
The ROA of Woolworths was -5.25% in 2016 which turned to 6.69% in 2017. The reason was
the increased profits and decreased total assets of the company. Also it was more than the
average of 3.67% reflecting that the profitability of the firm has improved last year (Appendix
1).
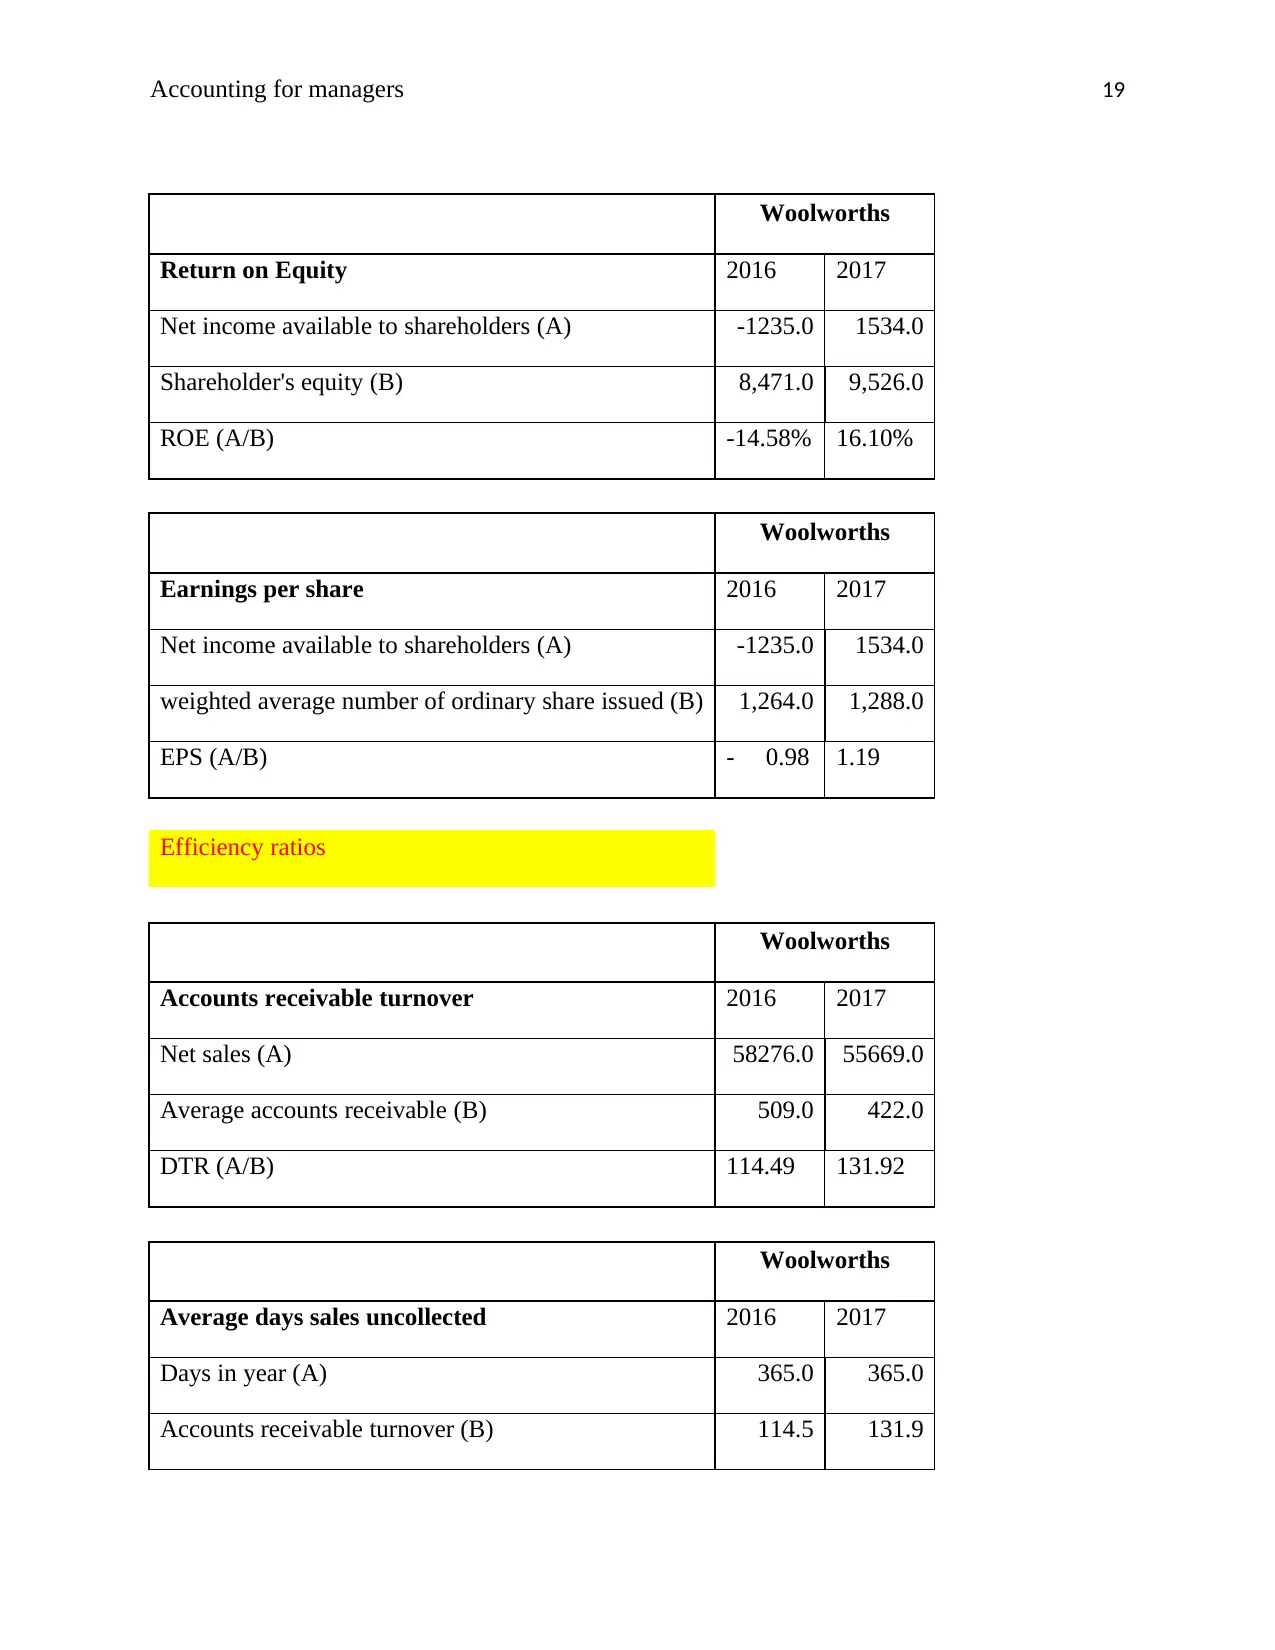
Return on equity: It identifies the capability of the company in paying returns to its
shareholders on the capital invested by them in the business. Generally, entities having
high ROE are more profitable and attractive to the investors (Higgins, 2012).
The same trend has been shown in the ROE of Woolworths as it rose from -14.58% to 16.10% in
2017. Further, it was higher than the industry standard of 9.77%. In 2016, the company made
loss due to the failure of its Masters Business and BIG W but the trend got reversed last year and
Woolworth quitted its Masters Business. Moreover, it changed the strategy for BIG W in order to
reduction in firm’s cost of goods sold from $42677 million to $39740 million. This has boosted
up the ratio last year.
Asset turnover: It shows the sales generated by the company with the efficient utilization
of its average total assets (Gibson, 2011).
Woolworths’ ATR increased from 2.39 to 2.40 in the past year and was also more than the
industry average of 1.10. This increase was due to the overall decrease in its average total assets
in 2017. The sale of inventories and PPE has generated revenue for the company and boosted up
the ratio.
Return on Assets: It indicates the amount of profit made by the firm by employing its
assets and other resources in the business (Godwin and Alderman, 2012).
The ROA of Woolworths was -5.25% in 2016 which turned to 6.69% in 2017. The reason was
the increased profits and decreased total assets of the company. Also it was more than the
average of 3.67% reflecting that the profitability of the firm has improved last year (Appendix
1).
Return on equity: It identifies the capability of the company in paying returns to its
shareholders on the capital invested by them in the business. Generally, entities having
high ROE are more profitable and attractive to the investors (Higgins, 2012).
The same trend has been shown in the ROE of Woolworths as it rose from -14.58% to 16.10% in
2017. Further, it was higher than the industry standard of 9.77%. In 2016, the company made
loss due to the failure of its Masters Business and BIG W but the trend got reversed last year and
Woolworth quitted its Masters Business. Moreover, it changed the strategy for BIG W in order to
Paraphrase This Document
Need a fresh take? Get an instant paraphrase of this document with our AI Paraphraser
Accounting for managers 8
book high profits. As a result, profit was generated and the ratio turns high and positive
(Woolworths. 2017).
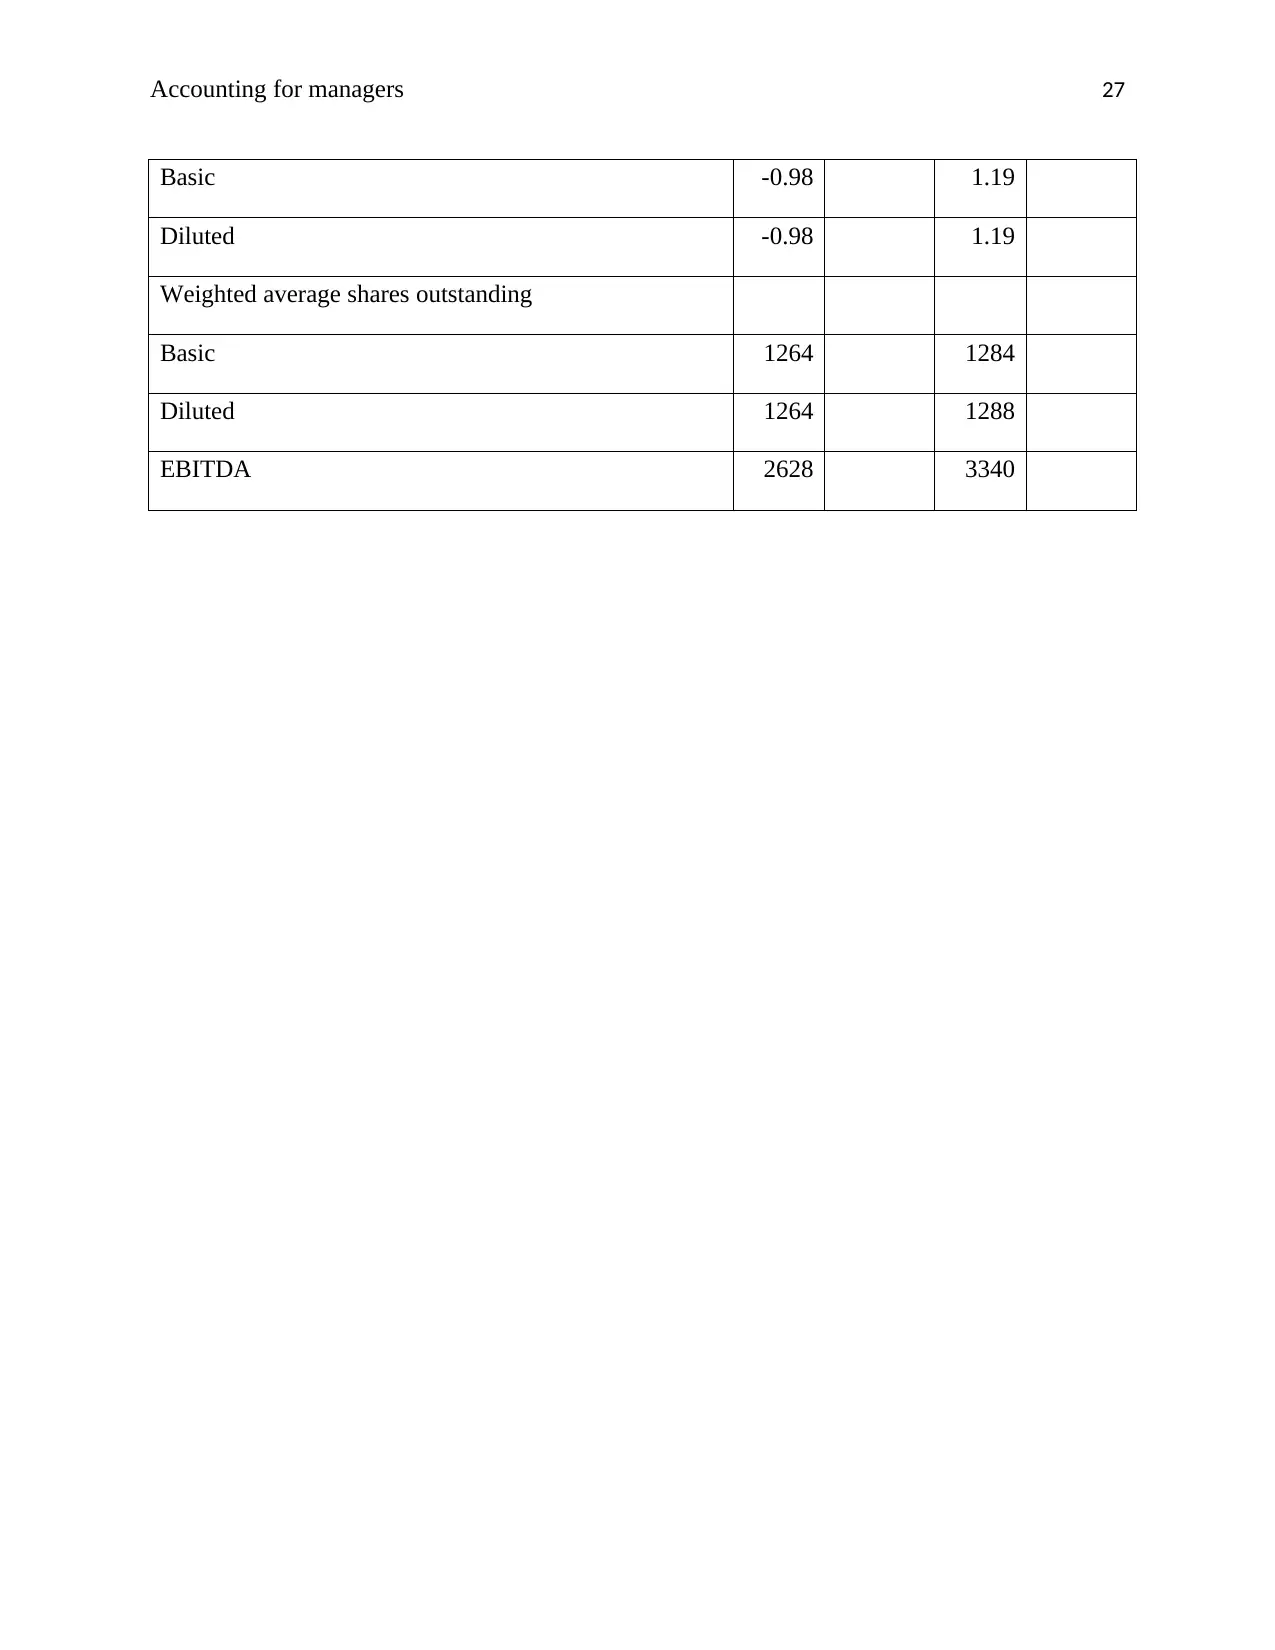
Earnings per share: It is another financial metrics which is also an indicator of
organization’s profitability. It shows the portion of profit allocated to each outstanding
share of the company.
Woolworths’ EPS also increased from -0.98 to 1.19 as the firm earned profits in 2017. A high
EPS reflected that WOW was capable of declaring significant amount of dividends to its
investors. It also indicated improved profitability position of the company.
Apart from the above discussed ratios, Woolworths interest expense reduced from 0.42% to
0.35% and its Net margin before after-tax cost of interest rose from -1.82% to 3%. This means
the finance cost has been reduced last year.
Efficiency ratios
Debtor turnover ratio: It is an activity ratio which measures how efficiently a firm uses its
assets to make turnover (Jenter and Lewellen, 2015).
The ATR of Woolworths was 114.49 times and 131.92 times in 2016 and 2017 respectively. It is
way more than the average of 68.71 times. The reason for the upsurge in the ratio was the
reduction in company’s accounts receivable from $434 million to $410 million in 2017. An
increased ratio indicates that the firm collects its receivables on time and also the average time
taken was 3 days in the past two years. This means WOW is efficient enough in managing its
receivables (Appendix 1).
book high profits. As a result, profit was generated and the ratio turns high and positive
(Woolworths. 2017).
Earnings per share: It is another financial metrics which is also an indicator of
organization’s profitability. It shows the portion of profit allocated to each outstanding
share of the company.
Woolworths’ EPS also increased from -0.98 to 1.19 as the firm earned profits in 2017. A high
EPS reflected that WOW was capable of declaring significant amount of dividends to its
investors. It also indicated improved profitability position of the company.
Apart from the above discussed ratios, Woolworths interest expense reduced from 0.42% to
0.35% and its Net margin before after-tax cost of interest rose from -1.82% to 3%. This means
the finance cost has been reduced last year.
Efficiency ratios
Debtor turnover ratio: It is an activity ratio which measures how efficiently a firm uses its
assets to make turnover (Jenter and Lewellen, 2015).
The ATR of Woolworths was 114.49 times and 131.92 times in 2016 and 2017 respectively. It is
way more than the average of 68.71 times. The reason for the upsurge in the ratio was the
reduction in company’s accounts receivable from $434 million to $410 million in 2017. An
increased ratio indicates that the firm collects its receivables on time and also the average time
taken was 3 days in the past two years. This means WOW is efficient enough in managing its
receivables (Appendix 1).
Accounting for managers 9
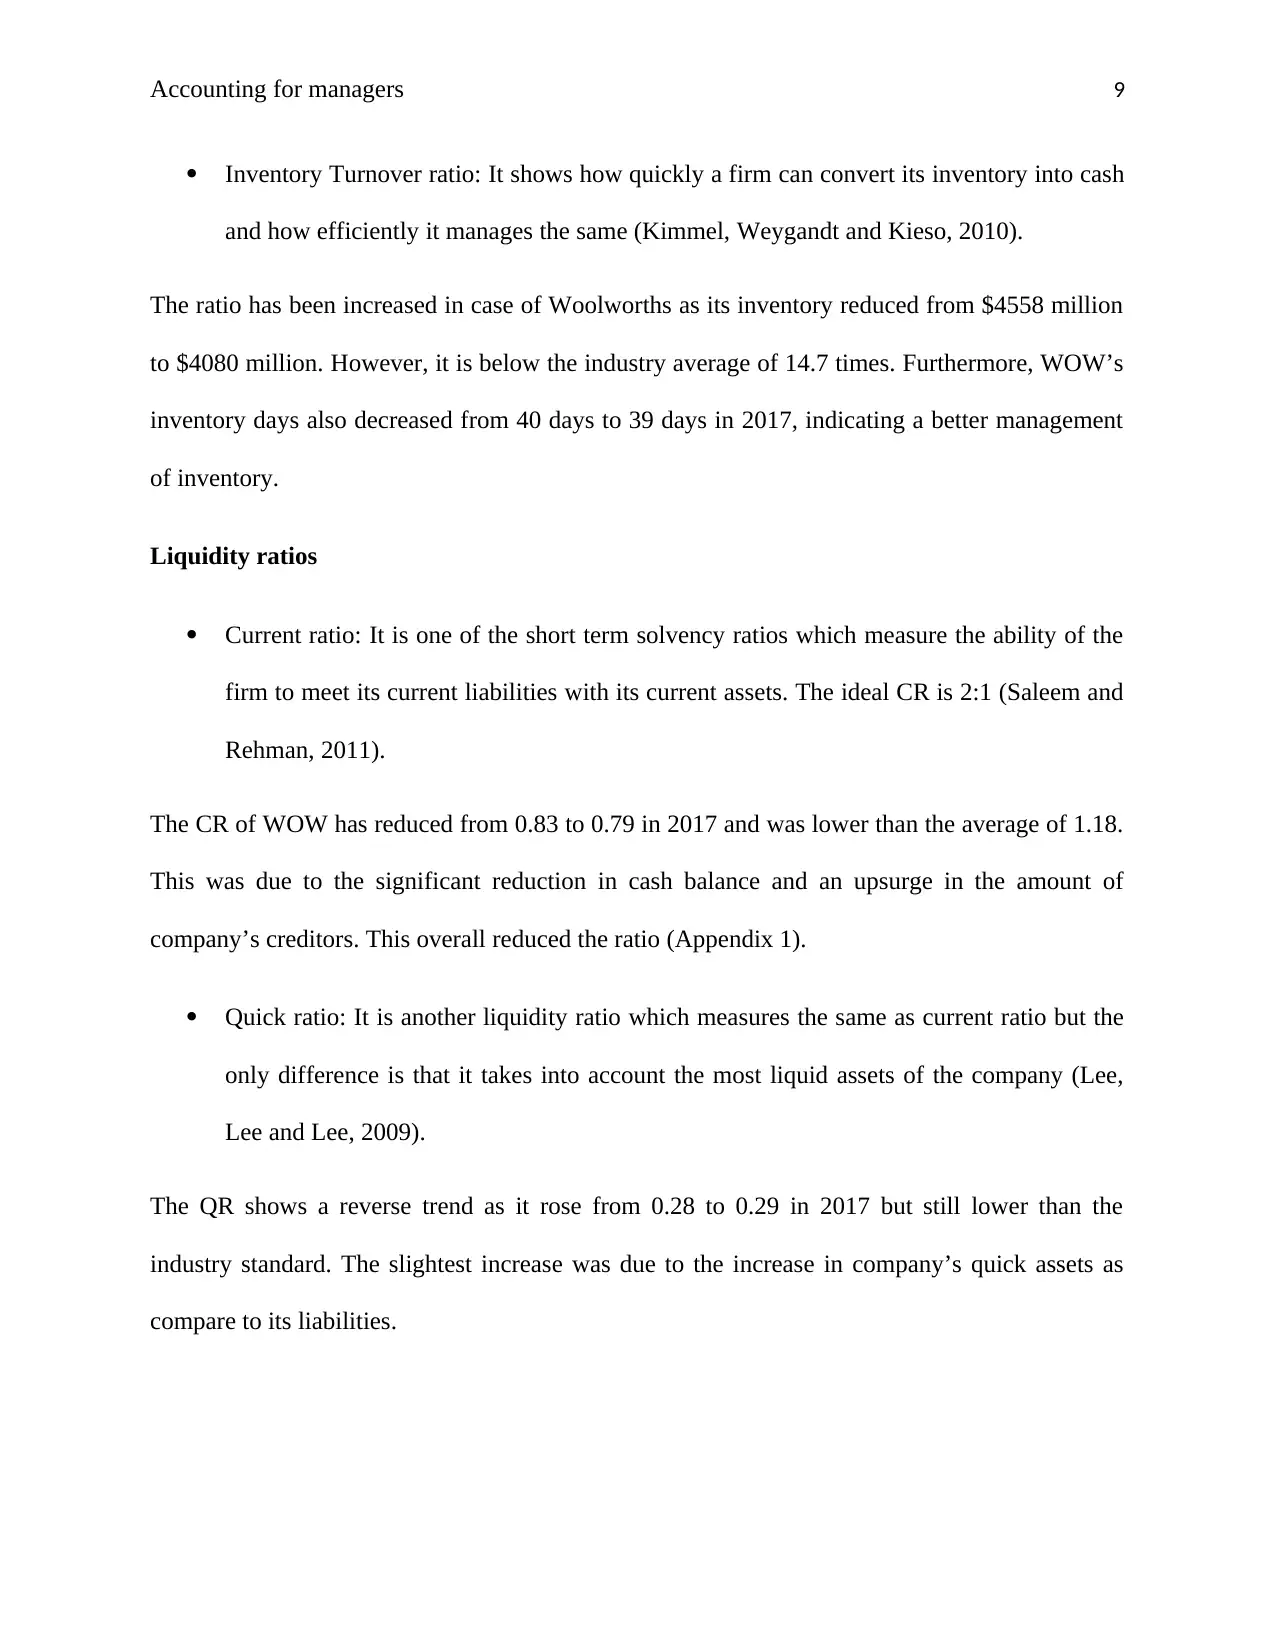
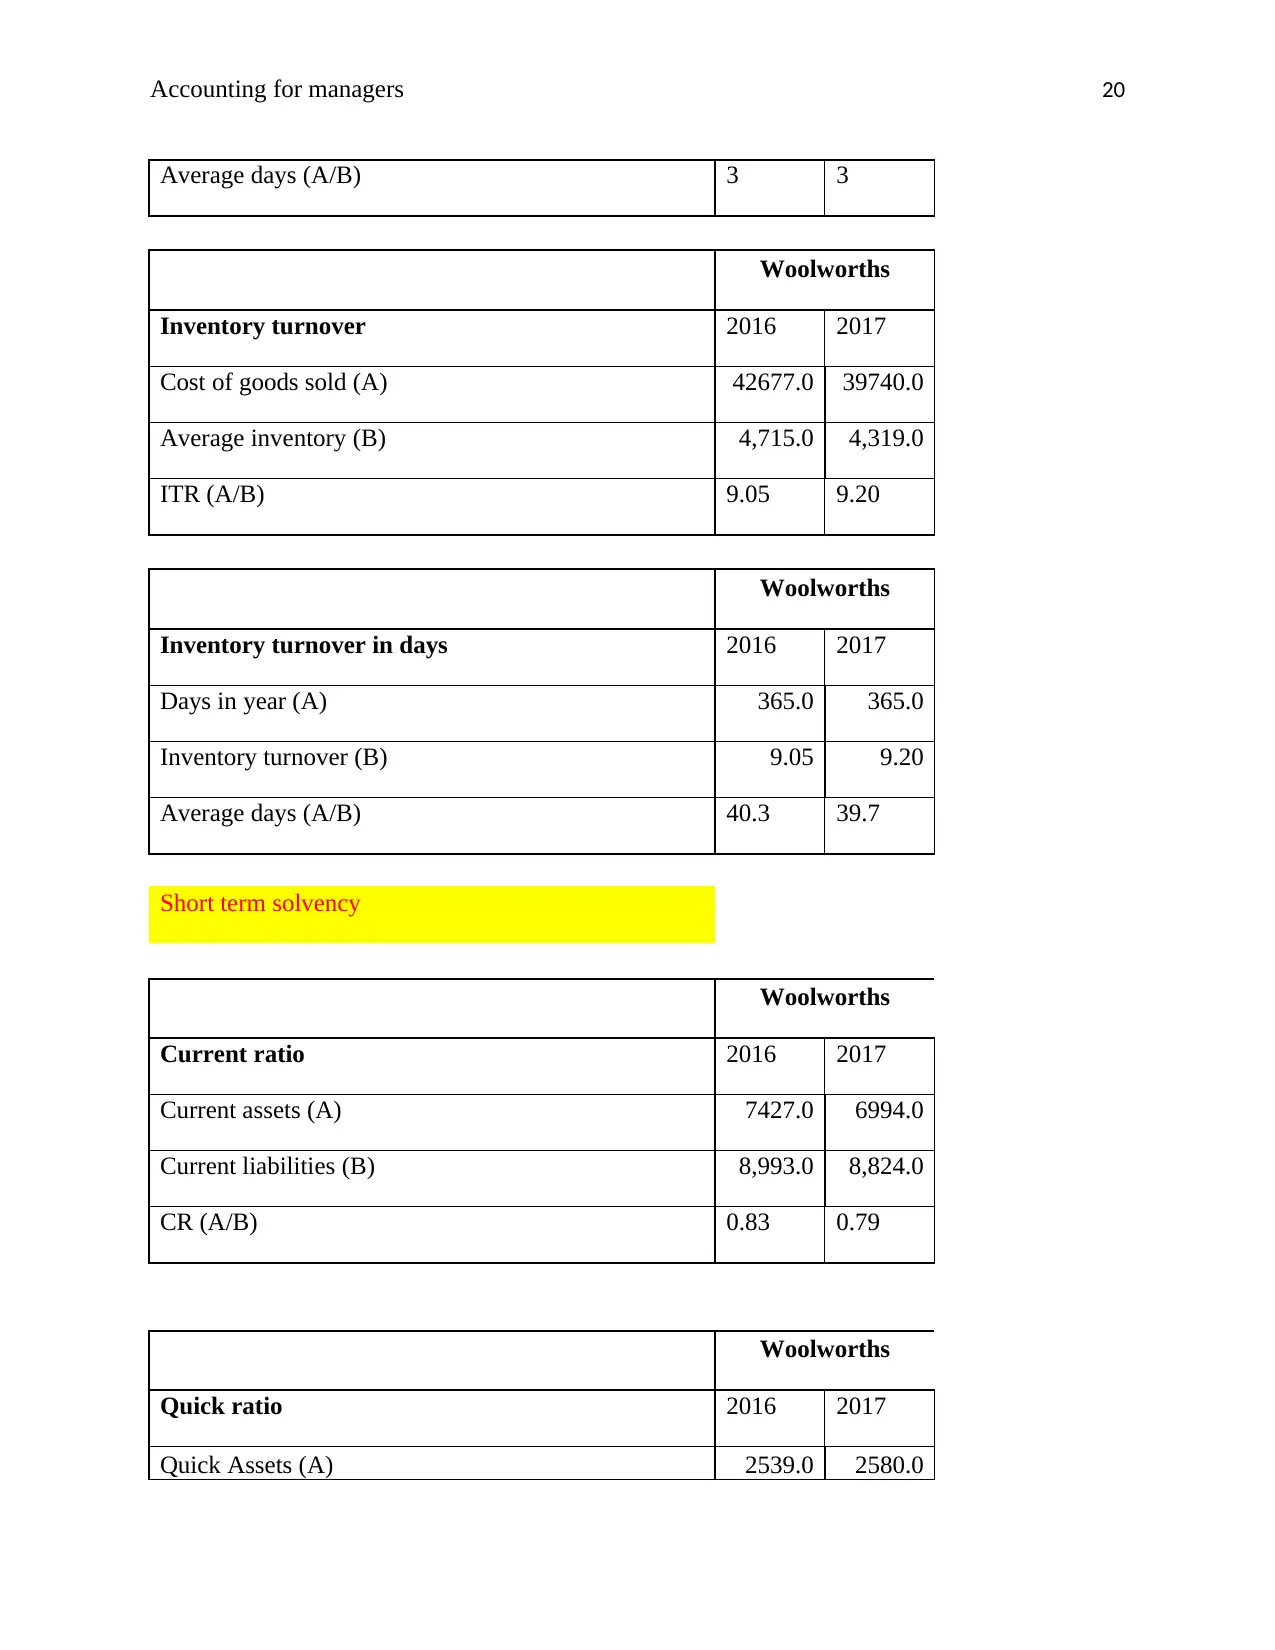
Inventory Turnover ratio: It shows how quickly a firm can convert its inventory into cash
and how efficiently it manages the same (Kimmel, Weygandt and Kieso, 2010).
The ratio has been increased in case of Woolworths as its inventory reduced from $4558 million
to $4080 million. However, it is below the industry average of 14.7 times. Furthermore, WOW’s
inventory days also decreased from 40 days to 39 days in 2017, indicating a better management
of inventory.
Liquidity ratios
Current ratio: It is one of the short term solvency ratios which measure the ability of the
firm to meet its current liabilities with its current assets. The ideal CR is 2:1 (Saleem and
Rehman, 2011).
The CR of WOW has reduced from 0.83 to 0.79 in 2017 and was lower than the average of 1.18.
This was due to the significant reduction in cash balance and an upsurge in the amount of
company’s creditors. This overall reduced the ratio (Appendix 1).
Quick ratio: It is another liquidity ratio which measures the same as current ratio but the
only difference is that it takes into account the most liquid assets of the company (Lee,
Lee and Lee, 2009).
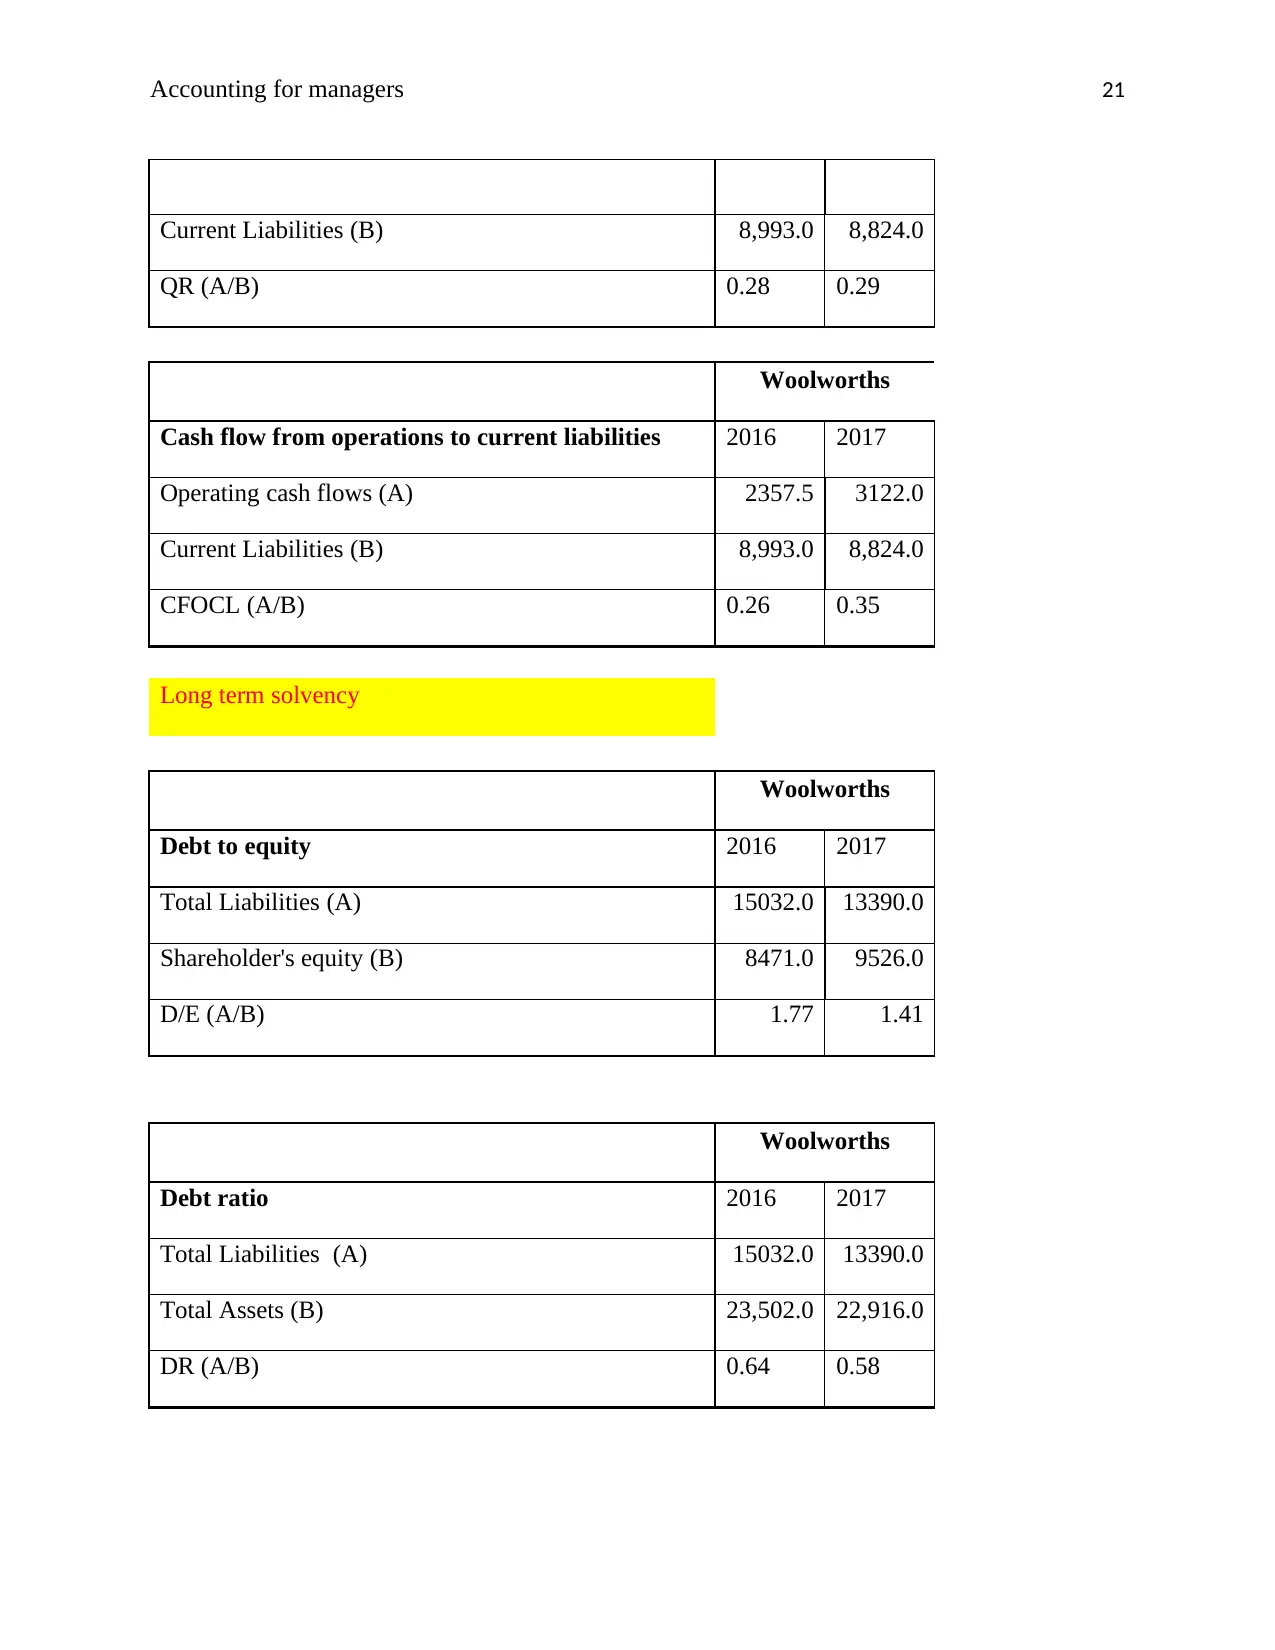
The QR shows a reverse trend as it rose from 0.28 to 0.29 in 2017 but still lower than the
industry standard. The slightest increase was due to the increase in company’s quick assets as
compare to its liabilities.
Inventory Turnover ratio: It shows how quickly a firm can convert its inventory into cash
and how efficiently it manages the same (Kimmel, Weygandt and Kieso, 2010).
The ratio has been increased in case of Woolworths as its inventory reduced from $4558 million
to $4080 million. However, it is below the industry average of 14.7 times. Furthermore, WOW’s
inventory days also decreased from 40 days to 39 days in 2017, indicating a better management
of inventory.
Liquidity ratios
Current ratio: It is one of the short term solvency ratios which measure the ability of the
firm to meet its current liabilities with its current assets. The ideal CR is 2:1 (Saleem and
Rehman, 2011).
The CR of WOW has reduced from 0.83 to 0.79 in 2017 and was lower than the average of 1.18.
This was due to the significant reduction in cash balance and an upsurge in the amount of
company’s creditors. This overall reduced the ratio (Appendix 1).
Quick ratio: It is another liquidity ratio which measures the same as current ratio but the
only difference is that it takes into account the most liquid assets of the company (Lee,
Lee and Lee, 2009).
The QR shows a reverse trend as it rose from 0.28 to 0.29 in 2017 but still lower than the
industry standard. The slightest increase was due to the increase in company’s quick assets as
compare to its liabilities.
Accounting for managers 10
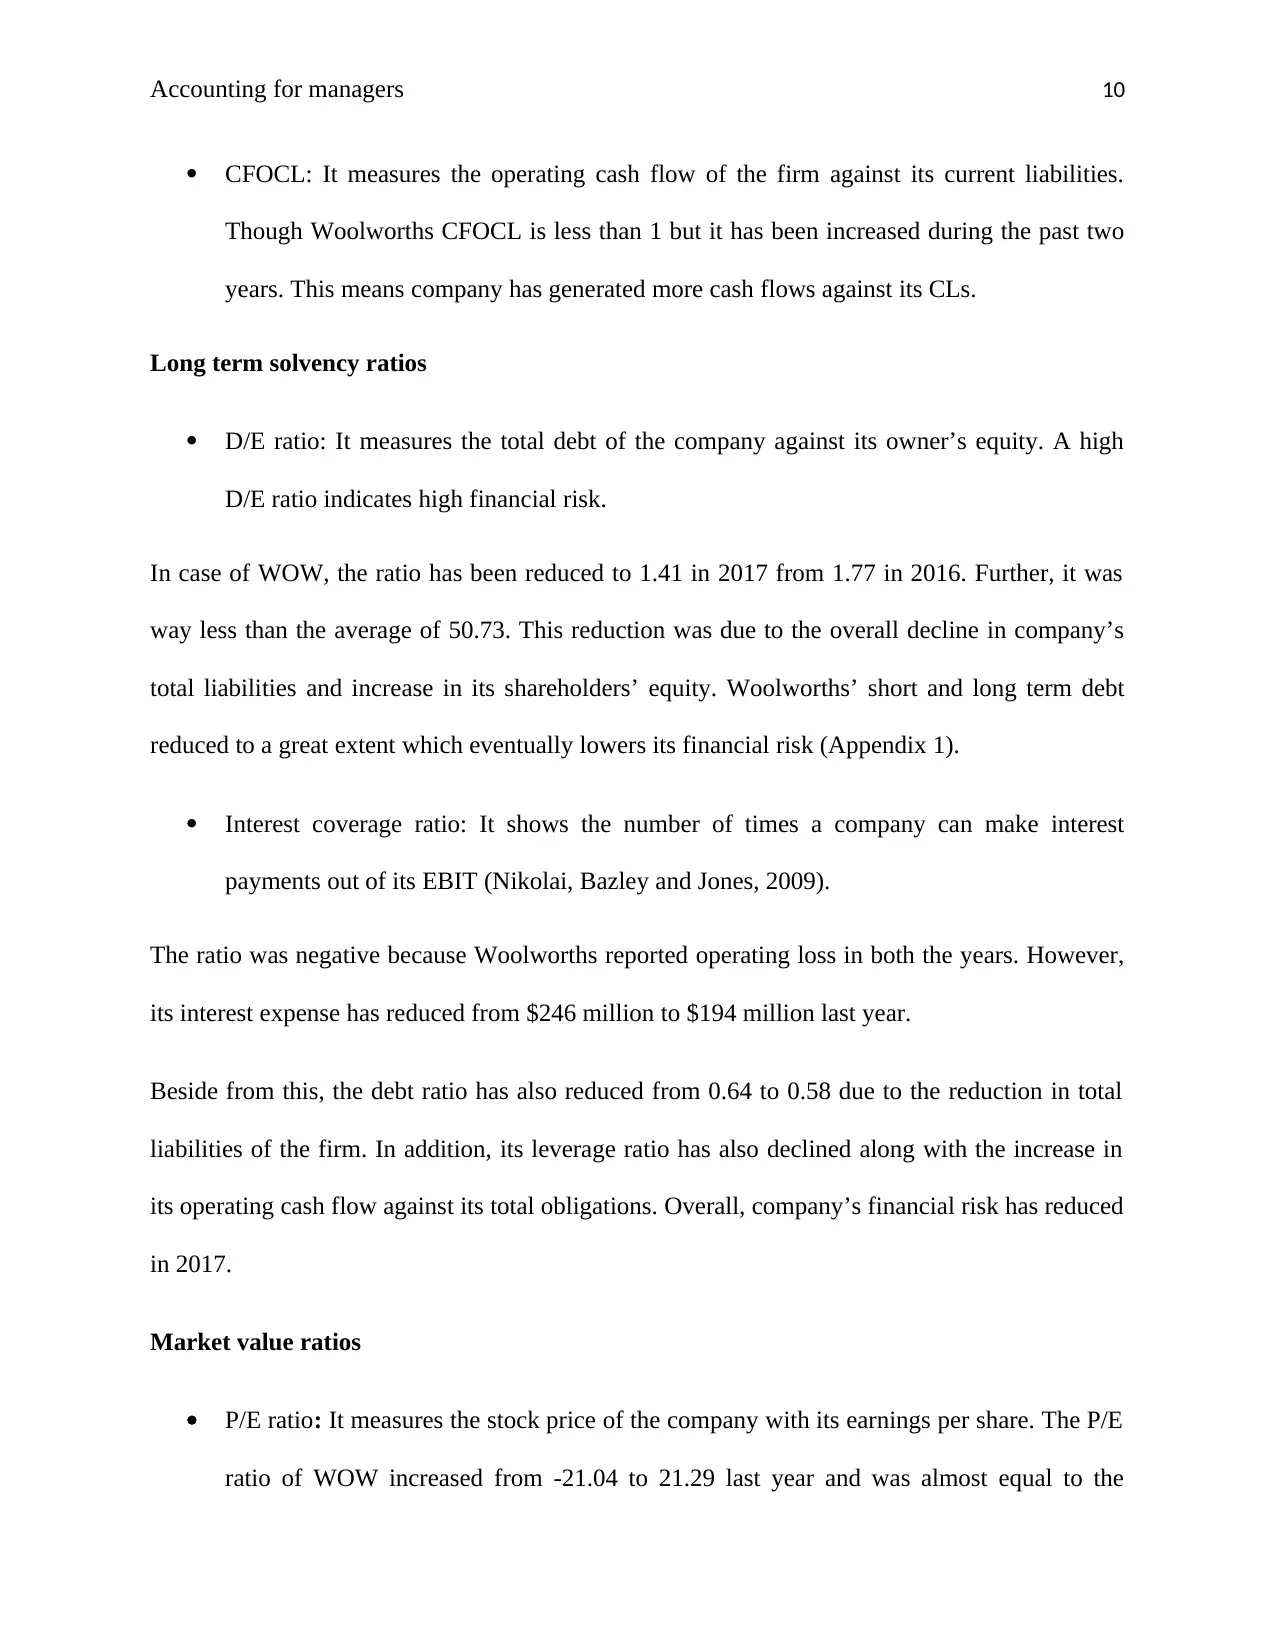
CFOCL: It measures the operating cash flow of the firm against its current liabilities.
Though Woolworths CFOCL is less than 1 but it has been increased during the past two
years. This means company has generated more cash flows against its CLs.
Long term solvency ratios
D/E ratio: It measures the total debt of the company against its owner’s equity. A high
D/E ratio indicates high financial risk.
In case of WOW, the ratio has been reduced to 1.41 in 2017 from 1.77 in 2016. Further, it was
way less than the average of 50.73. This reduction was due to the overall decline in company’s
total liabilities and increase in its shareholders’ equity. Woolworths’ short and long term debt
reduced to a great extent which eventually lowers its financial risk (Appendix 1).
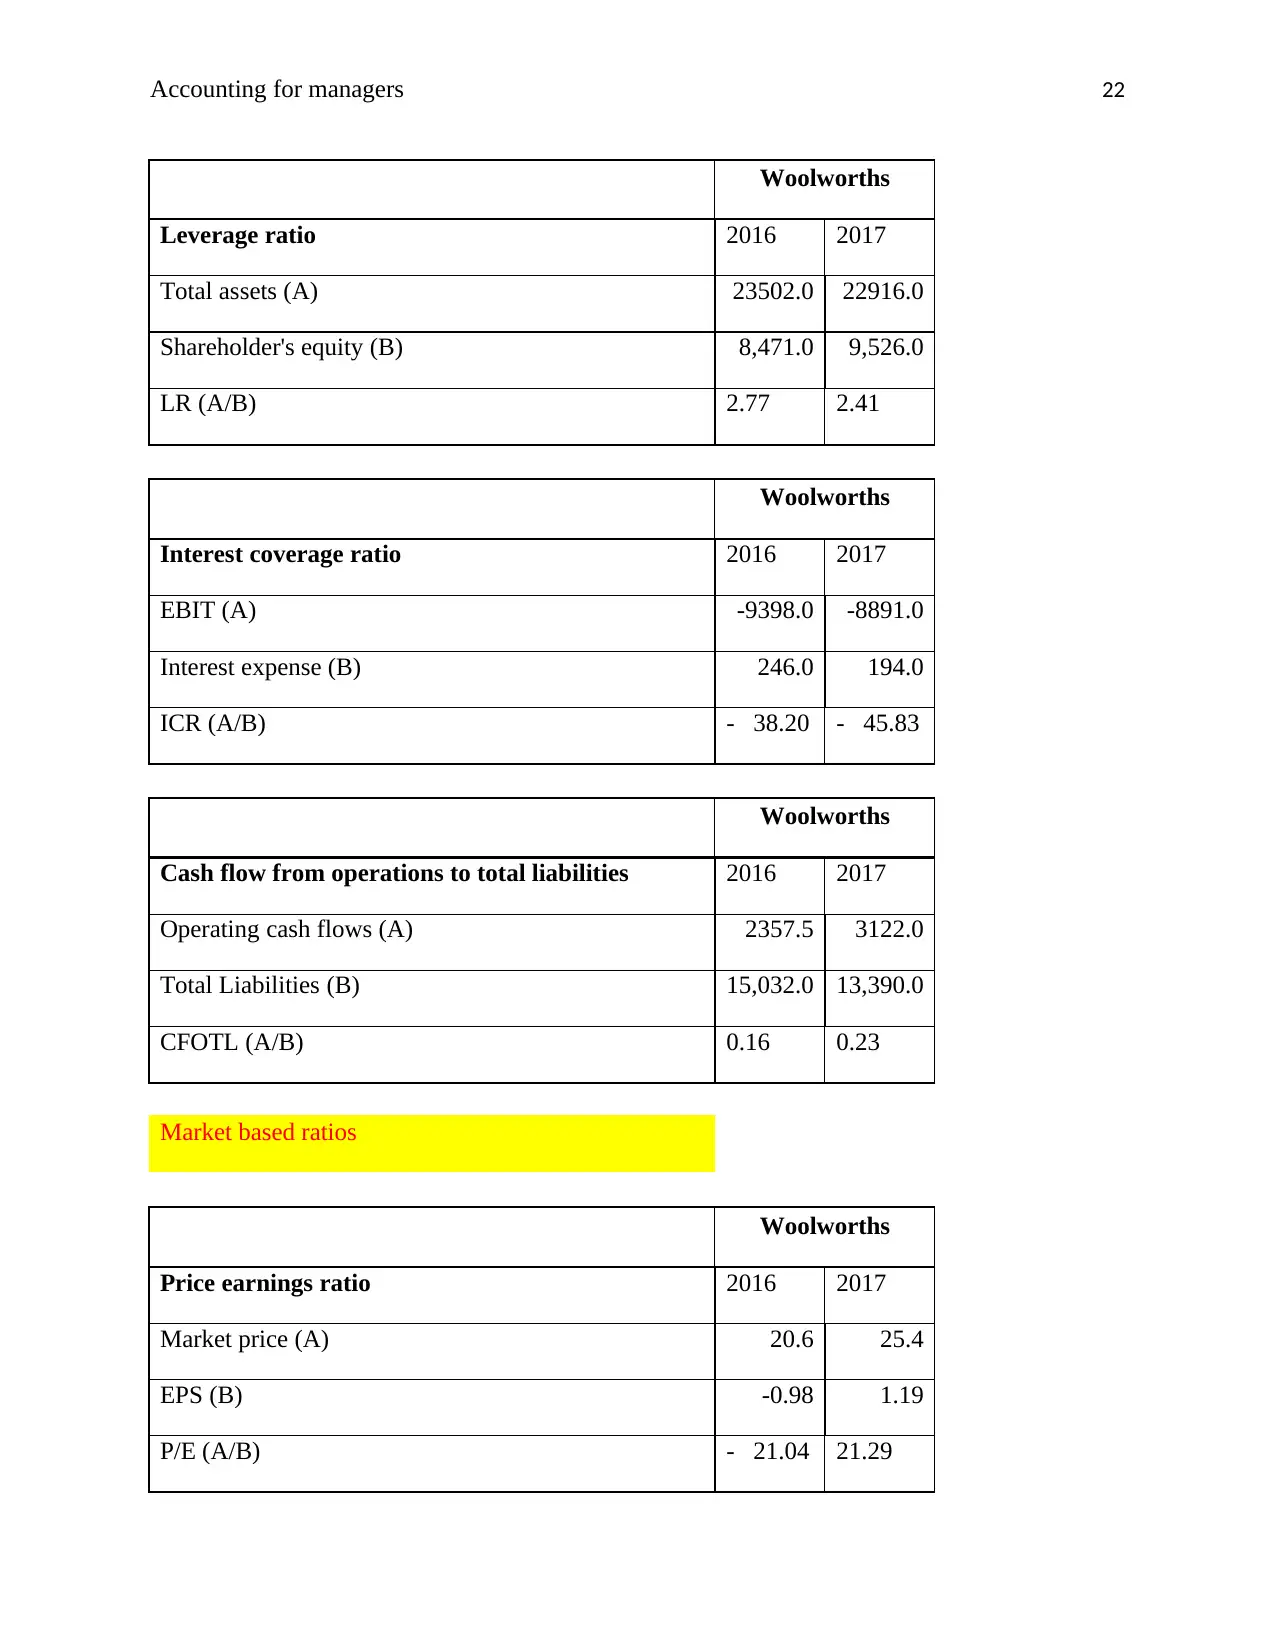
Interest coverage ratio: It shows the number of times a company can make interest
payments out of its EBIT (Nikolai, Bazley and Jones, 2009).
The ratio was negative because Woolworths reported operating loss in both the years. However,
its interest expense has reduced from $246 million to $194 million last year.
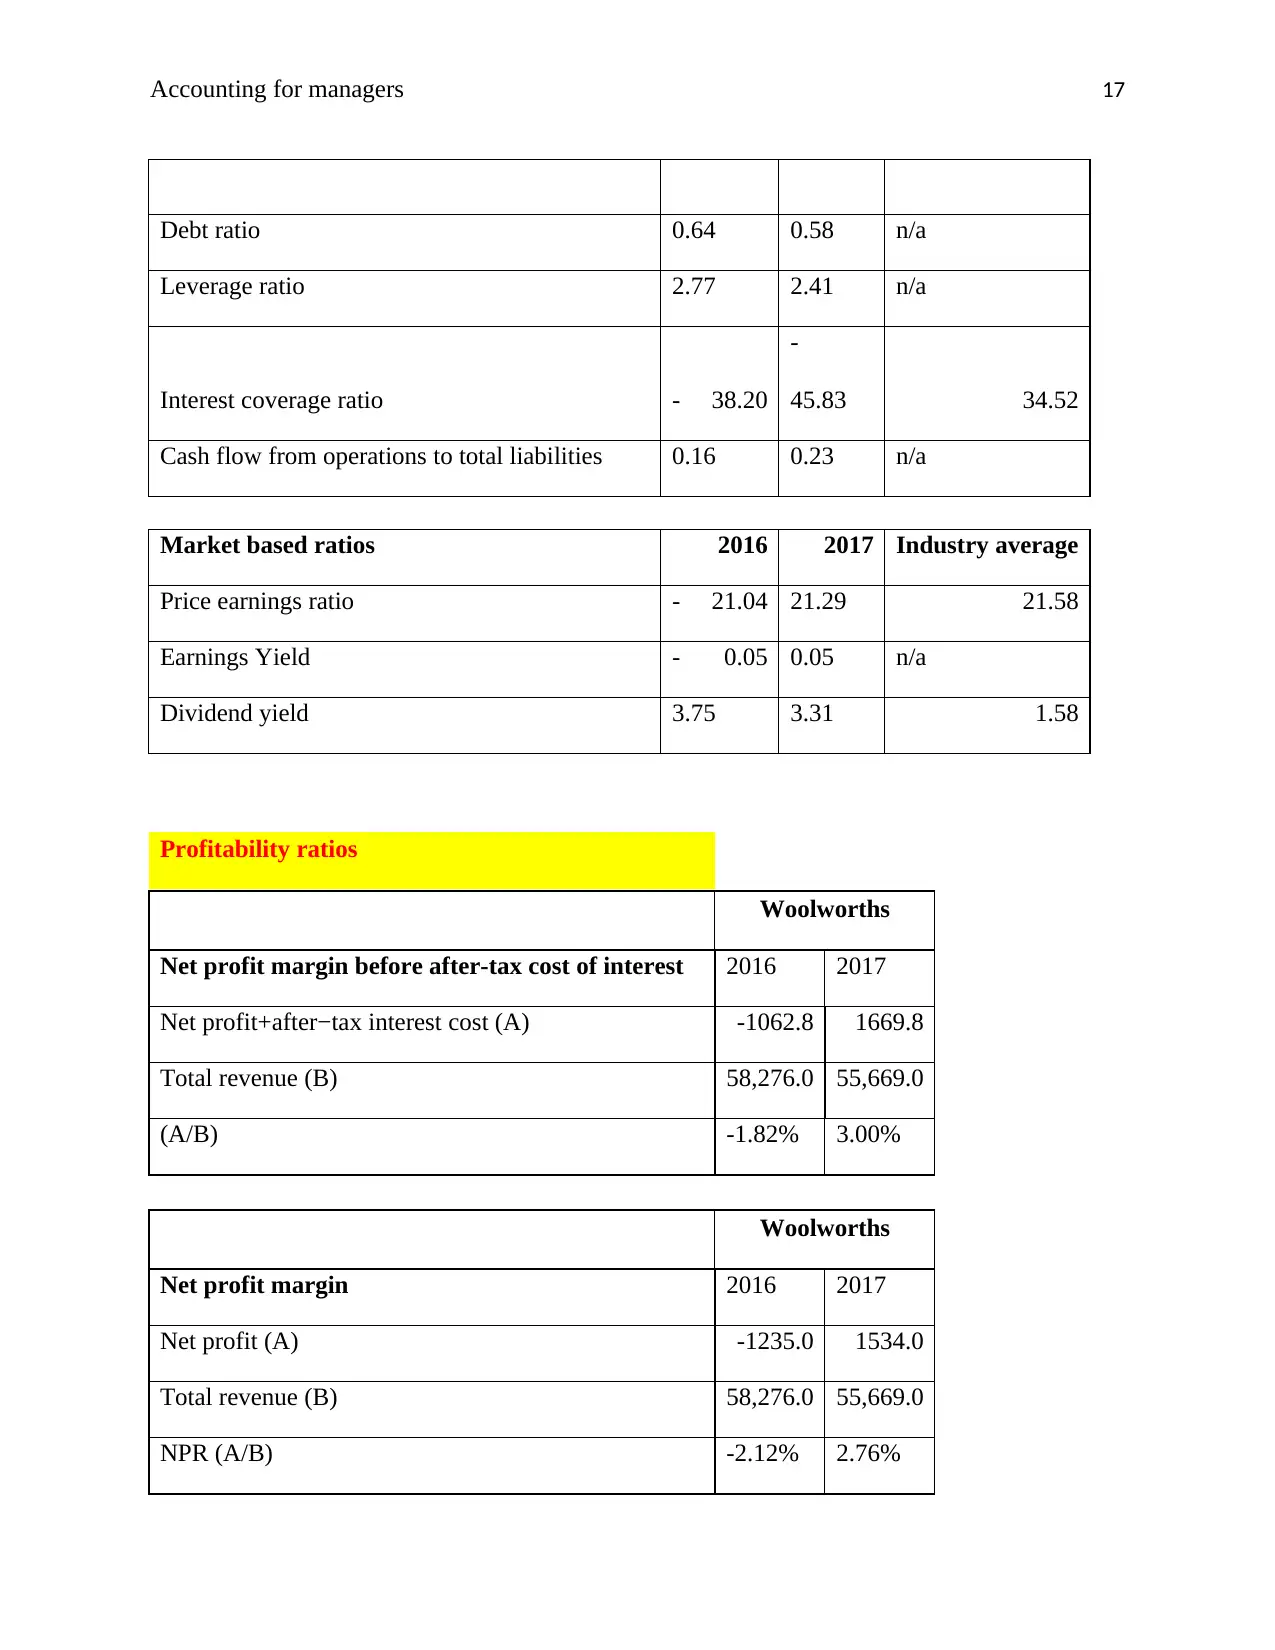
Beside from this, the debt ratio has also reduced from 0.64 to 0.58 due to the reduction in total
liabilities of the firm. In addition, its leverage ratio has also declined along with the increase in
its operating cash flow against its total obligations. Overall, company’s financial risk has reduced
in 2017.
Market value ratios
P/E ratio: It measures the stock price of the company with its earnings per share. The P/E
ratio of WOW increased from -21.04 to 21.29 last year and was almost equal to the
CFOCL: It measures the operating cash flow of the firm against its current liabilities.
Though Woolworths CFOCL is less than 1 but it has been increased during the past two
years. This means company has generated more cash flows against its CLs.
Long term solvency ratios
D/E ratio: It measures the total debt of the company against its owner’s equity. A high
D/E ratio indicates high financial risk.
In case of WOW, the ratio has been reduced to 1.41 in 2017 from 1.77 in 2016. Further, it was
way less than the average of 50.73. This reduction was due to the overall decline in company’s
total liabilities and increase in its shareholders’ equity. Woolworths’ short and long term debt
reduced to a great extent which eventually lowers its financial risk (Appendix 1).
Interest coverage ratio: It shows the number of times a company can make interest
payments out of its EBIT (Nikolai, Bazley and Jones, 2009).
The ratio was negative because Woolworths reported operating loss in both the years. However,
its interest expense has reduced from $246 million to $194 million last year.
Beside from this, the debt ratio has also reduced from 0.64 to 0.58 due to the reduction in total
liabilities of the firm. In addition, its leverage ratio has also declined along with the increase in
its operating cash flow against its total obligations. Overall, company’s financial risk has reduced
in 2017.
Market value ratios
P/E ratio: It measures the stock price of the company with its earnings per share. The P/E
ratio of WOW increased from -21.04 to 21.29 last year and was almost equal to the
Secure Best Marks with AI Grader
Need help grading? Try our AI Grader for instant feedback on your assignments.
Accounting for managers 11
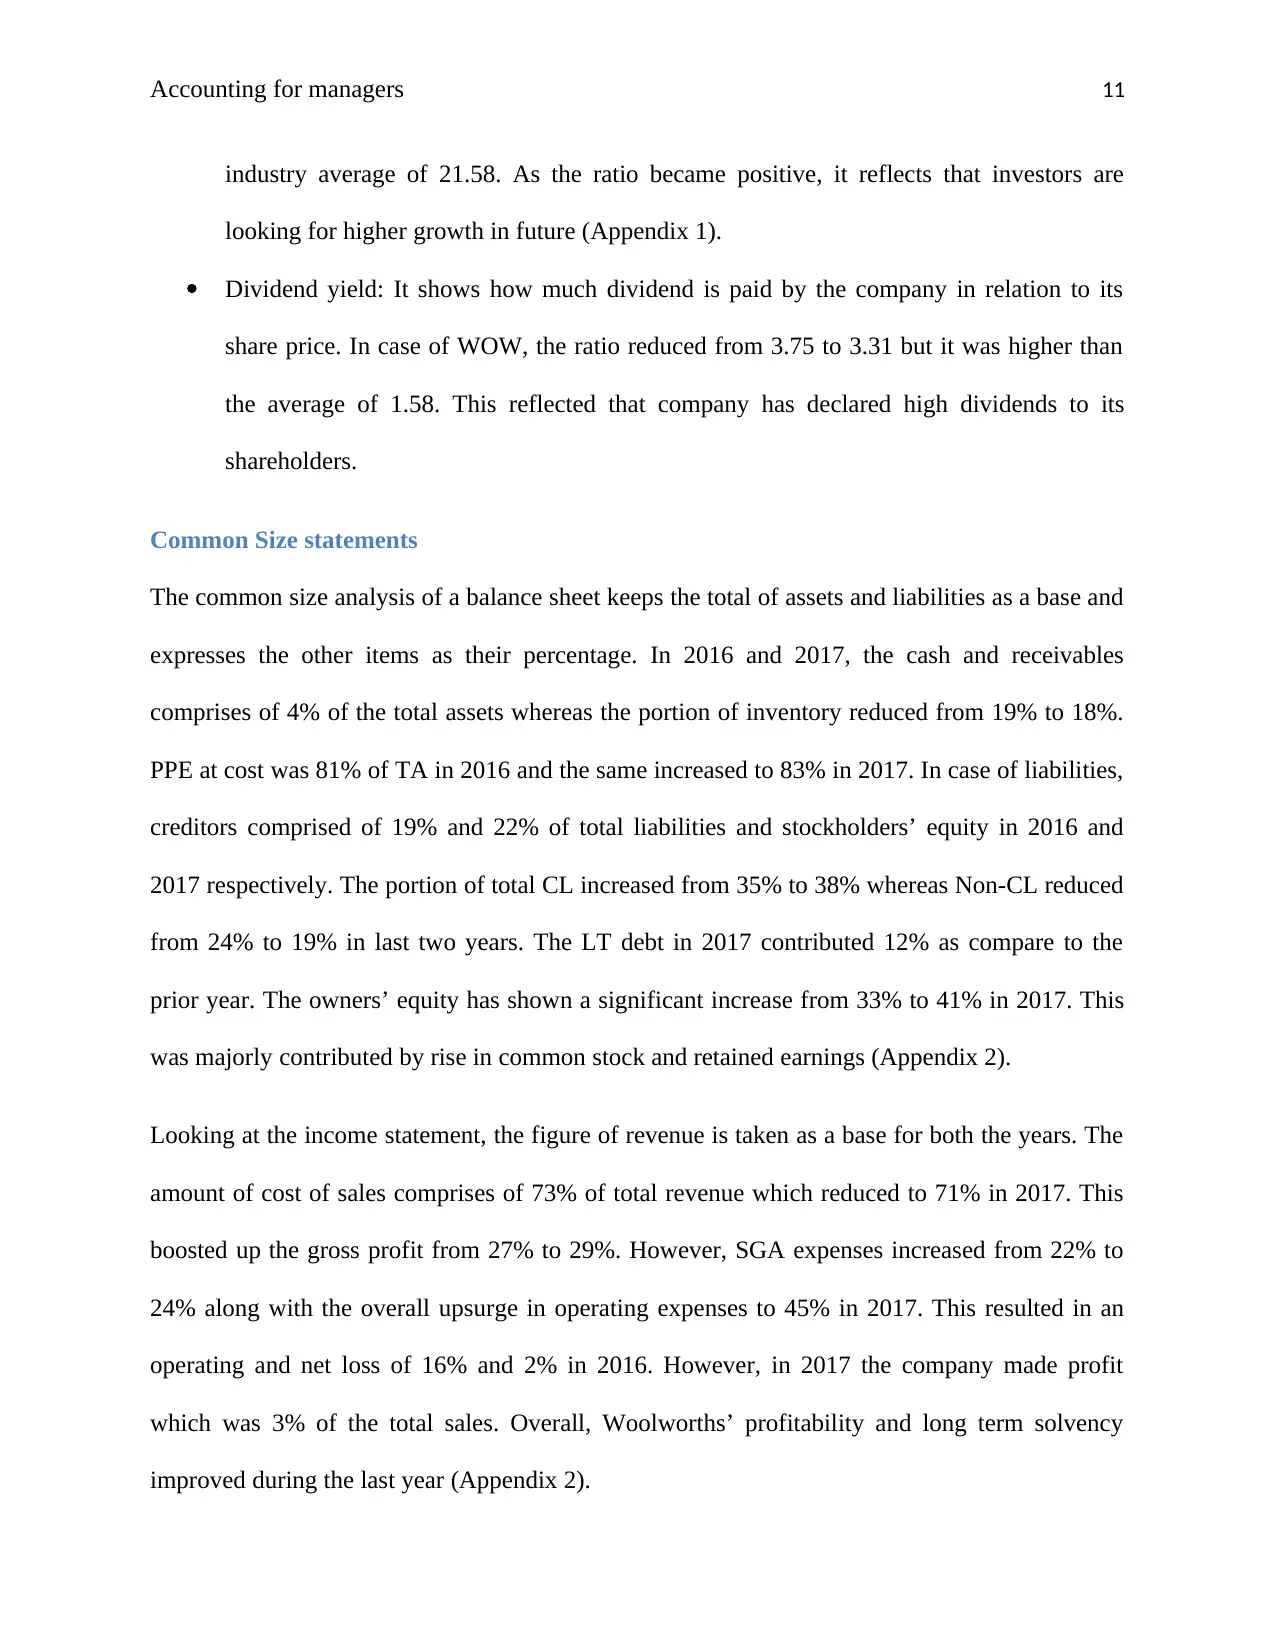
industry average of 21.58. As the ratio became positive, it reflects that investors are
looking for higher growth in future (Appendix 1).
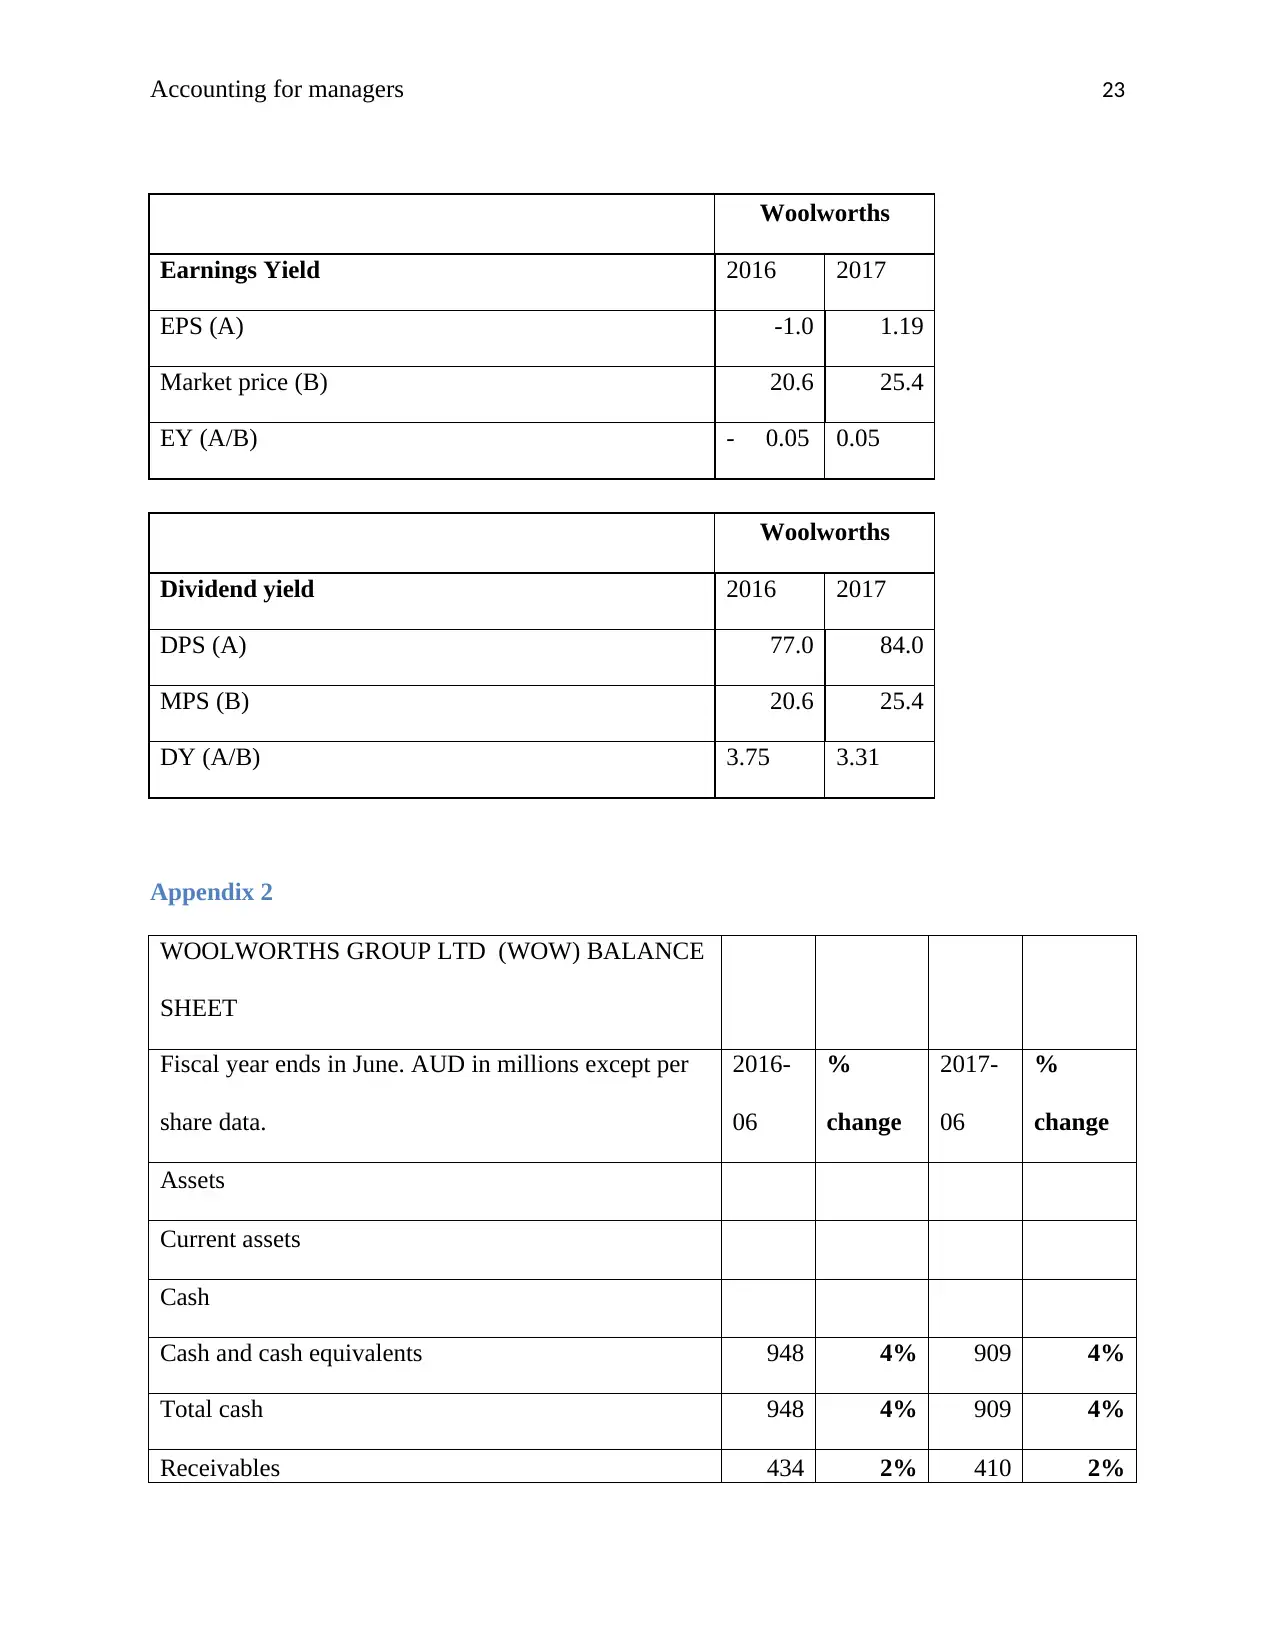
Dividend yield: It shows how much dividend is paid by the company in relation to its
share price. In case of WOW, the ratio reduced from 3.75 to 3.31 but it was higher than
the average of 1.58. This reflected that company has declared high dividends to its
shareholders.
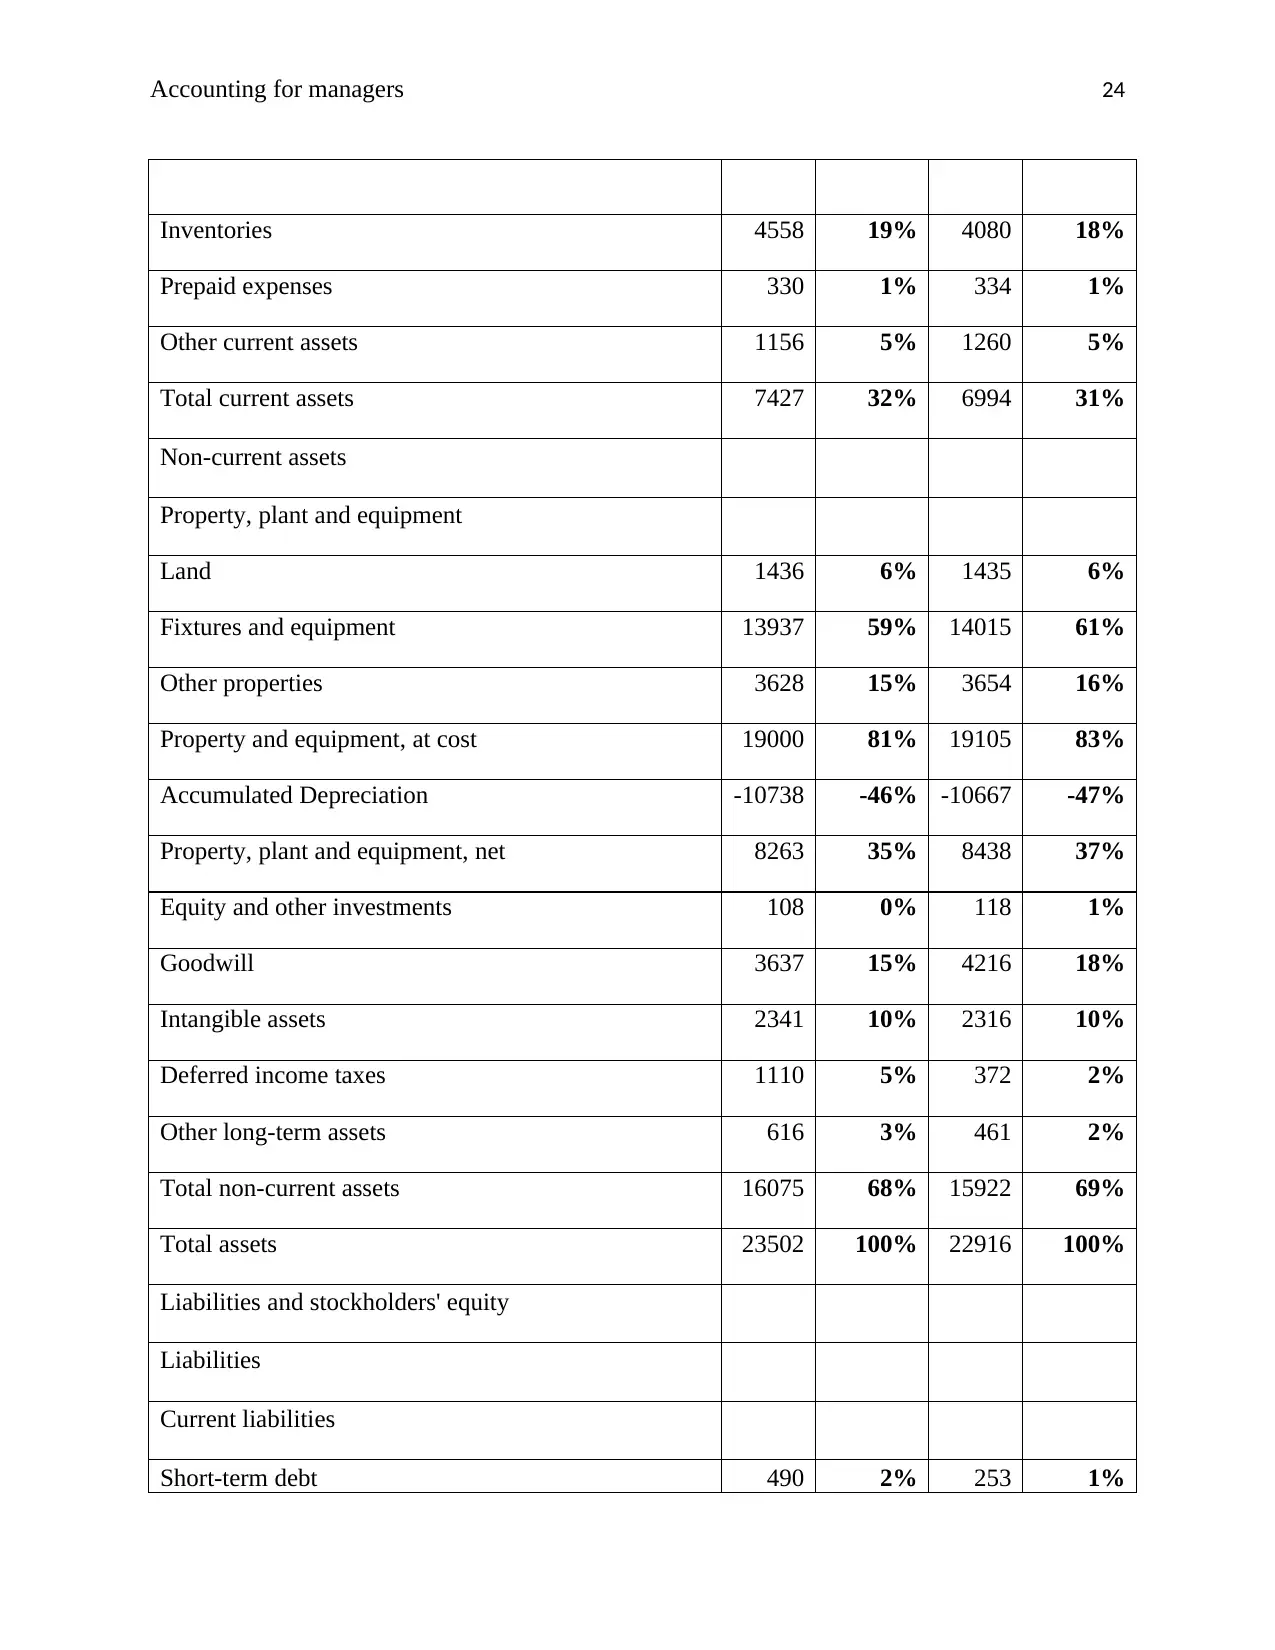
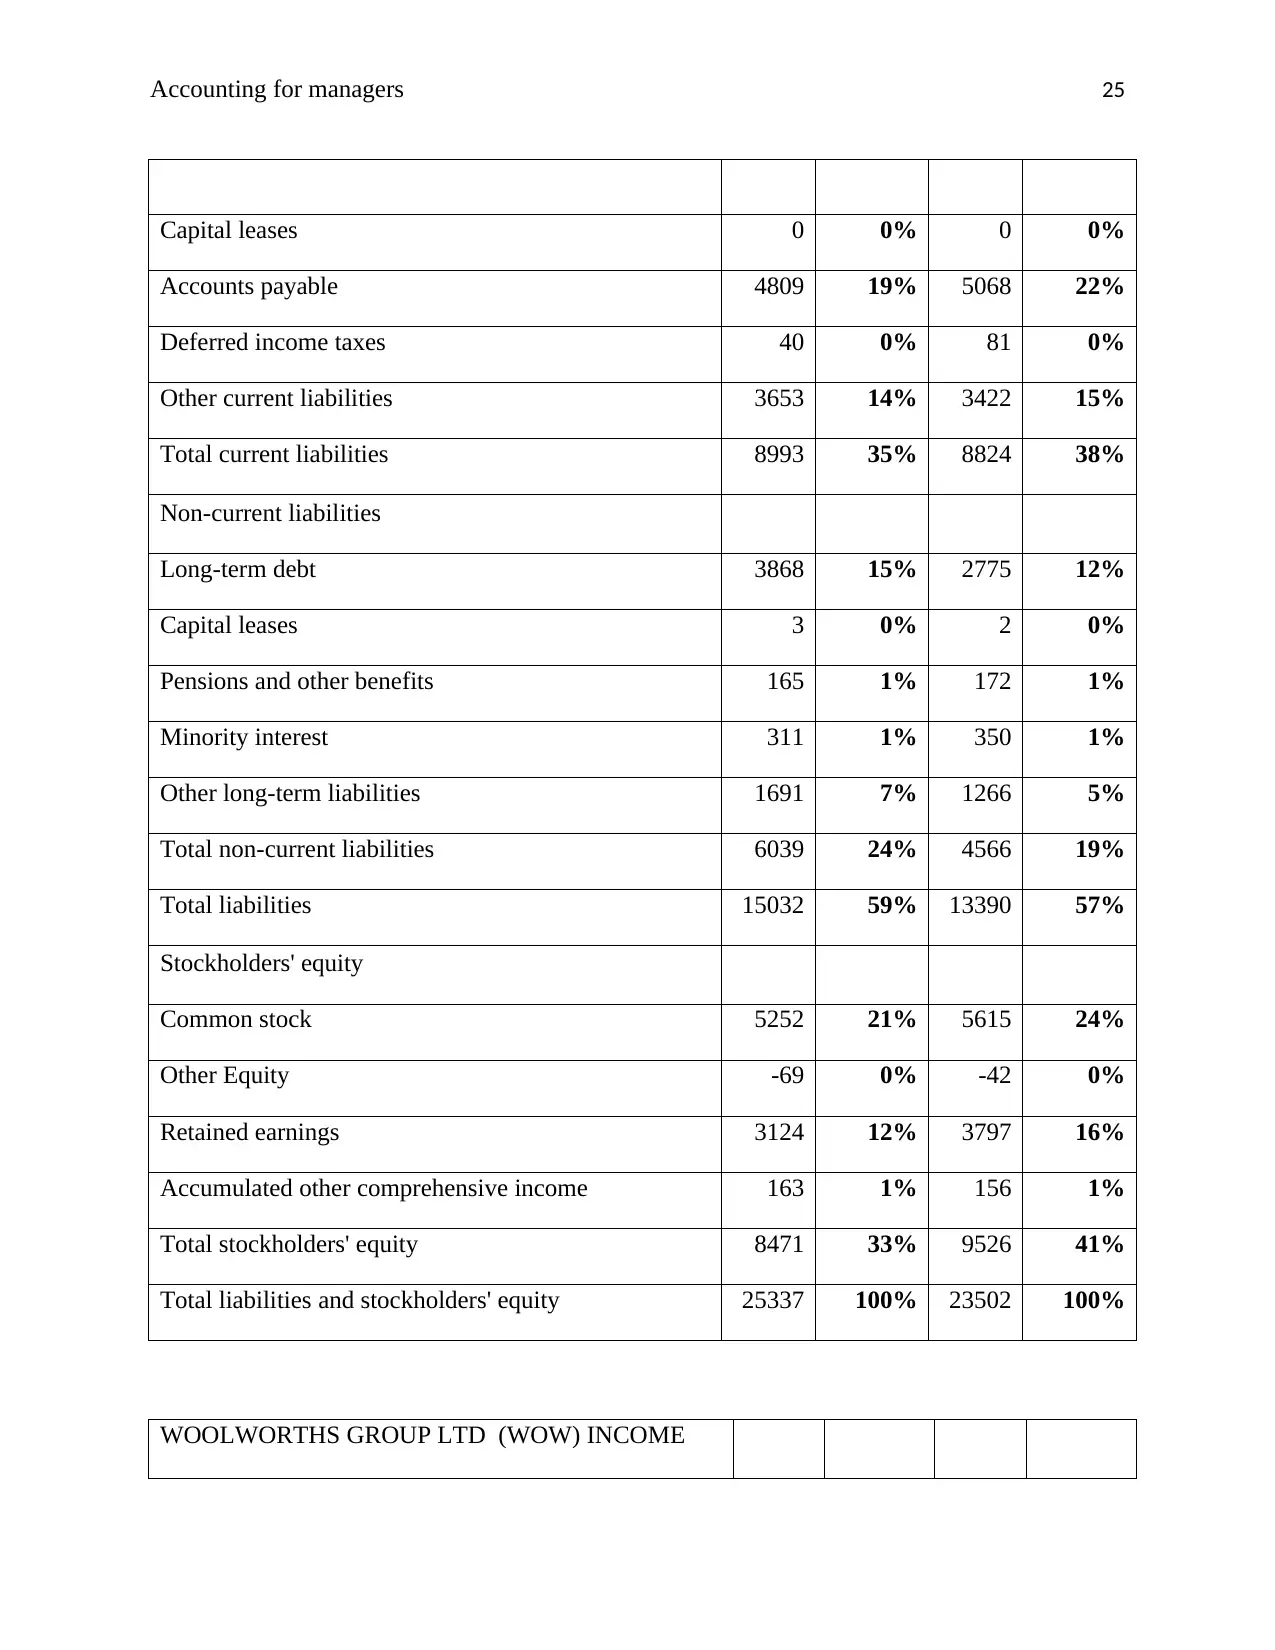
Common Size statements
The common size analysis of a balance sheet keeps the total of assets and liabilities as a base and
expresses the other items as their percentage. In 2016 and 2017, the cash and receivables
comprises of 4% of the total assets whereas the portion of inventory reduced from 19% to 18%.
PPE at cost was 81% of TA in 2016 and the same increased to 83% in 2017. In case of liabilities,
creditors comprised of 19% and 22% of total liabilities and stockholders’ equity in 2016 and
2017 respectively. The portion of total CL increased from 35% to 38% whereas Non-CL reduced
from 24% to 19% in last two years. The LT debt in 2017 contributed 12% as compare to the
prior year. The owners’ equity has shown a significant increase from 33% to 41% in 2017. This
was majorly contributed by rise in common stock and retained earnings (Appendix 2).
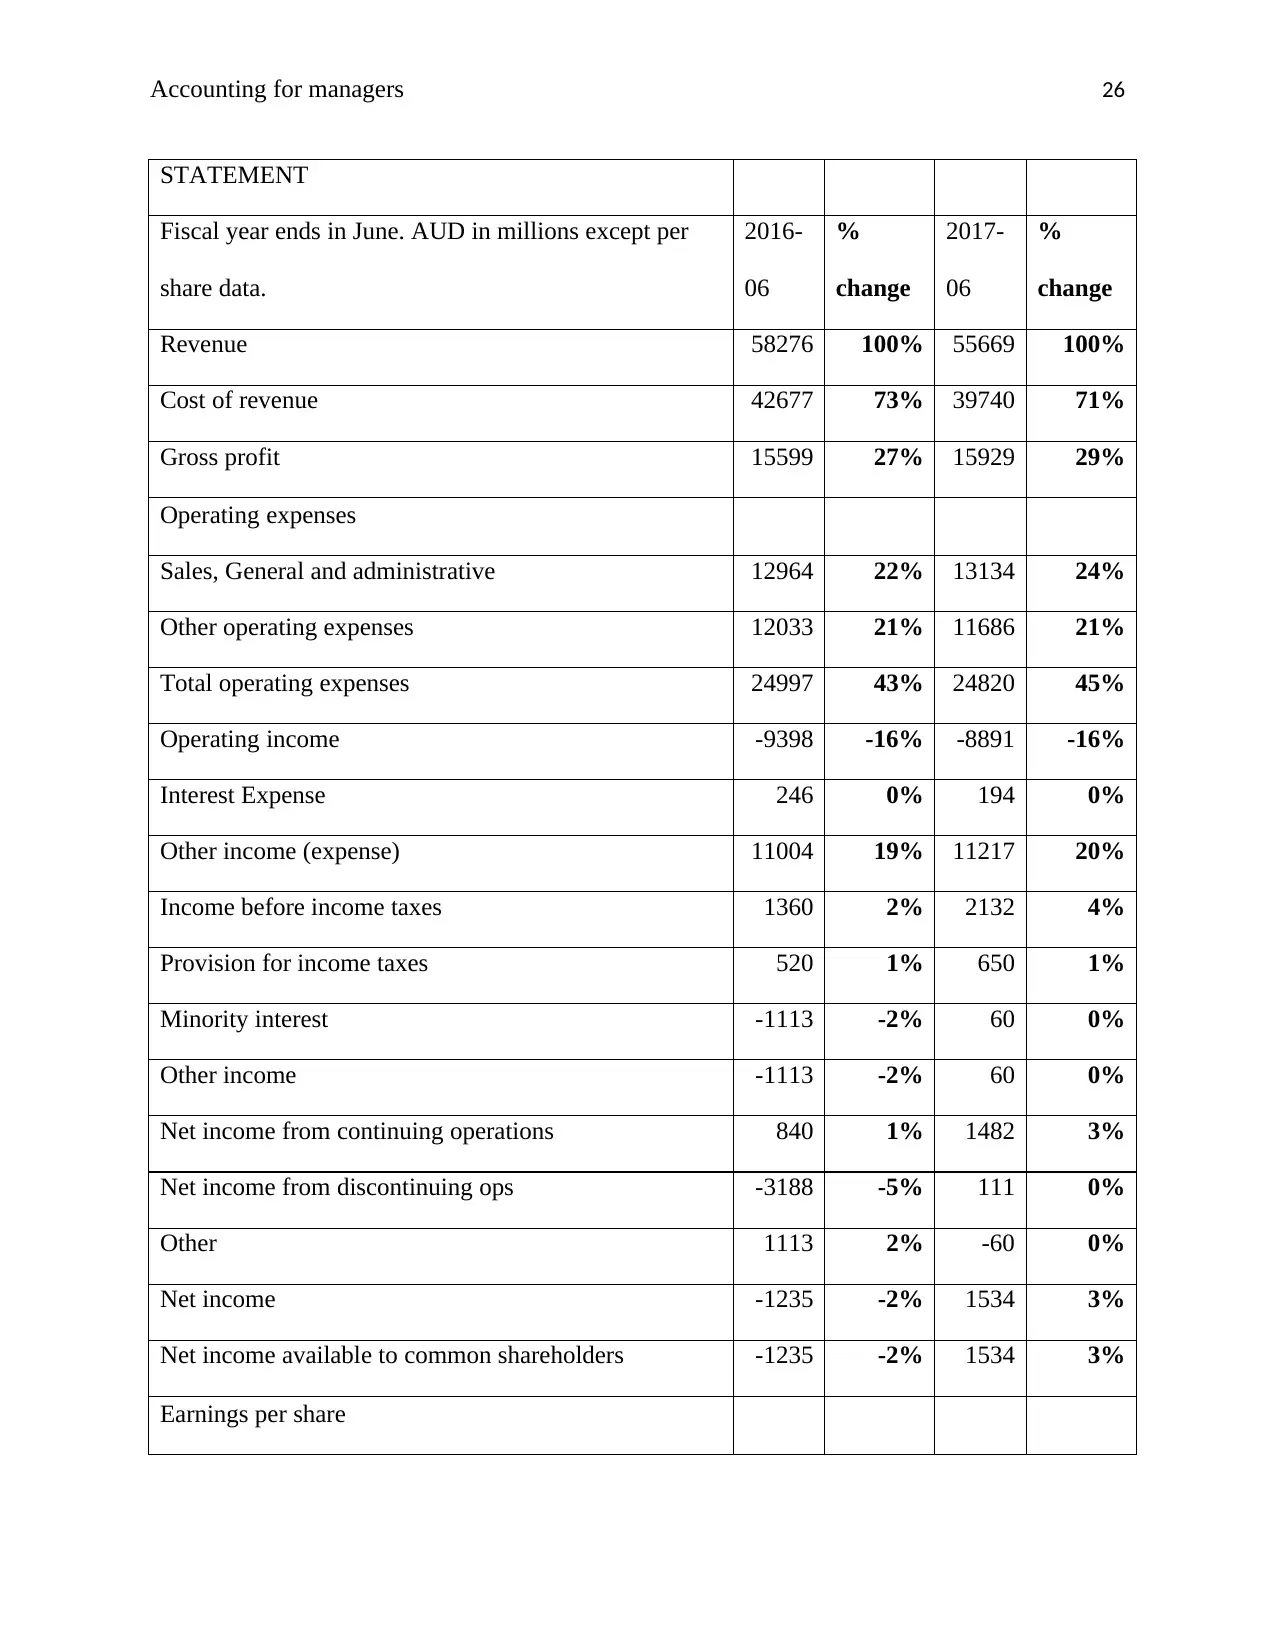
Looking at the income statement, the figure of revenue is taken as a base for both the years. The
amount of cost of sales comprises of 73% of total revenue which reduced to 71% in 2017. This
boosted up the gross profit from 27% to 29%. However, SGA expenses increased from 22% to
24% along with the overall upsurge in operating expenses to 45% in 2017. This resulted in an
operating and net loss of 16% and 2% in 2016. However, in 2017 the company made profit
which was 3% of the total sales. Overall, Woolworths’ profitability and long term solvency
improved during the last year (Appendix 2).
industry average of 21.58. As the ratio became positive, it reflects that investors are
looking for higher growth in future (Appendix 1).
Dividend yield: It shows how much dividend is paid by the company in relation to its
share price. In case of WOW, the ratio reduced from 3.75 to 3.31 but it was higher than
the average of 1.58. This reflected that company has declared high dividends to its
shareholders.
Common Size statements
The common size analysis of a balance sheet keeps the total of assets and liabilities as a base and
expresses the other items as their percentage. In 2016 and 2017, the cash and receivables
comprises of 4% of the total assets whereas the portion of inventory reduced from 19% to 18%.
PPE at cost was 81% of TA in 2016 and the same increased to 83% in 2017. In case of liabilities,
creditors comprised of 19% and 22% of total liabilities and stockholders’ equity in 2016 and
2017 respectively. The portion of total CL increased from 35% to 38% whereas Non-CL reduced
from 24% to 19% in last two years. The LT debt in 2017 contributed 12% as compare to the
prior year. The owners’ equity has shown a significant increase from 33% to 41% in 2017. This
was majorly contributed by rise in common stock and retained earnings (Appendix 2).
Looking at the income statement, the figure of revenue is taken as a base for both the years. The
amount of cost of sales comprises of 73% of total revenue which reduced to 71% in 2017. This
boosted up the gross profit from 27% to 29%. However, SGA expenses increased from 22% to
24% along with the overall upsurge in operating expenses to 45% in 2017. This resulted in an
operating and net loss of 16% and 2% in 2016. However, in 2017 the company made profit
which was 3% of the total sales. Overall, Woolworths’ profitability and long term solvency
improved during the last year (Appendix 2).
Accounting for managers 12
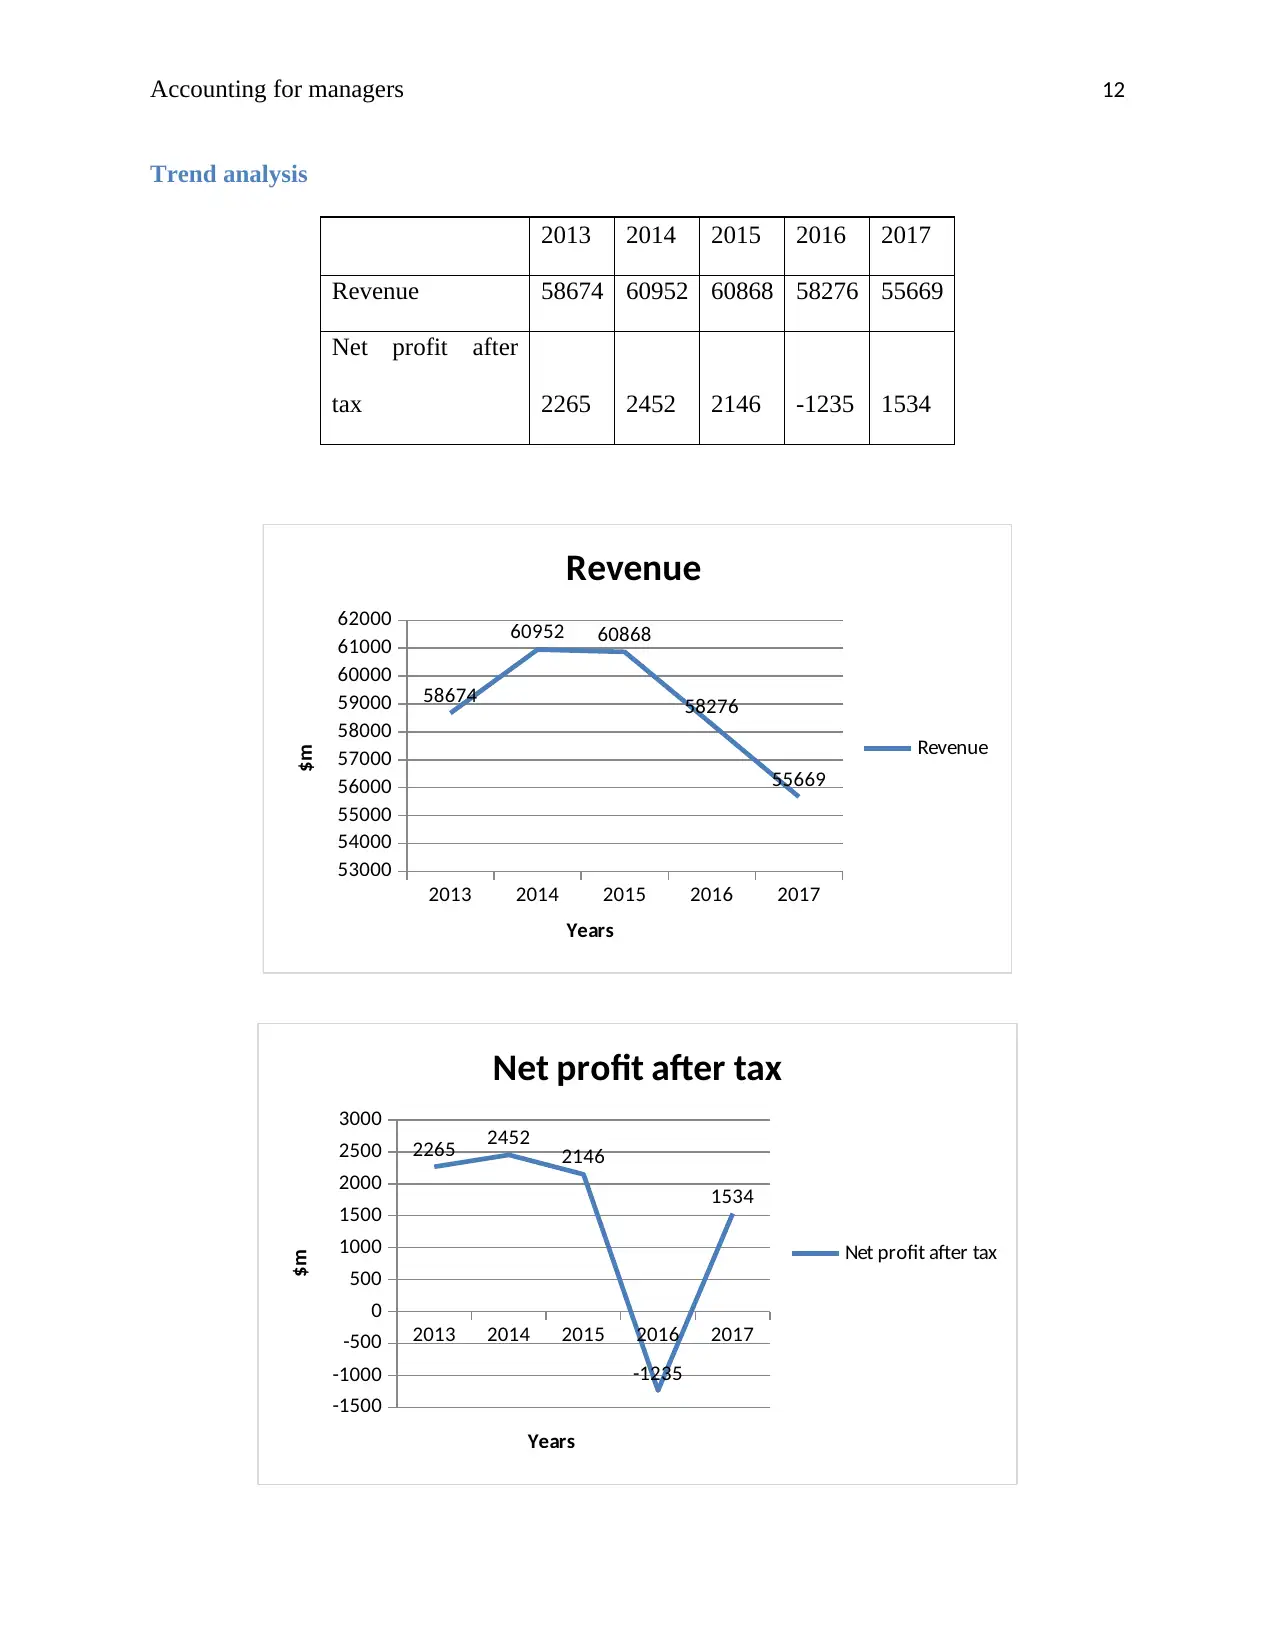
Trend analysis
2013 2014 2015 2016 2017
Revenue 58674 60952 60868 58276 55669
Net profit after
tax 2265 2452 2146 -1235 1534
2013 2014 2015 2016 2017
53000
54000
55000
56000
57000
58000
59000
60000
61000
62000
58674
60952 60868
58276
55669
Revenue
Revenue
Years
$m
2013 2014 2015 2016 2017
-1500
-1000
-500
0
500
1000
1500
2000
2500
3000
2265 2452 2146
-1235
1534
Net profit after tax
Net profit after tax
Years
$m
Accounting for managers 13
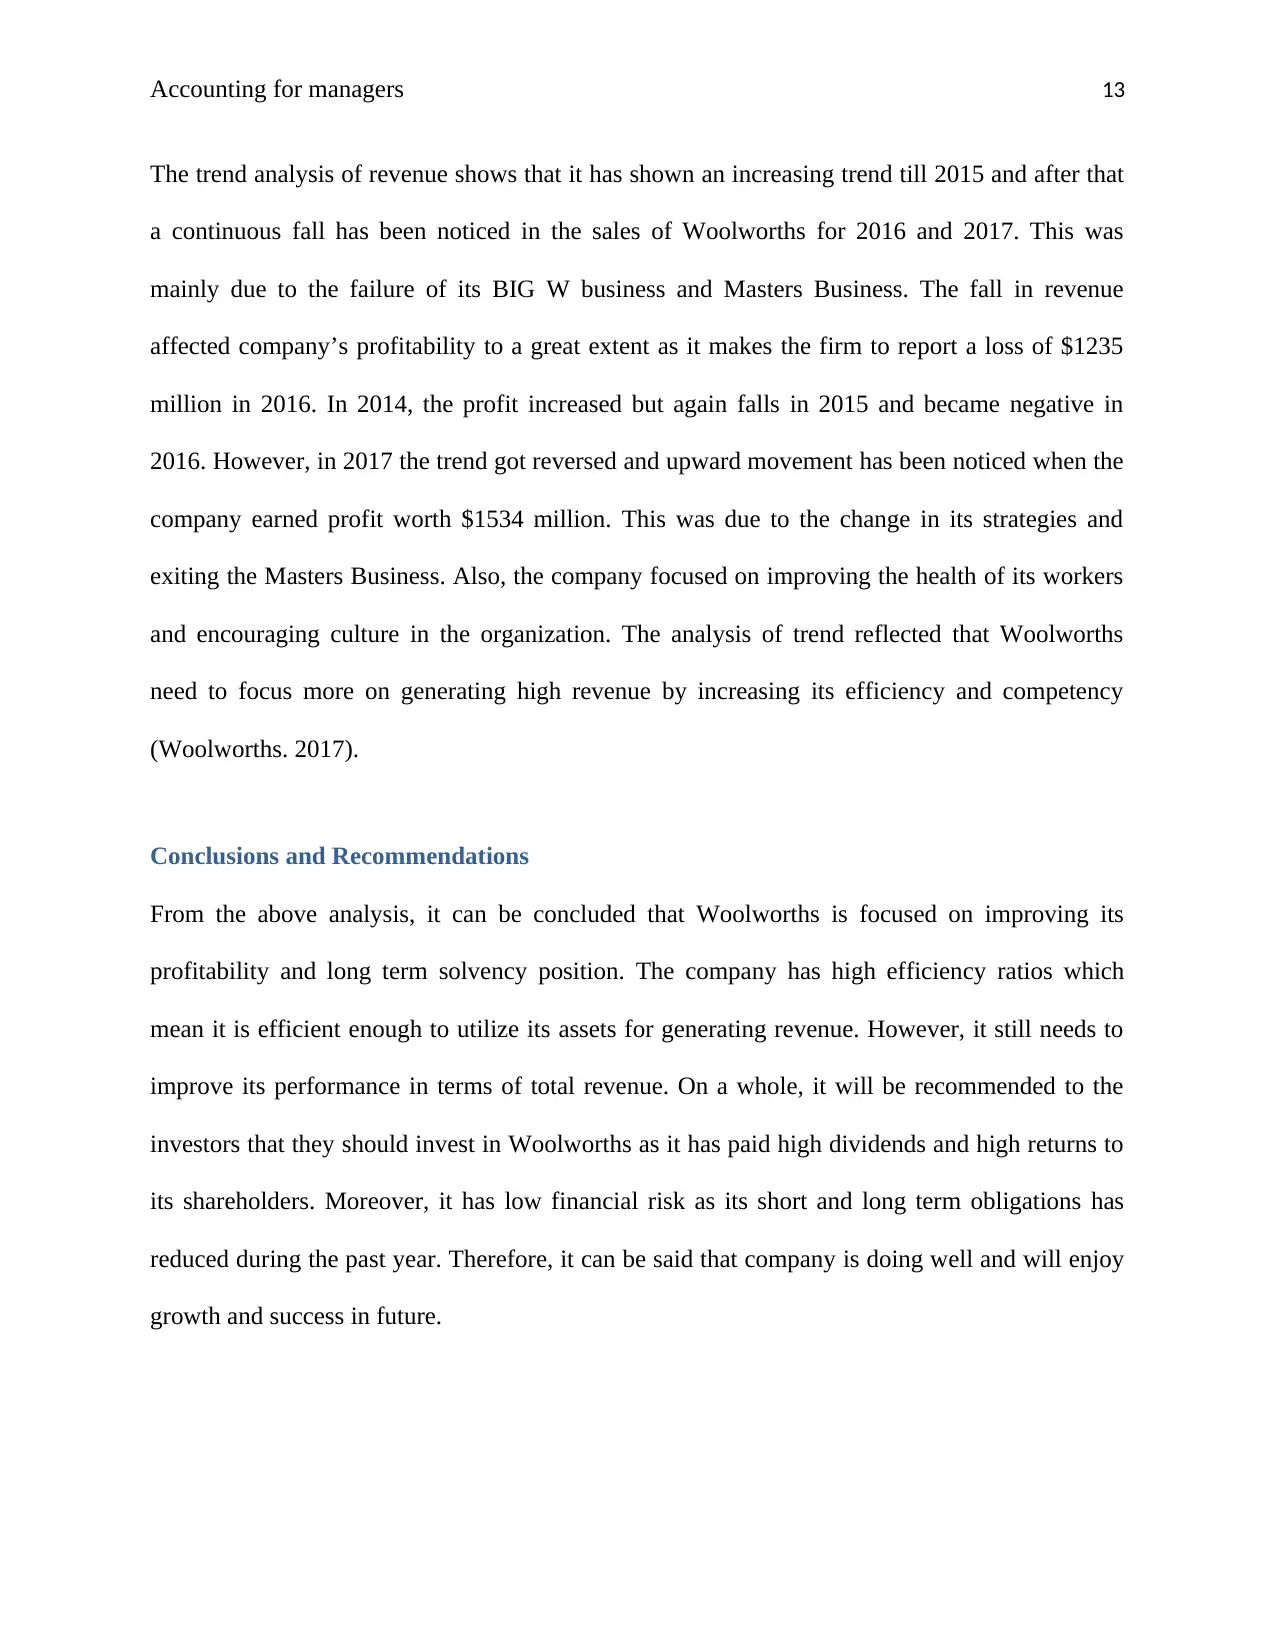
The trend analysis of revenue shows that it has shown an increasing trend till 2015 and after that
a continuous fall has been noticed in the sales of Woolworths for 2016 and 2017. This was
mainly due to the failure of its BIG W business and Masters Business. The fall in revenue
affected company’s profitability to a great extent as it makes the firm to report a loss of $1235
million in 2016. In 2014, the profit increased but again falls in 2015 and became negative in
2016. However, in 2017 the trend got reversed and upward movement has been noticed when the
company earned profit worth $1534 million. This was due to the change in its strategies and
exiting the Masters Business. Also, the company focused on improving the health of its workers
and encouraging culture in the organization. The analysis of trend reflected that Woolworths
need to focus more on generating high revenue by increasing its efficiency and competency
(Woolworths. 2017).
Conclusions and Recommendations
From the above analysis, it can be concluded that Woolworths is focused on improving its
profitability and long term solvency position. The company has high efficiency ratios which
mean it is efficient enough to utilize its assets for generating revenue. However, it still needs to
improve its performance in terms of total revenue. On a whole, it will be recommended to the
investors that they should invest in Woolworths as it has paid high dividends and high returns to
its shareholders. Moreover, it has low financial risk as its short and long term obligations has
reduced during the past year. Therefore, it can be said that company is doing well and will enjoy
growth and success in future.
Paraphrase This Document
Need a fresh take? Get an instant paraphrase of this document with our AI Paraphraser
Accounting for managers 14
References
Bloomberg (2018).Company Overview of Woolworths Group Limited. [Online]. Available at:
https://www.bloomberg.com/research/stocks/private/snapshot.asp?privcapId=874687
Bragg, S. M. (2012). Business ratios and formulas: a comprehensive guide (Vol. 577). New
Jersey: John Wiley & Sons.
Bragg, S. M. (2012). Financial analysis: a controller's guide. New Jersey: John Wiley & Sons.
Gibson, C. H. (2011). Financial reporting and analysis. USA: South-Western Cengage
Learning.
Godwin, N., and Alderman, C. (2012). Financial ACCT2. USA: Cengage Learning.
Higgins, R. C. (2012). Analysis for financial management. New York: McGraw-Hill/Irwin.
Jenter, D. and Lewellen, K. (2015). CEO preferences and acquisitions. The Journal of
Finance, 70(6), pp.2813-2852.
Kimmel, P. D., Weygandt, J. J., and Kieso, D. E. (2010). Financial accounting: tools for
business decision making. New Jersy: John Wiley & Sons.
Lee, A. C., Lee, J. C., and Lee, C. F. (2009). Financial analysis, planning and forecasting:
Theory and application. Singapore: World Scientific Publishing Co Inc.
Nikolai, L. A., Bazley, J. D., and Jones, J. P. (2009). Intermediate Accounting. USA: Cengage
Learning.
Parrino, R., Kidwell, D. S. and Bates, T. (2011).Fundamentals of corporate finance. USA: John
Wiley & Sons.
Accounting for managers 15
Saleem, Q. and Rehman, R.U. (2011). Impacts of liquidity ratios on
profitability. Interdisciplinary Journal of Research in Business, 1(7), pp.95-98.
Woolworths (2017). Annual Report. [Online]. Available at:
https://www.woolworthsgroup.com.au/icms_docs/188795_annual-report-2017.pdf
Saleem, Q. and Rehman, R.U. (2011). Impacts of liquidity ratios on
profitability. Interdisciplinary Journal of Research in Business, 1(7), pp.95-98.
Woolworths (2017). Annual Report. [Online]. Available at:
https://www.woolworthsgroup.com.au/icms_docs/188795_annual-report-2017.pdf
Accounting for managers 16
Appendices
Appendix 1
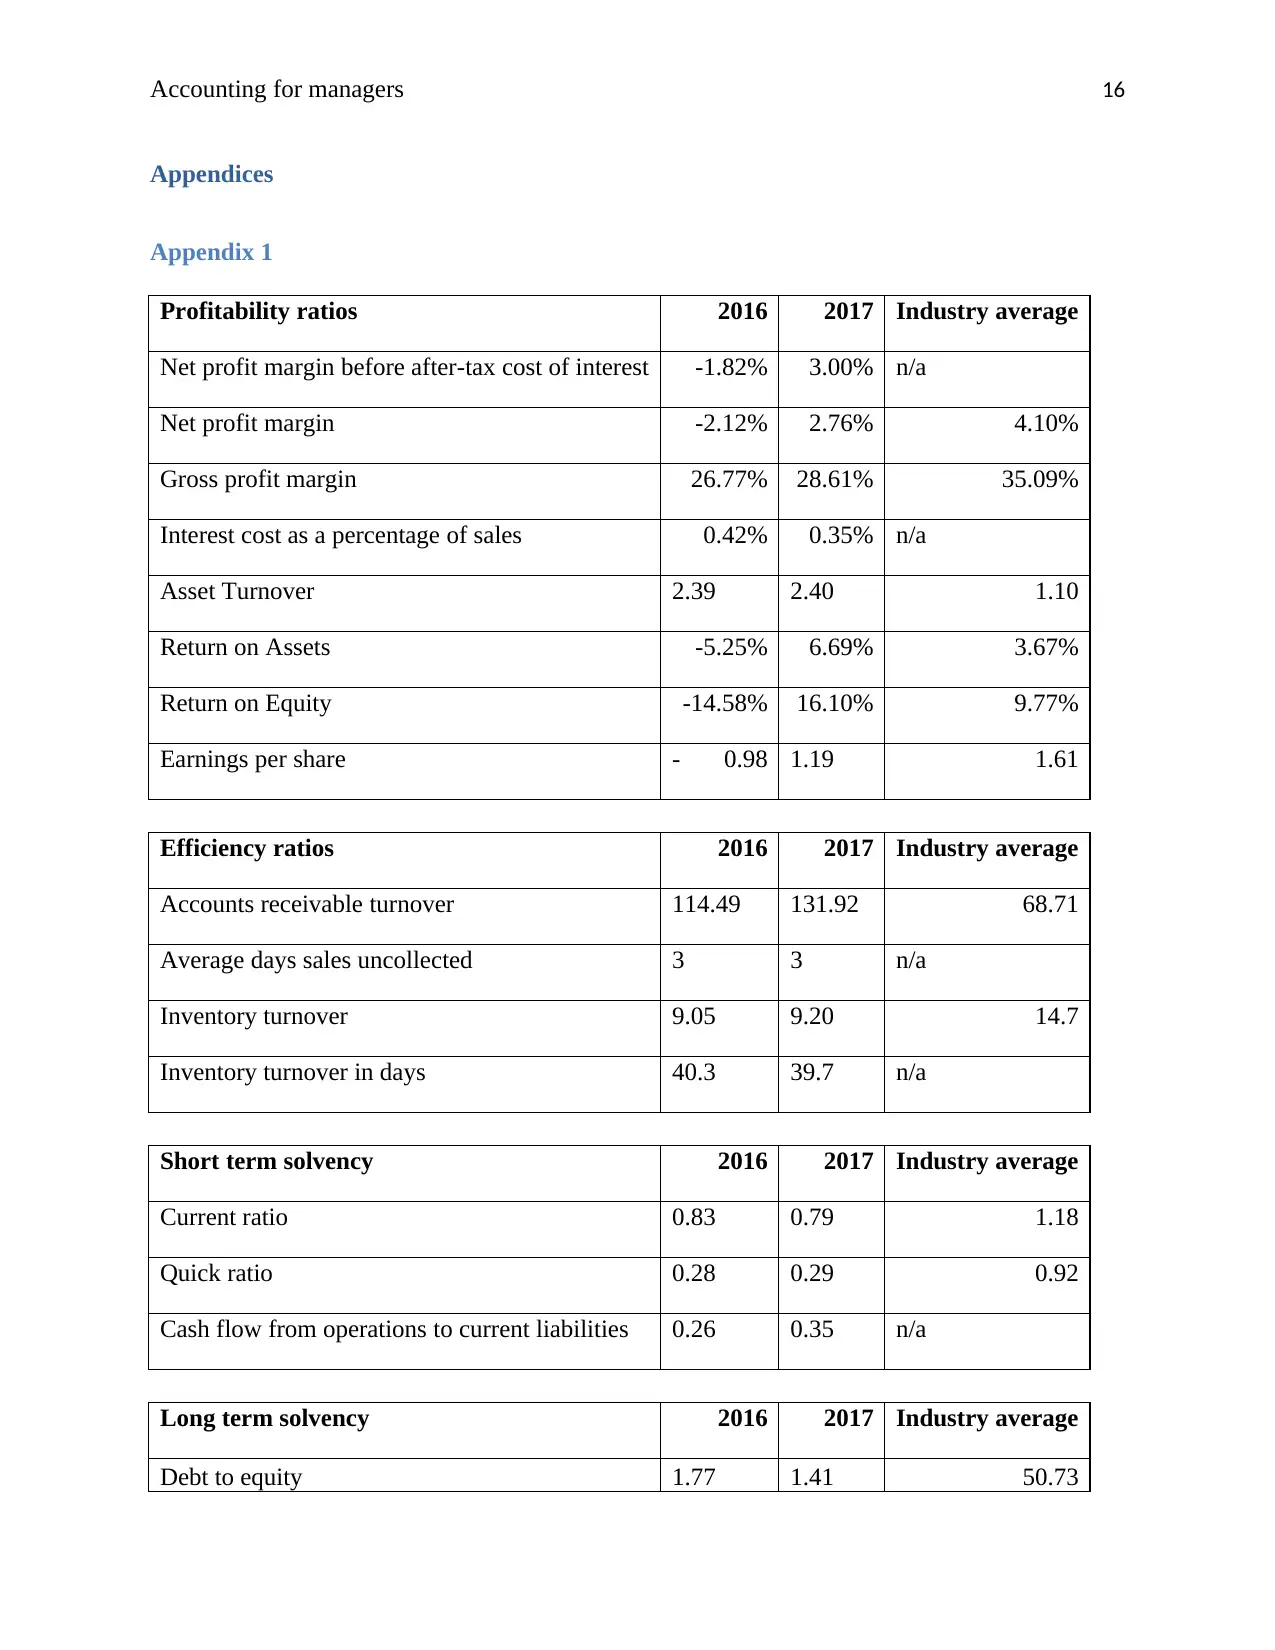
Profitability ratios 2016 2017 Industry average
Net profit margin before after-tax cost of interest -1.82% 3.00% n/a
Net profit margin -2.12% 2.76% 4.10%
Gross profit margin 26.77% 28.61% 35.09%
Interest cost as a percentage of sales 0.42% 0.35% n/a
Asset Turnover 2.39 2.40 1.10
Return on Assets -5.25% 6.69% 3.67%
Return on Equity -14.58% 16.10% 9.77%
Earnings per share - 0.98 1.19 1.61
Efficiency ratios 2016 2017 Industry average
Accounts receivable turnover 114.49 131.92 68.71
Average days sales uncollected 3 3 n/a
Inventory turnover 9.05 9.20 14.7
Inventory turnover in days 40.3 39.7 n/a
Short term solvency 2016 2017 Industry average
Current ratio 0.83 0.79 1.18
Quick ratio 0.28 0.29 0.92
Cash flow from operations to current liabilities 0.26 0.35 n/a
Long term solvency 2016 2017 Industry average
Debt to equity 1.77 1.41 50.73
Appendices
Appendix 1
Profitability ratios 2016 2017 Industry average
Net profit margin before after-tax cost of interest -1.82% 3.00% n/a
Net profit margin -2.12% 2.76% 4.10%
Gross profit margin 26.77% 28.61% 35.09%
Interest cost as a percentage of sales 0.42% 0.35% n/a
Asset Turnover 2.39 2.40 1.10
Return on Assets -5.25% 6.69% 3.67%
Return on Equity -14.58% 16.10% 9.77%
Earnings per share - 0.98 1.19 1.61
Efficiency ratios 2016 2017 Industry average
Accounts receivable turnover 114.49 131.92 68.71
Average days sales uncollected 3 3 n/a
Inventory turnover 9.05 9.20 14.7
Inventory turnover in days 40.3 39.7 n/a
Short term solvency 2016 2017 Industry average
Current ratio 0.83 0.79 1.18
Quick ratio 0.28 0.29 0.92
Cash flow from operations to current liabilities 0.26 0.35 n/a
Long term solvency 2016 2017 Industry average
Debt to equity 1.77 1.41 50.73
Secure Best Marks with AI Grader
Need help grading? Try our AI Grader for instant feedback on your assignments.
Accounting for managers 17
Debt ratio 0.64 0.58 n/a
Leverage ratio 2.77 2.41 n/a
Interest coverage ratio - 38.20
-
45.83 34.52
Cash flow from operations to total liabilities 0.16 0.23 n/a
Market based ratios 2016 2017 Industry average
Price earnings ratio - 21.04 21.29 21.58
Earnings Yield - 0.05 0.05 n/a
Dividend yield 3.75 3.31 1.58
Profitability ratios
Woolworths
Net profit margin before after-tax cost of interest 2016 2017
Net profit+after−tax interest cost (A) -1062.8 1669.8
Total revenue (B) 58,276.0 55,669.0
(A/B) -1.82% 3.00%
Woolworths
Net profit margin 2016 2017
Net profit (A) -1235.0 1534.0
Total revenue (B) 58,276.0 55,669.0
NPR (A/B) -2.12% 2.76%
Accounting for managers 18
Woolworths
Gross profit margin 2016 2017
Gross profit (A) 15599.0 15929.0
Total revenue (B) 58,276.0 55,669.0
GPR (A/B) 26.77% 28.61%
Woolworths
Interest cost as a percentage of sales 2016 2017
Interest expense (A) 246.0 194.0
Total revenue (B) 58,276.0 55,669.0
IC(A/B) 0.42% 0.35%
Woolworths
Asset Turnover 2016 2017
Sales (A) 58276.0 55669.0
Average Total Assets (B) 24,419.5 23,209.0
ATR (A/B) 2.39 2.40
Woolworths
Return on Assets 2016 2017
Net profit (A) -1235.0 1534.0
Total Assets (B) 23,502.0 22,916.0
ROA (A/B) -5.25% 6.69%
Woolworths
Gross profit margin 2016 2017
Gross profit (A) 15599.0 15929.0
Total revenue (B) 58,276.0 55,669.0
GPR (A/B) 26.77% 28.61%
Woolworths
Interest cost as a percentage of sales 2016 2017
Interest expense (A) 246.0 194.0
Total revenue (B) 58,276.0 55,669.0
IC(A/B) 0.42% 0.35%
Woolworths
Asset Turnover 2016 2017
Sales (A) 58276.0 55669.0
Average Total Assets (B) 24,419.5 23,209.0
ATR (A/B) 2.39 2.40
Woolworths
Return on Assets 2016 2017
Net profit (A) -1235.0 1534.0
Total Assets (B) 23,502.0 22,916.0
ROA (A/B) -5.25% 6.69%
Accounting for managers 19
Woolworths
Return on Equity 2016 2017
Net income available to shareholders (A) -1235.0 1534.0
Shareholder's equity (B) 8,471.0 9,526.0
ROE (A/B) -14.58% 16.10%
Woolworths
Earnings per share 2016 2017
Net income available to shareholders (A) -1235.0 1534.0
weighted average number of ordinary share issued (B) 1,264.0 1,288.0
EPS (A/B) - 0.98 1.19
Efficiency ratios
Woolworths
Accounts receivable turnover 2016 2017
Net sales (A) 58276.0 55669.0
Average accounts receivable (B) 509.0 422.0
DTR (A/B) 114.49 131.92
Woolworths
Average days sales uncollected 2016 2017
Days in year (A) 365.0 365.0
Accounts receivable turnover (B) 114.5 131.9
Woolworths
Return on Equity 2016 2017
Net income available to shareholders (A) -1235.0 1534.0
Shareholder's equity (B) 8,471.0 9,526.0
ROE (A/B) -14.58% 16.10%
Woolworths
Earnings per share 2016 2017
Net income available to shareholders (A) -1235.0 1534.0
weighted average number of ordinary share issued (B) 1,264.0 1,288.0
EPS (A/B) - 0.98 1.19
Efficiency ratios
Woolworths
Accounts receivable turnover 2016 2017
Net sales (A) 58276.0 55669.0
Average accounts receivable (B) 509.0 422.0
DTR (A/B) 114.49 131.92
Woolworths
Average days sales uncollected 2016 2017
Days in year (A) 365.0 365.0
Accounts receivable turnover (B) 114.5 131.9
Paraphrase This Document
Need a fresh take? Get an instant paraphrase of this document with our AI Paraphraser
Accounting for managers 20
Average days (A/B) 3 3
Woolworths
Inventory turnover 2016 2017
Cost of goods sold (A) 42677.0 39740.0
Average inventory (B) 4,715.0 4,319.0
ITR (A/B) 9.05 9.20
Woolworths
Inventory turnover in days 2016 2017
Days in year (A) 365.0 365.0
Inventory turnover (B) 9.05 9.20
Average days (A/B) 40.3 39.7
Short term solvency
Woolworths
Current ratio 2016 2017
Current assets (A) 7427.0 6994.0
Current liabilities (B) 8,993.0 8,824.0
CR (A/B) 0.83 0.79
Woolworths
Quick ratio 2016 2017
Quick Assets (A) 2539.0 2580.0
Accounting for managers 21
Current Liabilities (B) 8,993.0 8,824.0
QR (A/B) 0.28 0.29
Woolworths
Cash flow from operations to current liabilities 2016 2017
Operating cash flows (A) 2357.5 3122.0
Current Liabilities (B) 8,993.0 8,824.0
CFOCL (A/B) 0.26 0.35
Long term solvency
Woolworths
Debt to equity 2016 2017
Total Liabilities (A) 15032.0 13390.0
Shareholder's equity (B) 8471.0 9526.0
D/E (A/B) 1.77 1.41
Woolworths
Debt ratio 2016 2017
Total Liabilities (A) 15032.0 13390.0
Total Assets (B) 23,502.0 22,916.0
DR (A/B) 0.64 0.58
Current Liabilities (B) 8,993.0 8,824.0
QR (A/B) 0.28 0.29
Woolworths
Cash flow from operations to current liabilities 2016 2017
Operating cash flows (A) 2357.5 3122.0
Current Liabilities (B) 8,993.0 8,824.0
CFOCL (A/B) 0.26 0.35
Long term solvency
Woolworths
Debt to equity 2016 2017
Total Liabilities (A) 15032.0 13390.0
Shareholder's equity (B) 8471.0 9526.0
D/E (A/B) 1.77 1.41
Woolworths
Debt ratio 2016 2017
Total Liabilities (A) 15032.0 13390.0
Total Assets (B) 23,502.0 22,916.0
DR (A/B) 0.64 0.58
Accounting for managers 22
Woolworths
Leverage ratio 2016 2017
Total assets (A) 23502.0 22916.0
Shareholder's equity (B) 8,471.0 9,526.0
LR (A/B) 2.77 2.41
Woolworths
Interest coverage ratio 2016 2017
EBIT (A) -9398.0 -8891.0
Interest expense (B) 246.0 194.0
ICR (A/B) - 38.20 - 45.83
Woolworths
Cash flow from operations to total liabilities 2016 2017
Operating cash flows (A) 2357.5 3122.0
Total Liabilities (B) 15,032.0 13,390.0
CFOTL (A/B) 0.16 0.23
Market based ratios
Woolworths
Price earnings ratio 2016 2017
Market price (A) 20.6 25.4
EPS (B) -0.98 1.19
P/E (A/B) - 21.04 21.29
Woolworths
Leverage ratio 2016 2017
Total assets (A) 23502.0 22916.0
Shareholder's equity (B) 8,471.0 9,526.0
LR (A/B) 2.77 2.41
Woolworths
Interest coverage ratio 2016 2017
EBIT (A) -9398.0 -8891.0
Interest expense (B) 246.0 194.0
ICR (A/B) - 38.20 - 45.83
Woolworths
Cash flow from operations to total liabilities 2016 2017
Operating cash flows (A) 2357.5 3122.0
Total Liabilities (B) 15,032.0 13,390.0
CFOTL (A/B) 0.16 0.23
Market based ratios
Woolworths
Price earnings ratio 2016 2017
Market price (A) 20.6 25.4
EPS (B) -0.98 1.19
P/E (A/B) - 21.04 21.29
Secure Best Marks with AI Grader
Need help grading? Try our AI Grader for instant feedback on your assignments.
Accounting for managers 23
Woolworths
Earnings Yield 2016 2017
EPS (A) -1.0 1.19
Market price (B) 20.6 25.4
EY (A/B) - 0.05 0.05
Woolworths
Dividend yield 2016 2017
DPS (A) 77.0 84.0
MPS (B) 20.6 25.4
DY (A/B) 3.75 3.31
Appendix 2
WOOLWORTHS GROUP LTD (WOW) BALANCE
SHEET
Fiscal year ends in June. AUD in millions except per
share data.
2016-
06
%
change
2017-
06
%
change
Assets
Current assets
Cash
Cash and cash equivalents 948 4% 909 4%
Total cash 948 4% 909 4%
Receivables 434 2% 410 2%
Woolworths
Earnings Yield 2016 2017
EPS (A) -1.0 1.19
Market price (B) 20.6 25.4
EY (A/B) - 0.05 0.05
Woolworths
Dividend yield 2016 2017
DPS (A) 77.0 84.0
MPS (B) 20.6 25.4
DY (A/B) 3.75 3.31
Appendix 2
WOOLWORTHS GROUP LTD (WOW) BALANCE
SHEET
Fiscal year ends in June. AUD in millions except per
share data.
2016-
06
%
change
2017-
06
%
change
Assets
Current assets
Cash
Cash and cash equivalents 948 4% 909 4%
Total cash 948 4% 909 4%
Receivables 434 2% 410 2%
Accounting for managers 24
Inventories 4558 19% 4080 18%
Prepaid expenses 330 1% 334 1%
Other current assets 1156 5% 1260 5%
Total current assets 7427 32% 6994 31%
Non-current assets
Property, plant and equipment
Land 1436 6% 1435 6%
Fixtures and equipment 13937 59% 14015 61%
Other properties 3628 15% 3654 16%
Property and equipment, at cost 19000 81% 19105 83%
Accumulated Depreciation -10738 -46% -10667 -47%
Property, plant and equipment, net 8263 35% 8438 37%
Equity and other investments 108 0% 118 1%
Goodwill 3637 15% 4216 18%
Intangible assets 2341 10% 2316 10%
Deferred income taxes 1110 5% 372 2%
Other long-term assets 616 3% 461 2%
Total non-current assets 16075 68% 15922 69%
Total assets 23502 100% 22916 100%
Liabilities and stockholders' equity
Liabilities
Current liabilities
Short-term debt 490 2% 253 1%
Accounting for managers 25
Capital leases 0 0% 0 0%
Accounts payable 4809 19% 5068 22%
Deferred income taxes 40 0% 81 0%
Other current liabilities 3653 14% 3422 15%
Total current liabilities 8993 35% 8824 38%
Non-current liabilities
Long-term debt 3868 15% 2775 12%
Capital leases 3 0% 2 0%
Pensions and other benefits 165 1% 172 1%
Minority interest 311 1% 350 1%
Other long-term liabilities 1691 7% 1266 5%
Total non-current liabilities 6039 24% 4566 19%
Total liabilities 15032 59% 13390 57%
Stockholders' equity
Common stock 5252 21% 5615 24%
Other Equity -69 0% -42 0%
Retained earnings 3124 12% 3797 16%
Accumulated other comprehensive income 163 1% 156 1%
Total stockholders' equity 8471 33% 9526 41%
Total liabilities and stockholders' equity 25337 100% 23502 100%
WOOLWORTHS GROUP LTD (WOW) INCOME
Paraphrase This Document
Need a fresh take? Get an instant paraphrase of this document with our AI Paraphraser
Accounting for managers 26
STATEMENT
Fiscal year ends in June. AUD in millions except per
share data.
2016-
06
%
change
2017-
06
%
change
Revenue 58276 100% 55669 100%
Cost of revenue 42677 73% 39740 71%
Gross profit 15599 27% 15929 29%
Operating expenses
Sales, General and administrative 12964 22% 13134 24%
Other operating expenses 12033 21% 11686 21%
Total operating expenses 24997 43% 24820 45%
Operating income -9398 -16% -8891 -16%
Interest Expense 246 0% 194 0%
Other income (expense) 11004 19% 11217 20%
Income before income taxes 1360 2% 2132 4%
Provision for income taxes 520 1% 650 1%
Minority interest -1113 -2% 60 0%
Other income -1113 -2% 60 0%
Net income from continuing operations 840 1% 1482 3%
Net income from discontinuing ops -3188 -5% 111 0%
Other 1113 2% -60 0%
Net income -1235 -2% 1534 3%
Net income available to common shareholders -1235 -2% 1534 3%
Earnings per share
Accounting for managers 27
Basic -0.98 1.19
Diluted -0.98 1.19
Weighted average shares outstanding
Basic 1264 1284
Diluted 1264 1288
EBITDA 2628 3340
Basic -0.98 1.19
Diluted -0.98 1.19
Weighted average shares outstanding
Basic 1264 1284
Diluted 1264 1288
EBITDA 2628 3340
1 out of 27
Related Documents


Your All-in-One AI-Powered Toolkit for Academic Success.
+13062052269
info@desklib.com
Available 24*7 on WhatsApp / Email
![[object Object]](/_next/static/media/star-bottom.7253800d.svg)
Unlock your academic potential
© 2024 | Zucol Services PVT LTD | All rights reserved.