Financial Analysis of Woolworths Company: ACC306 Assignment Report
VerifiedAdded on 2023/06/09
|16
|4803
|247
Report
AI Summary
This report provides a comprehensive financial analysis of Woolworths, an Australian supermarket company, evaluating its performance over three years. It utilizes ratio analysis to assess profitability, efficiency, liquidity, and capital structure, offering insights into the company's financial health. The report examines key financial metrics, including profitability ratios (net profit margin, gross profit margin, return on equity), efficiency ratios (assets turnover, receivable and payable turnover), liquidity ratios (current ratio, quick ratio), and capital structure ratios (debt to equity ratio, time interest earned). It also evaluates long-term solvency, financial leverage, and the quality of financial statements. The analysis highlights Woolworths' financial leverage, profitability trends, and liquidity position, providing a detailed assessment of its financial performance and sustainability. The report also addresses the company's capital structure and its impact on overall return on capital employed, offering a thorough examination of Woolworths' financial standing within the Australian market.
Woolworths Company
Financial Management
Financial analysis
Name of the Author
[Pick the date]
Financial Management
Financial analysis
Name of the Author
[Pick the date]
Paraphrase This Document
Need a fresh take? Get an instant paraphrase of this document with our AI Paraphraser
Executive Summary
With the changes in time and ramified economic condition, each and every
corporation needs to take effective financial decision to operate its financial and business
operations effectively. There are several financial tools such as ratio analysis, capital
budgeting tool, du pont analysis and top down analysis which could be used to evaluate the
financial performance of company. In this report, Woolworths Company has been considered
to analysis the financial performance and how company has performed financially in the
Australian economic market. This company has kept the high financial leverage with the
view to increase its overall return on capital employed. It is analyzed that company has
maintained high financial leverage by increasing its debt portion but at the same time if
company will have low amount of profitability then it will have to face business
sustainability. Company needs to maintain its EBIT more and above the interest payment to
run its business in long run. The liquidity position of company is also stable since last three
year which reflects that company has not been aggressive in deploying more capital in its
operating activities.
Table of Contents
Executive Summary...............................................................................................................................1
INTRODUCTION.................................................................................................................................3
Description of Woolworths Company................................................................................................3
Task-1....................................................................................................................................................3
Assess the company’s performance over the last three years..............................................................3
Assessment of the financial position of company..............................................................................5
PROFITABILITY RATIOS..............................................................................................................5
EFFECIENCY RATIO OR ACTIVITY RATIO...............................................................................5
LIQUIDITY RATIOS.......................................................................................................................6
CAPITAL STRUCTURE RATIOS...................................................................................................6
Task-2....................................................................................................................................................7
Long-term solvency of the company over the last three years..............................................................7
Task-3....................................................................................................................................................9
Assess the liquidity position of the company as at the latest financial year......................................9
Liquidity position of Woolworth company........................................................................................9
Task-4..................................................................................................................................................11
Discuss the quality of financial statement...........................................................................................11
Conclusion...........................................................................................................................................12
References...........................................................................................................................................13
⊘ This is a preview!⊘
Do you want full access?
Subscribe today to unlock all pages.
Trusted by 1+ million students worldwide
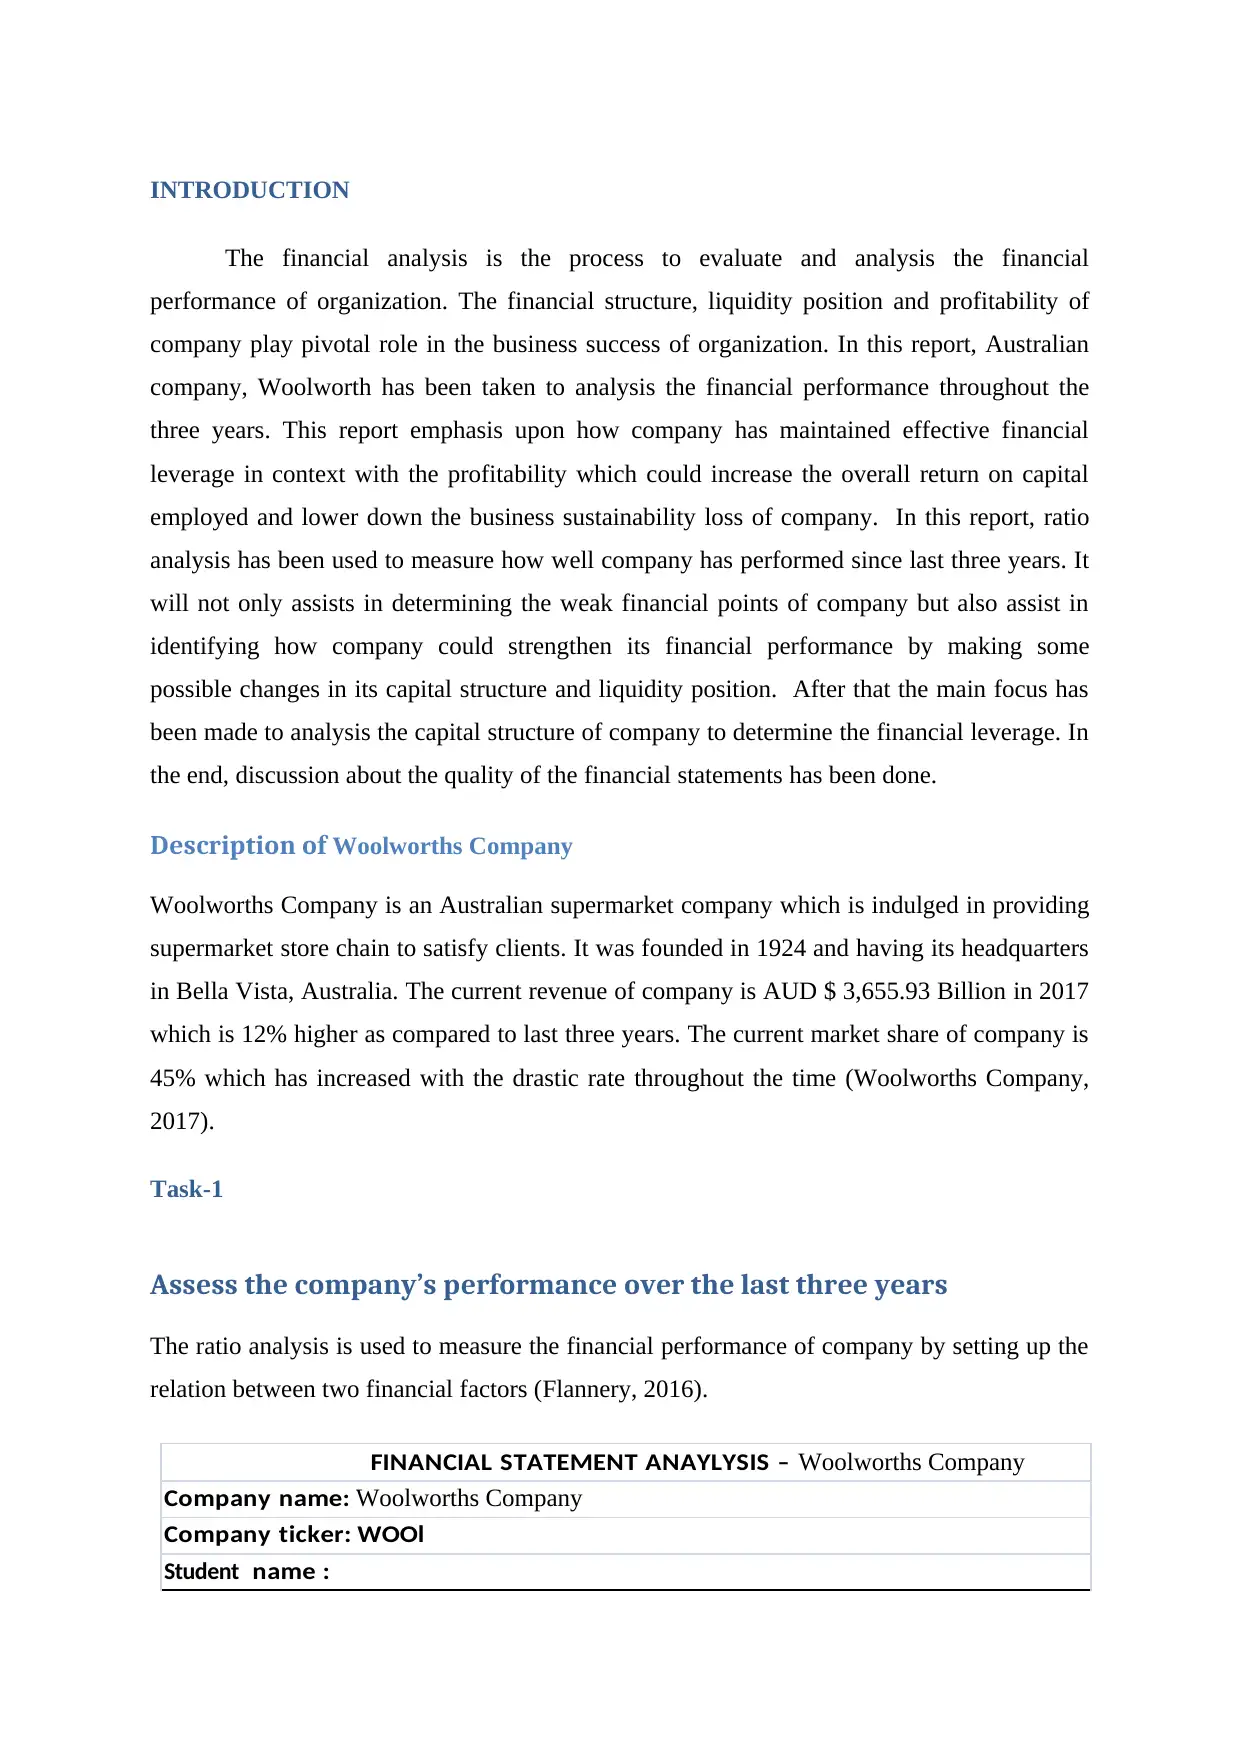
INTRODUCTION
The financial analysis is the process to evaluate and analysis the financial
performance of organization. The financial structure, liquidity position and profitability of
company play pivotal role in the business success of organization. In this report, Australian
company, Woolworth has been taken to analysis the financial performance throughout the
three years. This report emphasis upon how company has maintained effective financial
leverage in context with the profitability which could increase the overall return on capital
employed and lower down the business sustainability loss of company. In this report, ratio
analysis has been used to measure how well company has performed since last three years. It
will not only assists in determining the weak financial points of company but also assist in
identifying how company could strengthen its financial performance by making some
possible changes in its capital structure and liquidity position. After that the main focus has
been made to analysis the capital structure of company to determine the financial leverage. In
the end, discussion about the quality of the financial statements has been done.
Description of Woolworths Company
Woolworths Company is an Australian supermarket company which is indulged in providing
supermarket store chain to satisfy clients. It was founded in 1924 and having its headquarters
in Bella Vista, Australia. The current revenue of company is AUD $ 3,655.93 Billion in 2017
which is 12% higher as compared to last three years. The current market share of company is
45% which has increased with the drastic rate throughout the time (Woolworths Company,
2017).
Task-1
Assess the company’s performance over the last three years
The ratio analysis is used to measure the financial performance of company by setting up the
relation between two financial factors (Flannery, 2016).
FINANCIAL STATEMENT ANAYLYSIS – Woolworths Company
Company name: Woolworths Company
Company ticker: WOOl
Student name :
Paraphrase This Document
Need a fresh take? Get an instant paraphrase of this document with our AI Paraphraser
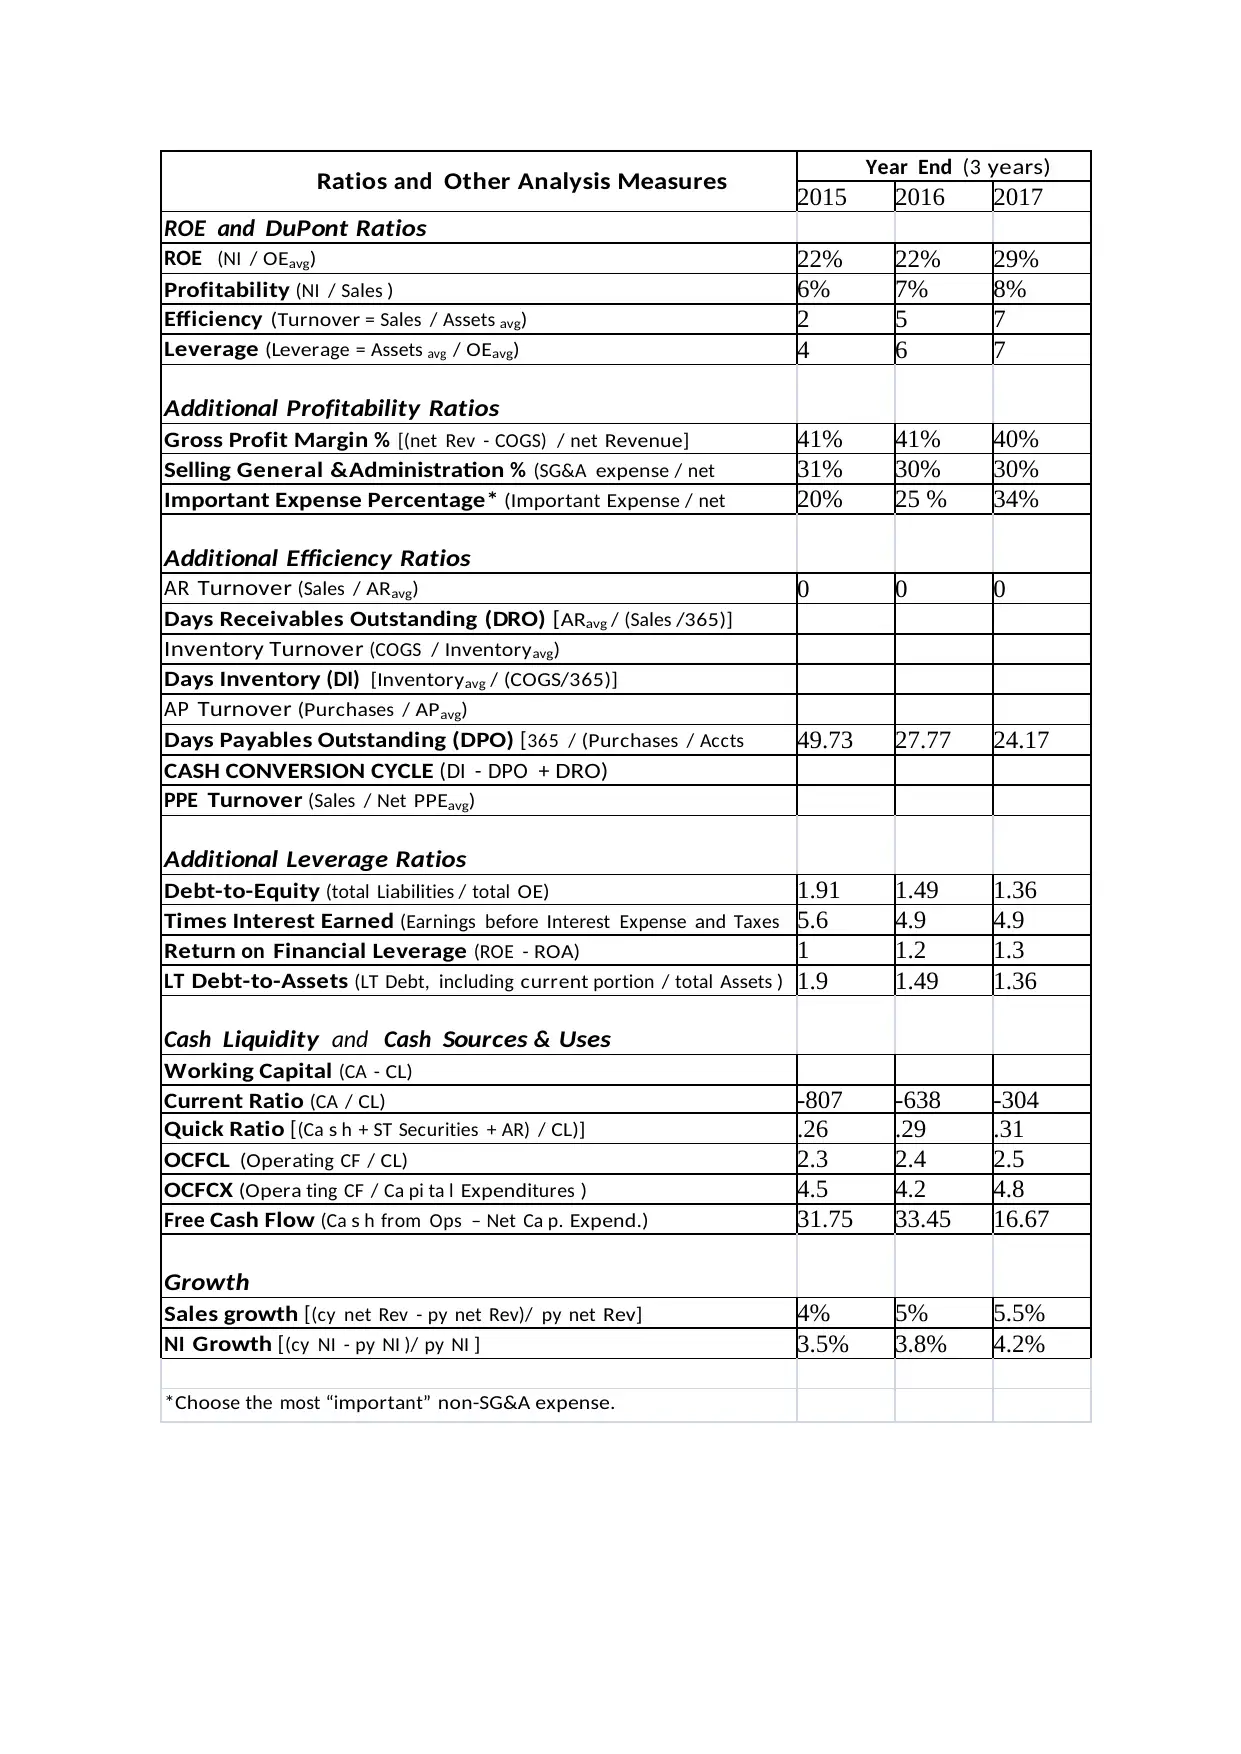
Ratios and Other Analysis Measures Year End (3 y ea r s)
2015 2016 2017
ROE and DuPont Ratios
ROE (NI / OE avg ) 22% 22% 29%
Profitability (NI / Sa les ) 6% 7% 8%
Efficiency (Turnover = Sa les / Assets avg ) 2 5 7
Leverage (Leverage = Assets avg / OE avg ) 4 6 7
Additional Profitability Ratios
Gross Profit Margin % [(net Rev - COGS) / net Revenue] 41% 41% 40%
Selling General &Administration % (SG&A expense / net
Revenue)
31% 30% 30%
Important Expense Percentage* (Important Expense / net
Revenue)
20% 25 % 34%
Additional Efficiency Ratios
AR Turnover (Sa les / AR avg ) 0 0 0
Days Receivables Outstanding (DRO) [ AR avg / (Sa les /365)]
Inventory Turnover (COGS / Inventory avg )
Days Inventory (DI) [Inventoryavg / (COGS/365)]
AP Turnover (Purchases / AP avg )
Days Payables Outstanding (DPO) [365 / (Purchases / Accts
Payabl e avg )]
49.73 27.77 24.17
CASH CONVERSION CYCLE (DI - DPO + DR O)
PPE Turnover (Sa les / Net PPE avg )
Additional Leverage Ratios
Debt-to-Equity (total Li abi lities / total OE) 1.91 1.49 1.36
Times Interest Earned (Earnings before Interest Expense and Taxes
/ Interest Exp)
5.6 4.9 4.9
Return on Financial Leverage (ROE - ROA) 1 1.2 1.3
LT Debt-to-Assets (LT Debt, including current portion / total Assets ) 1.9 1.49 1.36
Cash Liquidity and Cash Sources & Uses
Working Capital (CA - CL)
Current Ratio (CA / CL) -807 -638 -304
Quick Ratio [(Ca s h + ST Securities + AR) / CL)] .26 .29 .31
OCFCL (Operating CF / CL) 2.3 2.4 2.5
OCFCX (Opera ting CF / Ca pi ta l Expenditures ) 4.5 4.2 4.8
Free Cash Flow (Ca s h from Ops – Net Ca p. Expend.) 31.75 33.45 16.67
Growth
Sales growth [(cy net Rev - py net Rev)/ py net Rev] 4% 5% 5.5%
NI Growth [(cy NI - py NI )/ py NI ] 3.5% 3.8% 4.2%
*Choose the most “i mportant” non-SG&A expense.
Assessment of the financial position of company
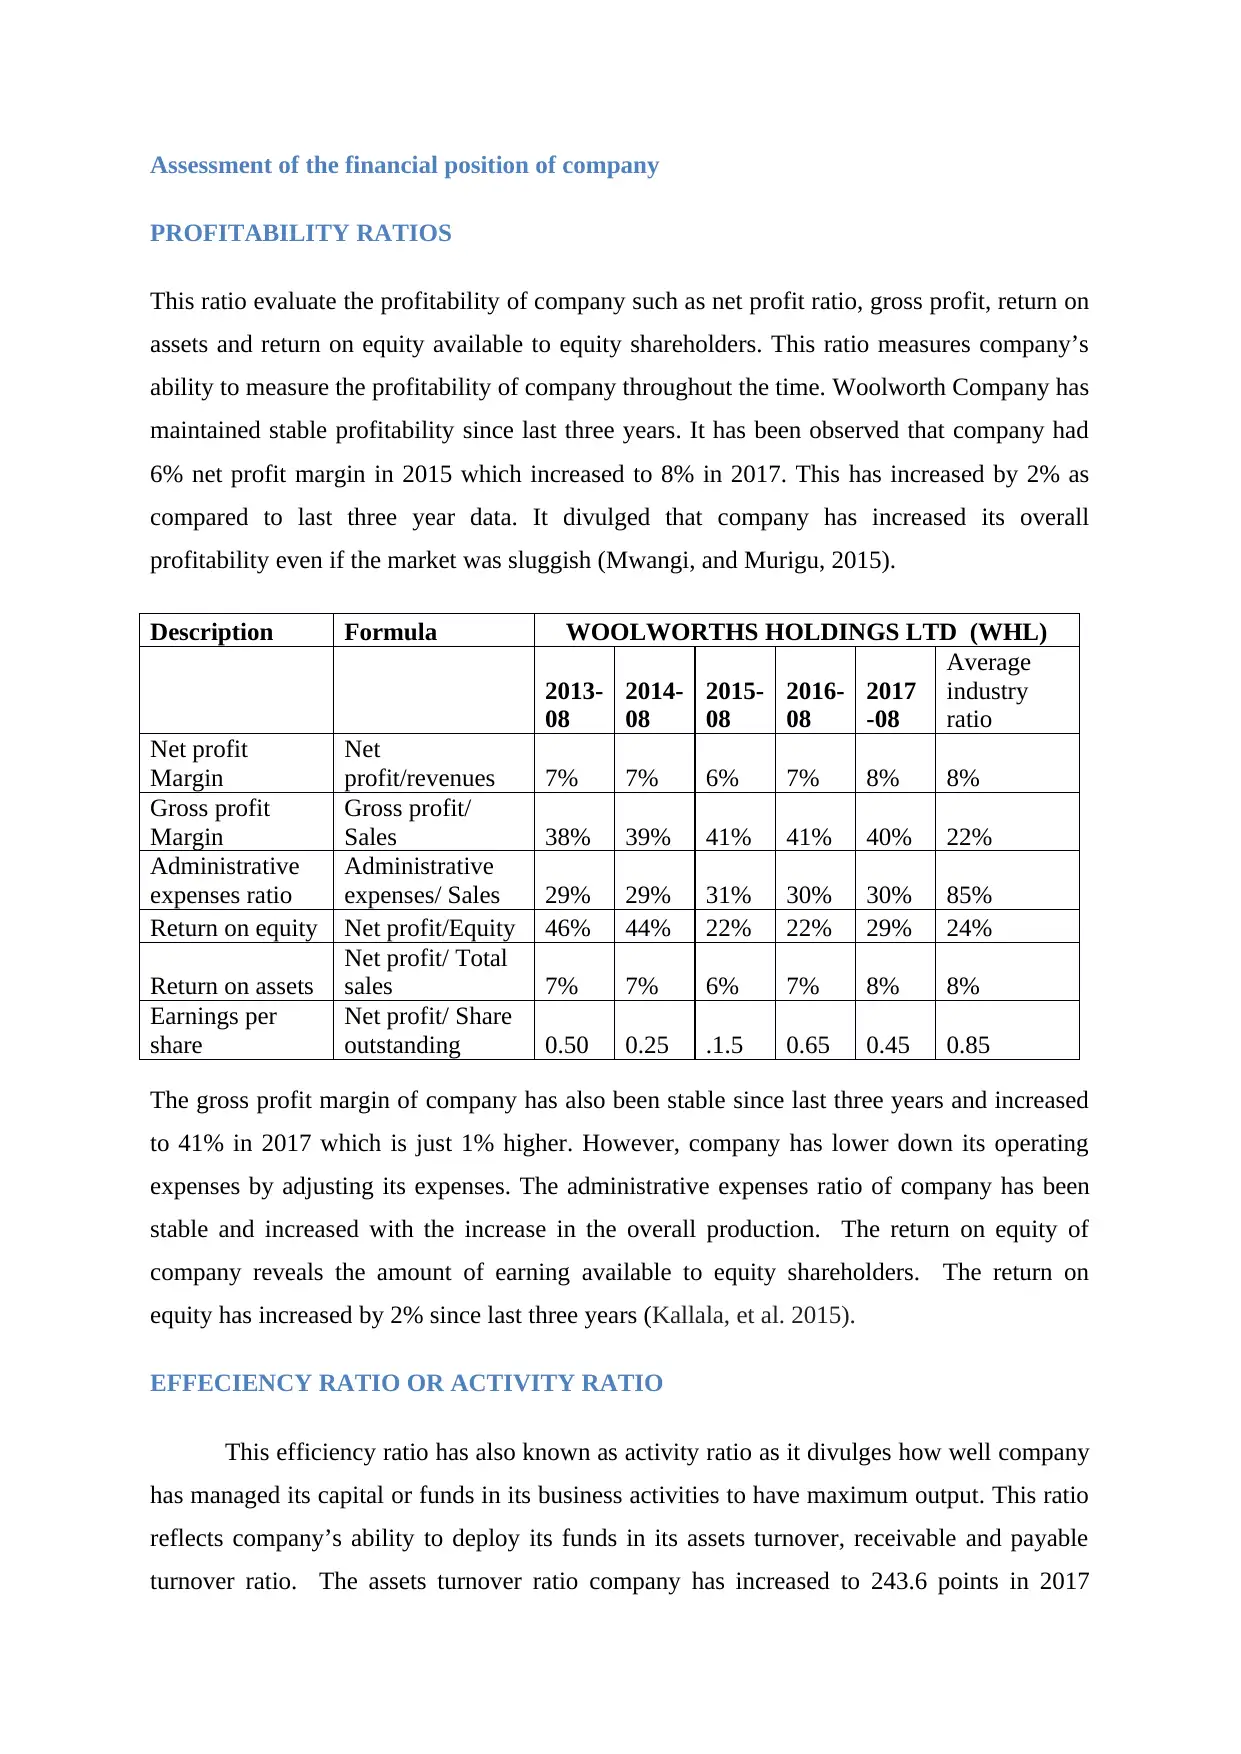
PROFITABILITY RATIOS
This ratio evaluate the profitability of company such as net profit ratio, gross profit, return on
assets and return on equity available to equity shareholders. This ratio measures company’s
ability to measure the profitability of company throughout the time. Woolworth Company has
maintained stable profitability since last three years. It has been observed that company had
6% net profit margin in 2015 which increased to 8% in 2017. This has increased by 2% as
compared to last three year data. It divulged that company has increased its overall
profitability even if the market was sluggish (Mwangi, and Murigu, 2015).
Description Formula WOOLWORTHS HOLDINGS LTD (WHL)
2013-
08
2014-
08
2015-
08
2016-
08
2017
-08
Average
industry
ratio
Net profit
Margin
Net
profit/revenues 7% 7% 6% 7% 8% 8%
Gross profit
Margin
Gross profit/
Sales 38% 39% 41% 41% 40% 22%
Administrative
expenses ratio
Administrative
expenses/ Sales 29% 29% 31% 30% 30% 85%
Return on equity Net profit/Equity 46% 44% 22% 22% 29% 24%
Return on assets
Net profit/ Total
sales 7% 7% 6% 7% 8% 8%
Earnings per
share
Net profit/ Share
outstanding 0.50 0.25 .1.5 0.65 0.45 0.85
The gross profit margin of company has also been stable since last three years and increased
to 41% in 2017 which is just 1% higher. However, company has lower down its operating
expenses by adjusting its expenses. The administrative expenses ratio of company has been
stable and increased with the increase in the overall production. The return on equity of
company reveals the amount of earning available to equity shareholders. The return on
equity has increased by 2% since last three years (Kallala, et al. 2015).
EFFECIENCY RATIO OR ACTIVITY RATIO
This efficiency ratio has also known as activity ratio as it divulges how well company
has managed its capital or funds in its business activities to have maximum output. This ratio
reflects company’s ability to deploy its funds in its assets turnover, receivable and payable
turnover ratio. The assets turnover ratio company has increased to 243.6 points in 2017
⊘ This is a preview!⊘
Do you want full access?
Subscribe today to unlock all pages.
Trusted by 1+ million students worldwide
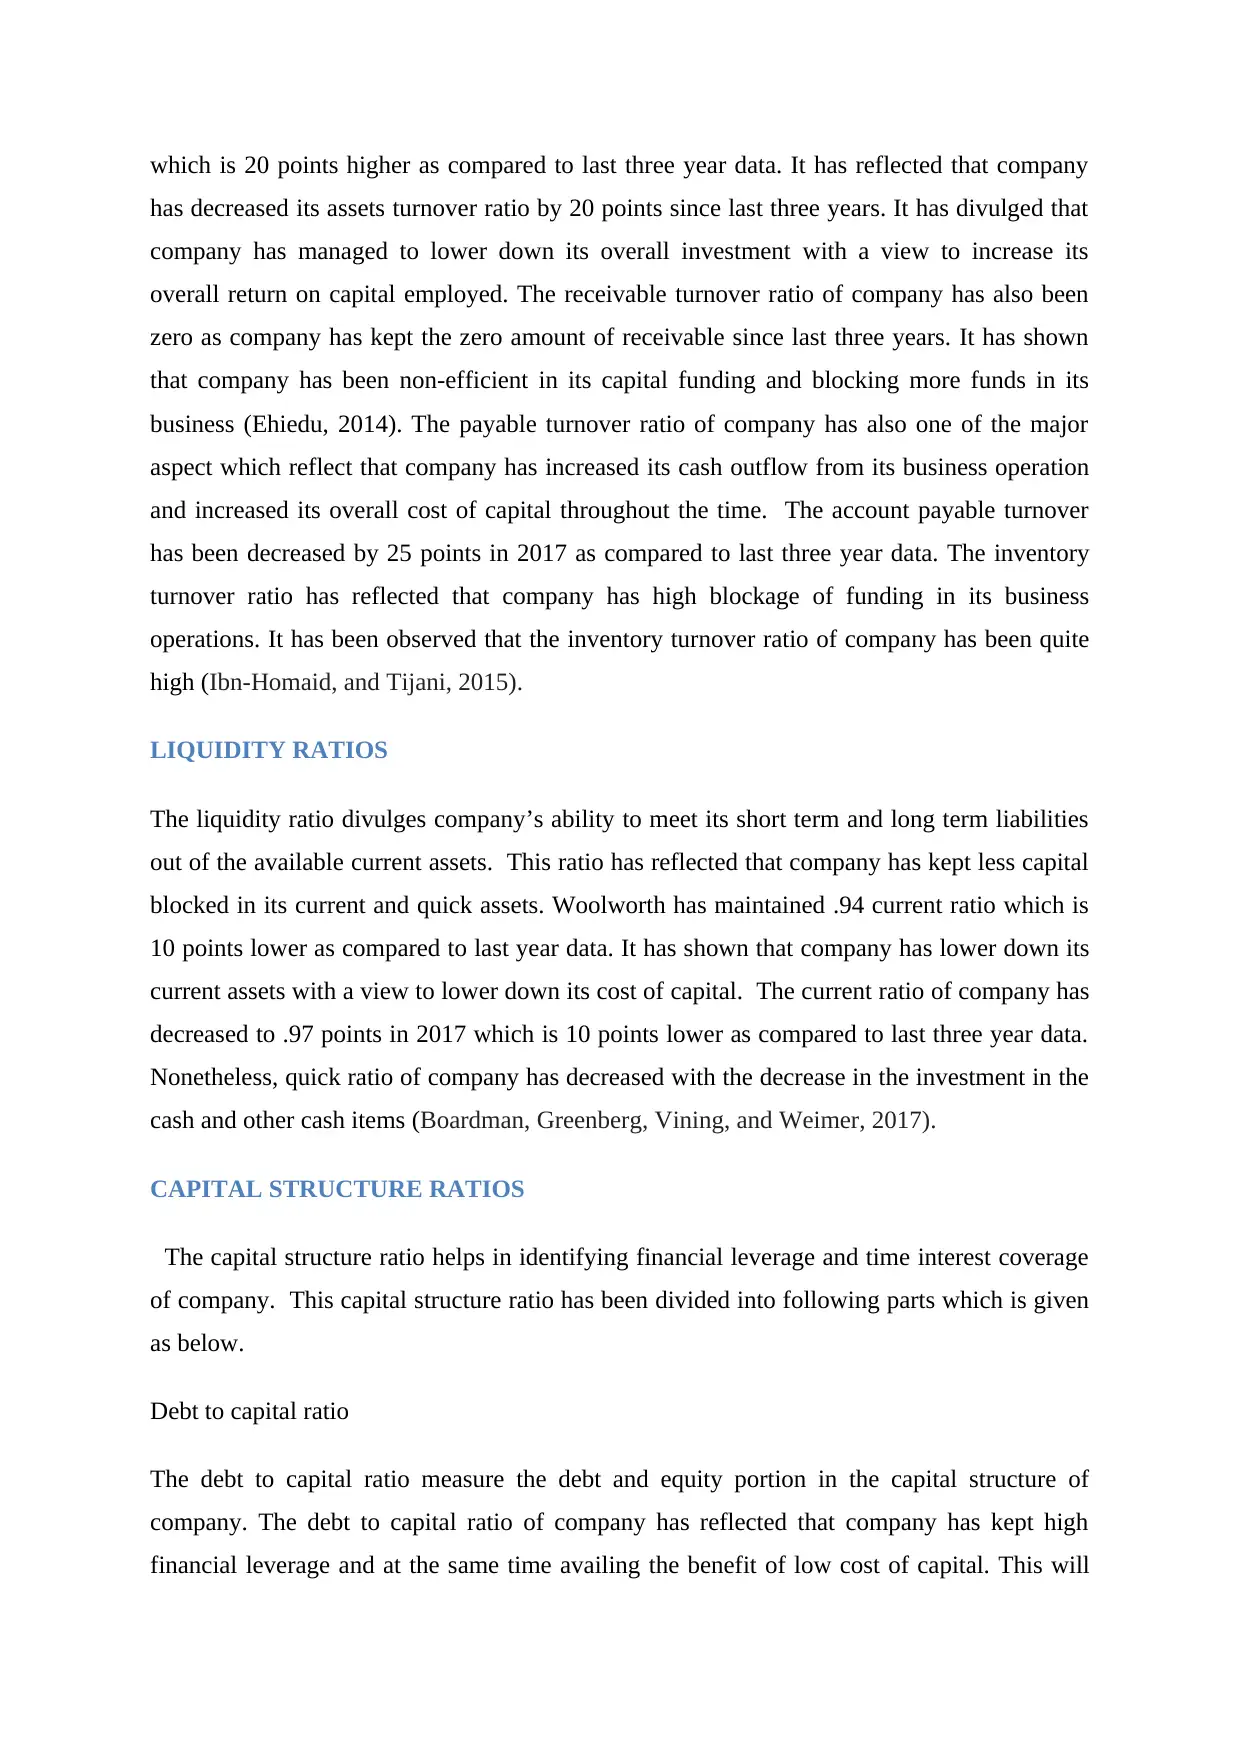
which is 20 points higher as compared to last three year data. It has reflected that company
has decreased its assets turnover ratio by 20 points since last three years. It has divulged that
company has managed to lower down its overall investment with a view to increase its
overall return on capital employed. The receivable turnover ratio of company has also been
zero as company has kept the zero amount of receivable since last three years. It has shown
that company has been non-efficient in its capital funding and blocking more funds in its
business (Ehiedu, 2014). The payable turnover ratio of company has also one of the major
aspect which reflect that company has increased its cash outflow from its business operation
and increased its overall cost of capital throughout the time. The account payable turnover
has been decreased by 25 points in 2017 as compared to last three year data. The inventory
turnover ratio has reflected that company has high blockage of funding in its business
operations. It has been observed that the inventory turnover ratio of company has been quite
high (Ibn-Homaid, and Tijani, 2015).
LIQUIDITY RATIOS
The liquidity ratio divulges company’s ability to meet its short term and long term liabilities
out of the available current assets. This ratio has reflected that company has kept less capital
blocked in its current and quick assets. Woolworth has maintained .94 current ratio which is
10 points lower as compared to last year data. It has shown that company has lower down its
current assets with a view to lower down its cost of capital. The current ratio of company has
decreased to .97 points in 2017 which is 10 points lower as compared to last three year data.
Nonetheless, quick ratio of company has decreased with the decrease in the investment in the
cash and other cash items (Boardman, Greenberg, Vining, and Weimer, 2017).
CAPITAL STRUCTURE RATIOS
The capital structure ratio helps in identifying financial leverage and time interest coverage
of company. This capital structure ratio has been divided into following parts which is given
as below.
Debt to capital ratio
The debt to capital ratio measure the debt and equity portion in the capital structure of
company. The debt to capital ratio of company has reflected that company has kept high
financial leverage and at the same time availing the benefit of low cost of capital. This will
Paraphrase This Document
Need a fresh take? Get an instant paraphrase of this document with our AI Paraphraser
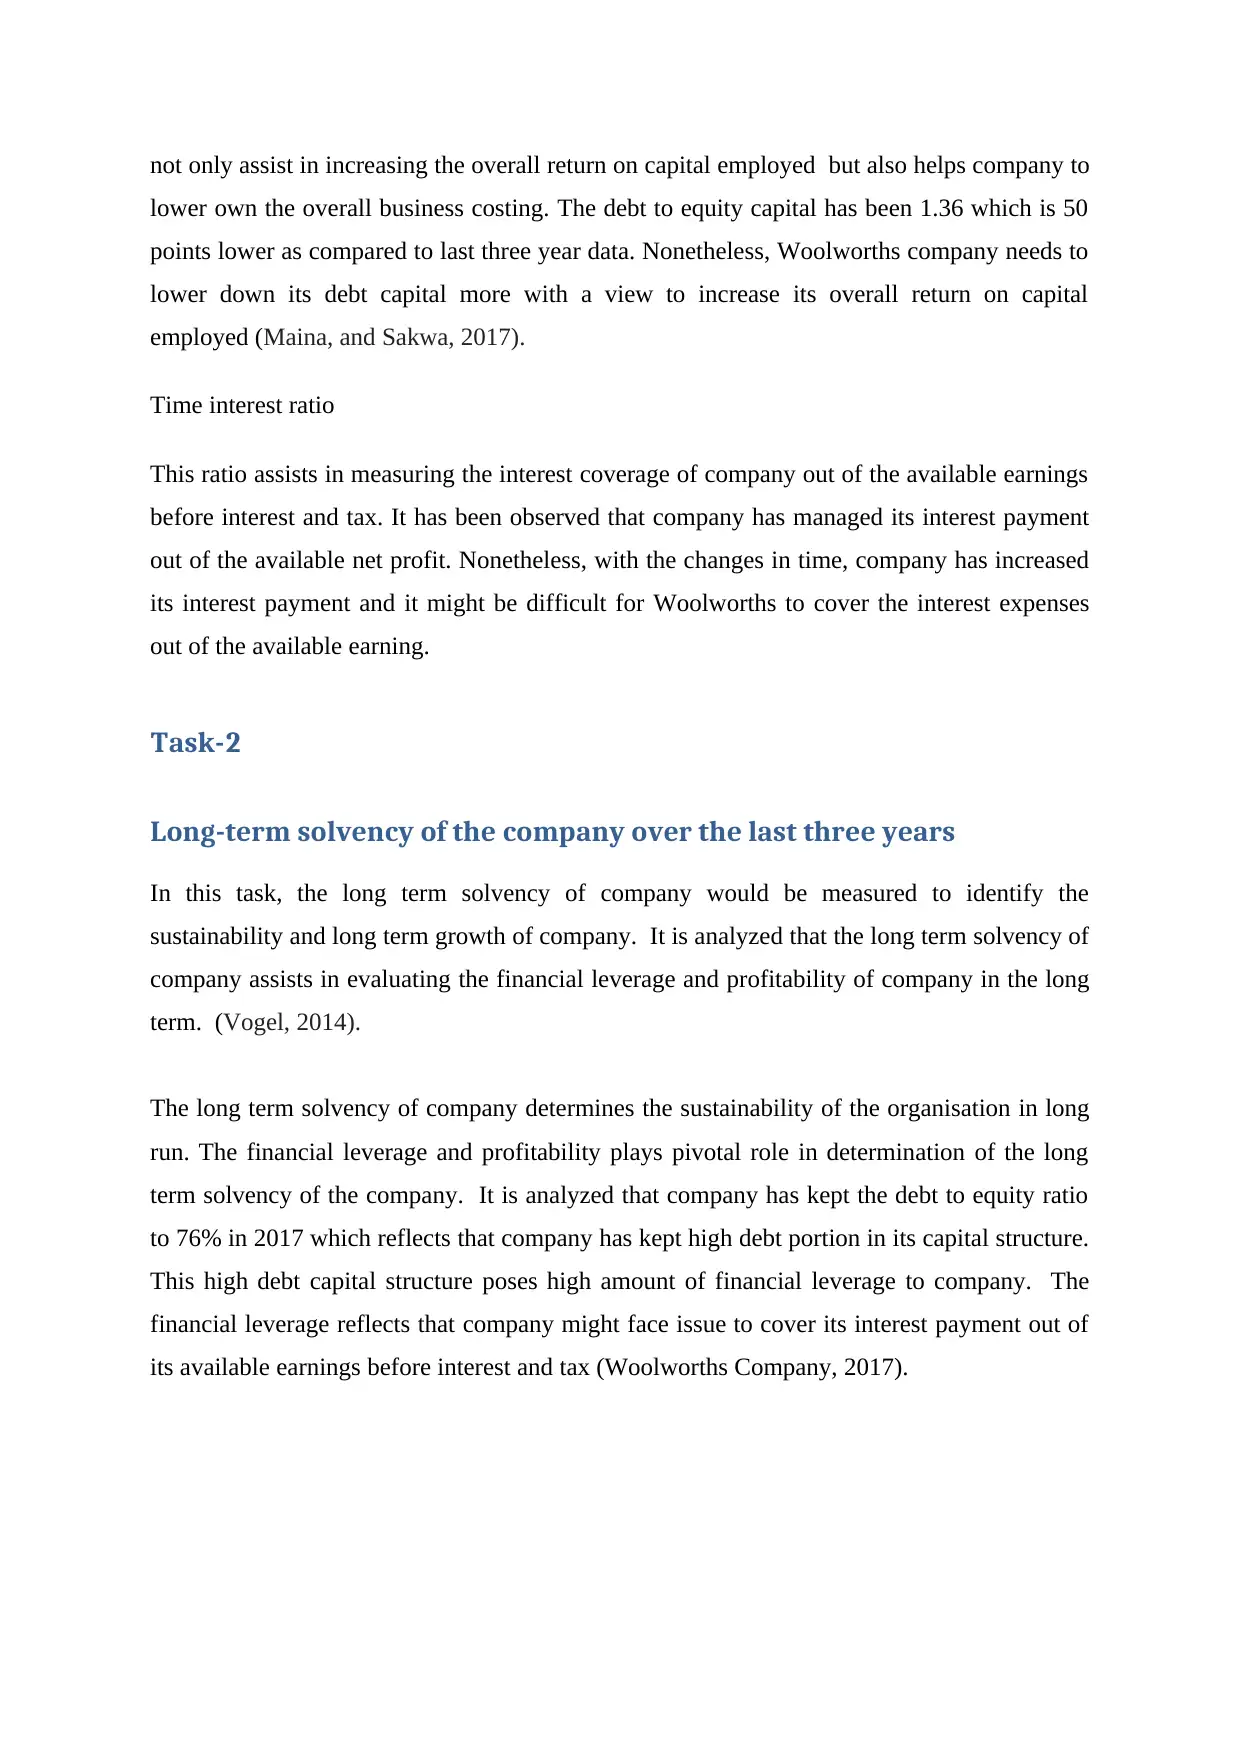
not only assist in increasing the overall return on capital employed but also helps company to
lower own the overall business costing. The debt to equity capital has been 1.36 which is 50
points lower as compared to last three year data. Nonetheless, Woolworths company needs to
lower down its debt capital more with a view to increase its overall return on capital
employed (Maina, and Sakwa, 2017).
Time interest ratio
This ratio assists in measuring the interest coverage of company out of the available earnings
before interest and tax. It has been observed that company has managed its interest payment
out of the available net profit. Nonetheless, with the changes in time, company has increased
its interest payment and it might be difficult for Woolworths to cover the interest expenses
out of the available earning.
Task-2
Long-term solvency of the company over the last three years
In this task, the long term solvency of company would be measured to identify the
sustainability and long term growth of company. It is analyzed that the long term solvency of
company assists in evaluating the financial leverage and profitability of company in the long
term. (Vogel, 2014).
The long term solvency of company determines the sustainability of the organisation in long
run. The financial leverage and profitability plays pivotal role in determination of the long
term solvency of the company. It is analyzed that company has kept the debt to equity ratio
to 76% in 2017 which reflects that company has kept high debt portion in its capital structure.
This high debt capital structure poses high amount of financial leverage to company. The
financial leverage reflects that company might face issue to cover its interest payment out of
its available earnings before interest and tax (Woolworths Company, 2017).
Description Formula Woolworth Company
2013
-08 2014-08
2015-
08
2016
-08
2017-
08
Average
industry
ratio
Times
interest
earned
EBIT / Interest
expenses 0.0 0.0 0.0 5.6 4.9 5.0
Cash
coverage
ratio
EBIT + non-cash
expenses / interest
expenses - - - - 7.00 858
Debt to
Equity Ratio Debt/ Equity 1.17 2.36 1.91 1.49 1.36 3.7
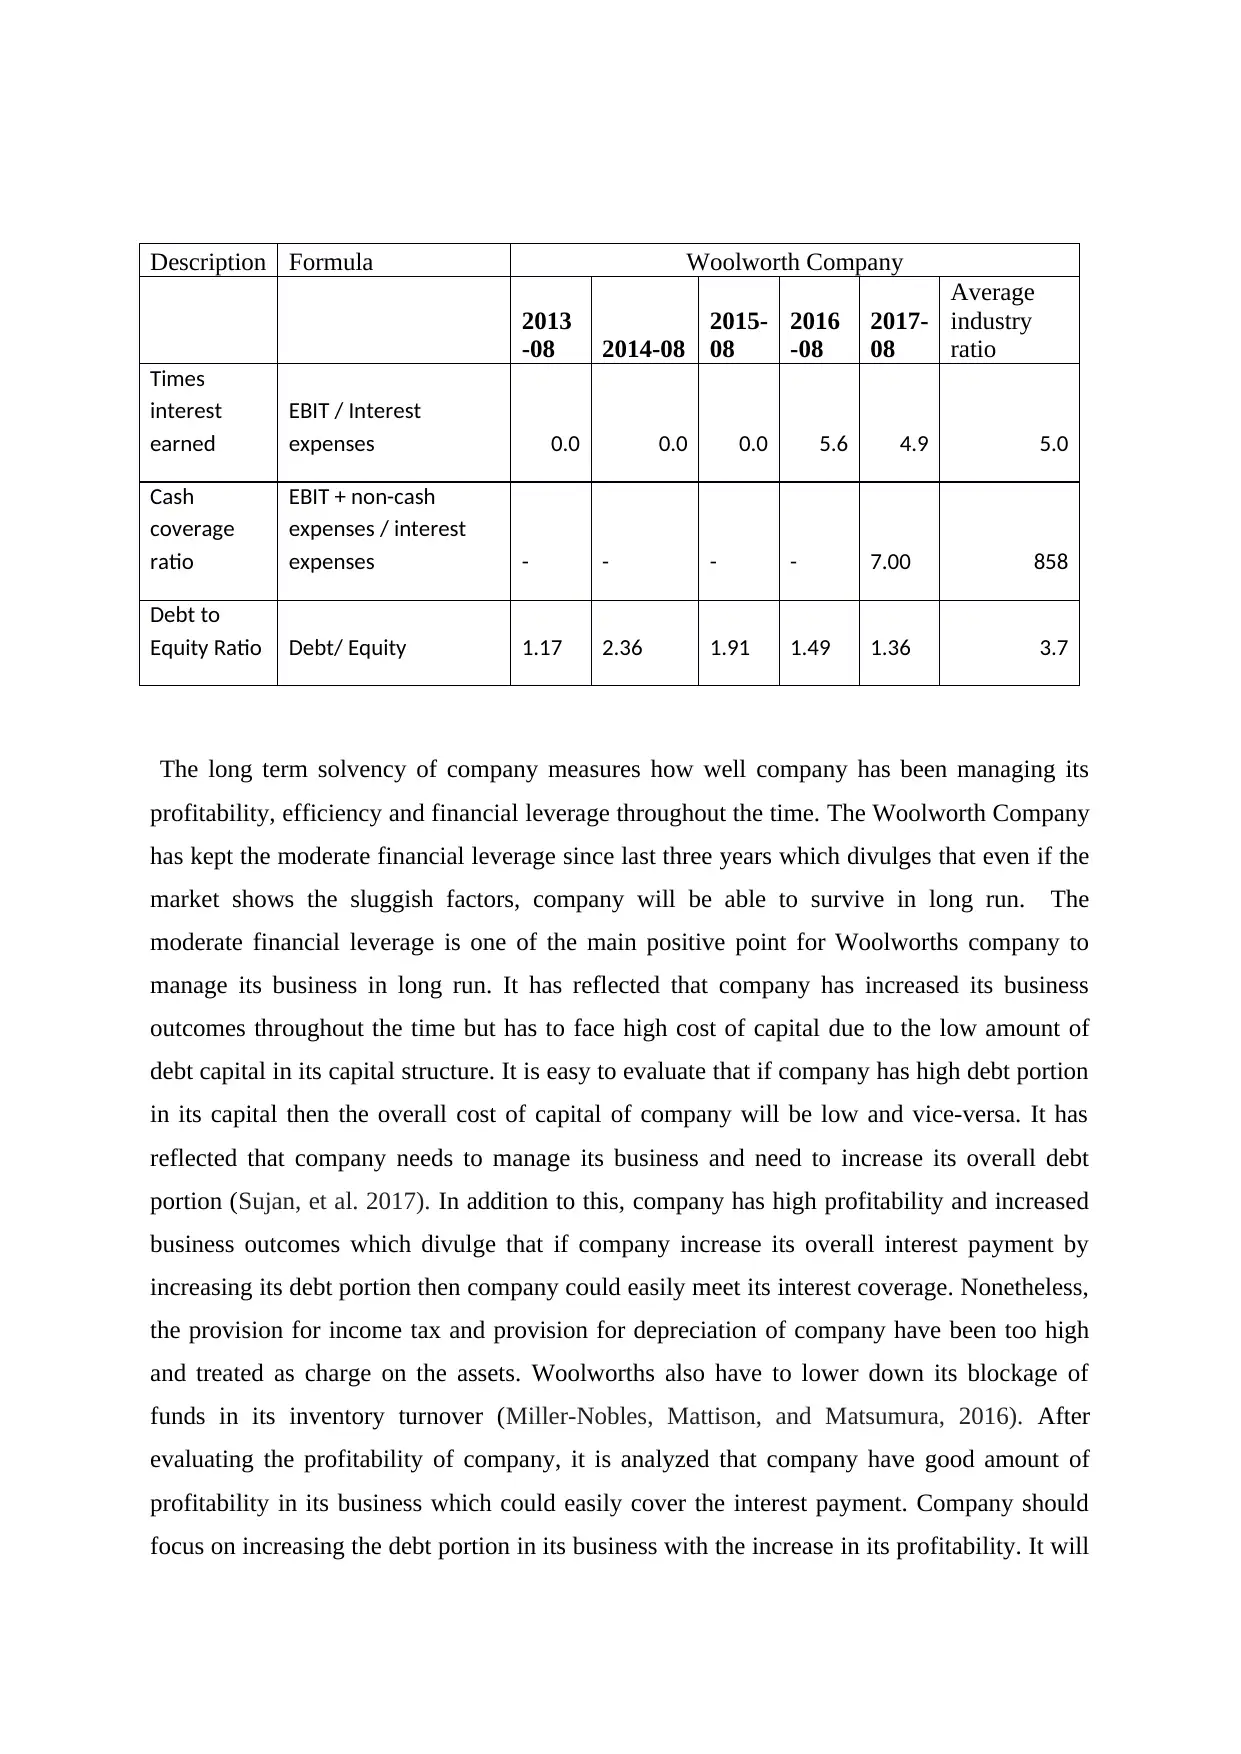
The long term solvency of company measures how well company has been managing its
profitability, efficiency and financial leverage throughout the time. The Woolworth Company
has kept the moderate financial leverage since last three years which divulges that even if the
market shows the sluggish factors, company will be able to survive in long run. The
moderate financial leverage is one of the main positive point for Woolworths company to
manage its business in long run. It has reflected that company has increased its business
outcomes throughout the time but has to face high cost of capital due to the low amount of
debt capital in its capital structure. It is easy to evaluate that if company has high debt portion
in its capital then the overall cost of capital of company will be low and vice-versa. It has
reflected that company needs to manage its business and need to increase its overall debt
portion (Sujan, et al. 2017). In addition to this, company has high profitability and increased
business outcomes which divulge that if company increase its overall interest payment by
increasing its debt portion then company could easily meet its interest coverage. Nonetheless,
the provision for income tax and provision for depreciation of company have been too high
and treated as charge on the assets. Woolworths also have to lower down its blockage of
funds in its inventory turnover (Miller-Nobles, Mattison, and Matsumura, 2016). After
evaluating the profitability of company, it is analyzed that company have good amount of
profitability in its business which could easily cover the interest payment. Company should
focus on increasing the debt portion in its business with the increase in its profitability. It will
2013
-08 2014-08
2015-
08
2016
-08
2017-
08
Average
industry
ratio
Times
interest
earned
EBIT / Interest
expenses 0.0 0.0 0.0 5.6 4.9 5.0
Cash
coverage
ratio
EBIT + non-cash
expenses / interest
expenses - - - - 7.00 858
Debt to
Equity Ratio Debt/ Equity 1.17 2.36 1.91 1.49 1.36 3.7
The long term solvency of company measures how well company has been managing its
profitability, efficiency and financial leverage throughout the time. The Woolworth Company
has kept the moderate financial leverage since last three years which divulges that even if the
market shows the sluggish factors, company will be able to survive in long run. The
moderate financial leverage is one of the main positive point for Woolworths company to
manage its business in long run. It has reflected that company has increased its business
outcomes throughout the time but has to face high cost of capital due to the low amount of
debt capital in its capital structure. It is easy to evaluate that if company has high debt portion
in its capital then the overall cost of capital of company will be low and vice-versa. It has
reflected that company needs to manage its business and need to increase its overall debt
portion (Sujan, et al. 2017). In addition to this, company has high profitability and increased
business outcomes which divulge that if company increase its overall interest payment by
increasing its debt portion then company could easily meet its interest coverage. Nonetheless,
the provision for income tax and provision for depreciation of company have been too high
and treated as charge on the assets. Woolworths also have to lower down its blockage of
funds in its inventory turnover (Miller-Nobles, Mattison, and Matsumura, 2016). After
evaluating the profitability of company, it is analyzed that company have good amount of
profitability in its business which could easily cover the interest payment. Company should
focus on increasing the debt portion in its business with the increase in its profitability. It will
⊘ This is a preview!⊘
Do you want full access?
Subscribe today to unlock all pages.
Trusted by 1+ million students worldwide
surely not result to increase financial leverage in business but lower down the overall cost of
capital in effective manner (Waemustafa, and Sukri, 2016),
Now after assessing all the details and financial factors of company, it is inferred that
company has high profitability and effective business. Therefore, due to the low financial
leverage and high profitability, company has good long term solvency. Nonetheless, in order
to lower down the cost of capital and increasing the overall efficiency, company should focus
on increasing the overall debt portion in its business which will lower down the overall
costing of the business. Firstly, management needs to focus on changing the capital structure
with a view to increase the overall efficiency of business. In addition to this, liquidity
position of company should also be managed to meet the future current liabilities in long run.
Task-3
Assess the liquidity position of the company as at the latest financial year
It is analyzed that with the increasing ramified economic demand of market, company needs
to manage its liquidity position in effective manner. The liquidity position of company
determines the flow of cash in business. It is analyzed that in order to measure the liquidity
position of company, current ratio and quick ratio of company need to be computed. These
both ratio reflects how well company has invested its capital in its operating business cycle.
However, it is hard to determine the exact point of liquidity position of company which might
assist in meeting the future liabilities of clients. Nonetheless, after analysing the type of
business, nature, complexity of the process and demand of market, managers could determine
the point at which the liquidity position of company should stand. If company blocks higher
capital in its liquidity position then it will directly impact the overall cost of capital of
company if it does use its liquidity assets in its business (Meena, and Dhar, 2016).
Liquidity position of Woolworth company
The liquidity position of company measures its ability to cover its short term and long term
debts out of its available funds. It is analyzed that in case if company has higher demand in
market and highly fluctuated business, then it should have higher liquidity position in market.
The liquidity position of company is divided into two main pars named as current ratio and
quick ratio (Dey, and Choudhury, 2018). The following information have been drawn by
Paraphrase This Document
Need a fresh take? Get an instant paraphrase of this document with our AI Paraphraser
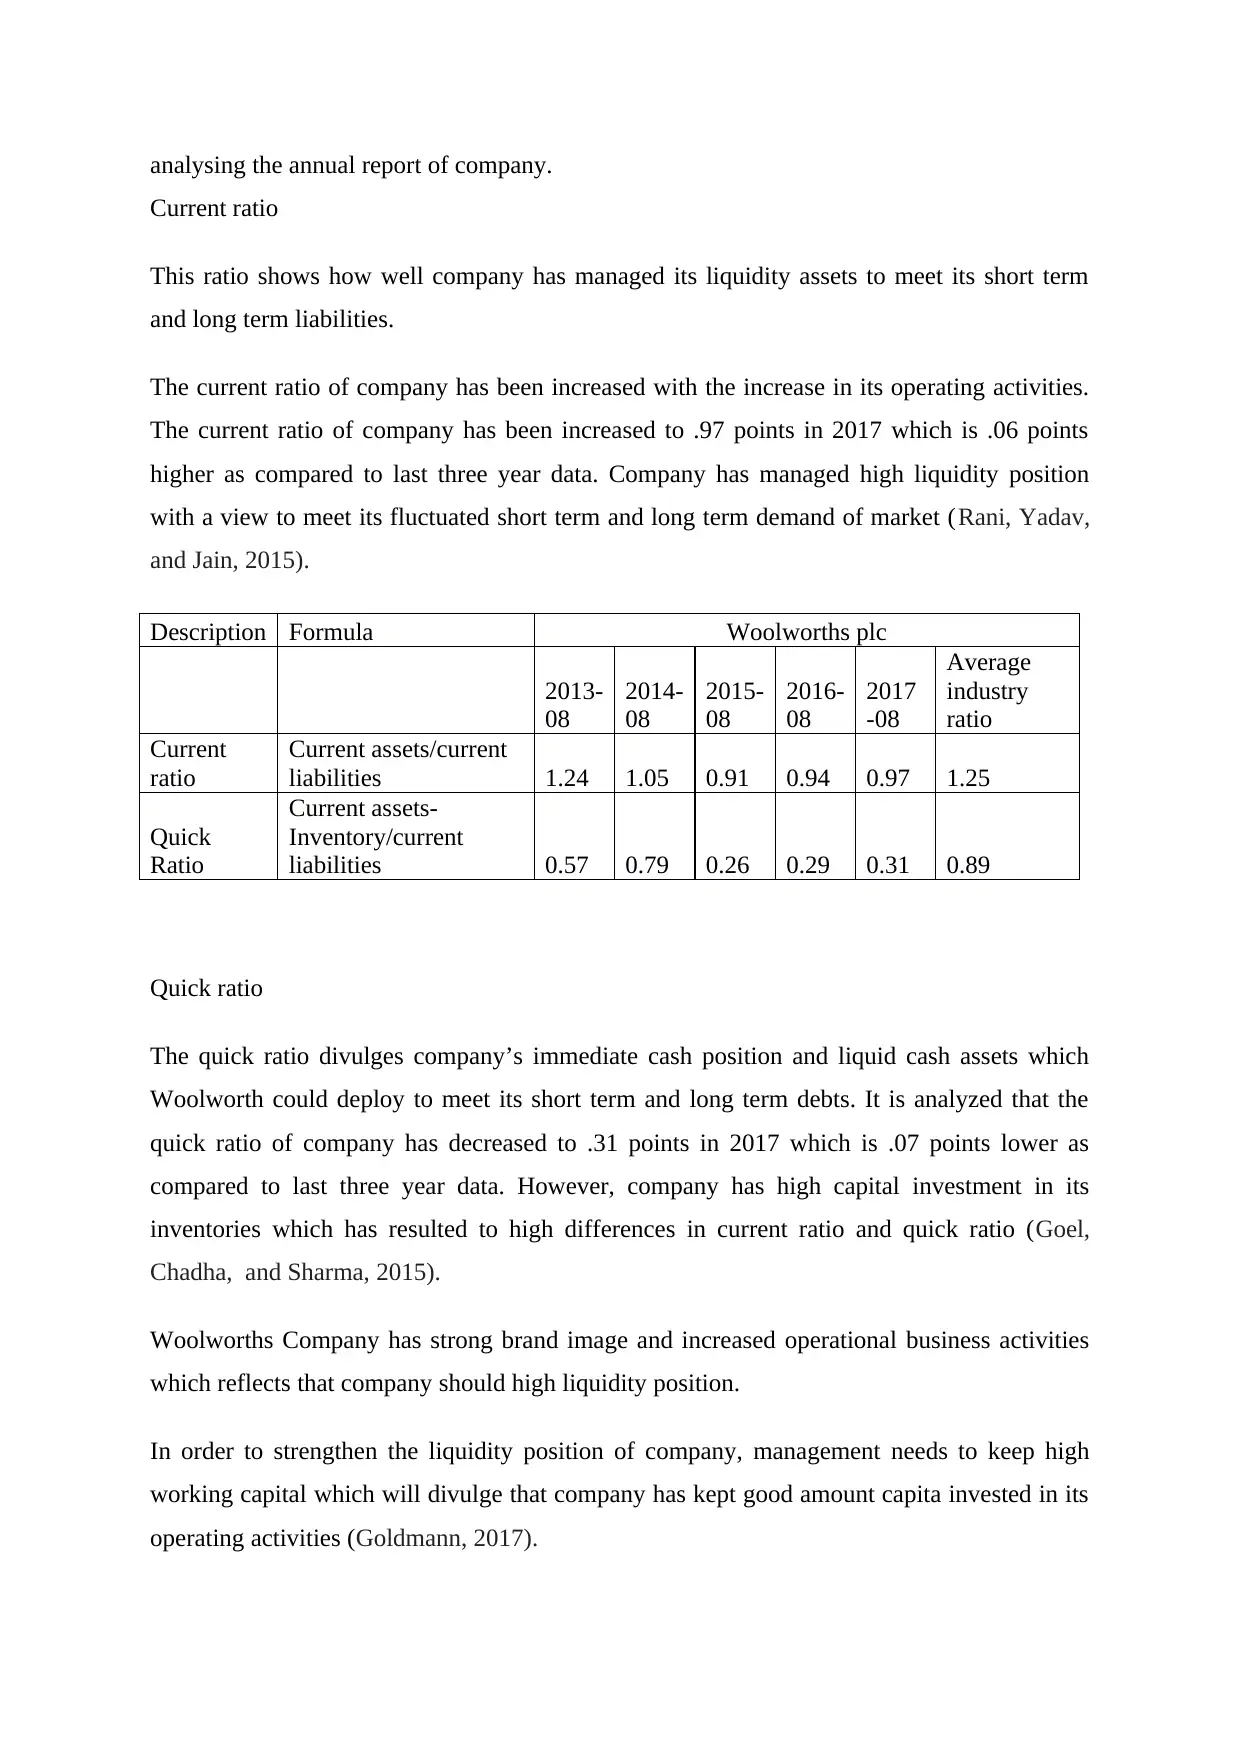
analysing the annual report of company.
Current ratio
This ratio shows how well company has managed its liquidity assets to meet its short term
and long term liabilities.
The current ratio of company has been increased with the increase in its operating activities.
The current ratio of company has been increased to .97 points in 2017 which is .06 points
higher as compared to last three year data. Company has managed high liquidity position
with a view to meet its fluctuated short term and long term demand of market (Rani, Yadav,
and Jain, 2015).
Description Formula Woolworths plc
2013-
08
2014-
08
2015-
08
2016-
08
2017
-08
Average
industry
ratio
Current
ratio
Current assets/current
liabilities 1.24 1.05 0.91 0.94 0.97 1.25
Quick
Ratio
Current assets-
Inventory/current
liabilities 0.57 0.79 0.26 0.29 0.31 0.89
Quick ratio
The quick ratio divulges company’s immediate cash position and liquid cash assets which
Woolworth could deploy to meet its short term and long term debts. It is analyzed that the
quick ratio of company has decreased to .31 points in 2017 which is .07 points lower as
compared to last three year data. However, company has high capital investment in its
inventories which has resulted to high differences in current ratio and quick ratio (Goel,
Chadha, and Sharma, 2015).
Woolworths Company has strong brand image and increased operational business activities
which reflects that company should high liquidity position.
In order to strengthen the liquidity position of company, management needs to keep high
working capital which will divulge that company has kept good amount capita invested in its
operating activities (Goldmann, 2017).
Task-4
Discuss the quality of financial statement
The financial statements of company are accompanied with the balance sheet, income
statements and other notes to accounts of company. Woolworth Company is listed company
and having several sub units. Therefore, company needs to file consolidated financial
statements. It has been observed that company has followed IFRS rules and standards to
prepare and report the financial statement with the authority. The main objective of financial
reporting and accounting standards followed by company is based on the reason of keeping
the business more transparent to its shareholders. The financial statement of Woolworths
company has been prepared after following all the accounting concepts and principles. As per
the annual report of company, it is analyzed that company has charged the impairment loss on
its assets and liabilities booked in the financial statements. It is further observed that as per
the IAS -136, company has computed the impairment loss after analysing the book value of
the assets and market value of the assets. In addition to this, all the financial statements have
been prepared after following the IFRS 101 which requires company to follow the
consolidated financial statements (Hunjra,. and Bashir, 2014). The quality of the financial
statements prepared by company is high and it has strengthened the transparency of all the
details noted in the financial statements. In addition to this, internal control department also
check any kind of discrepancies in preparing the reporting of financial statements. It is further
observe that the auditors of company also have indulged in checking the rightness of the
financial statement. In the audit of the financial statements, Auditors of company gave their
qualified report stating the fact that company needs to establish the harmonization in its
domestic and reporting frameworks. It is analyzed that directors and mangers needs to check
the viability of the accounts an reporting frameworks and focused on integration, quality of
the financial parts. It is analyzed that in order to strengthen the quality of the financial
statement, management and other higher authority has issued the management representation
latter with the financial statements while communicating the required information to auditors
and accounts. It will not only increase the genuinely of the financial statement but also assist
company to keep its financial reporting framework more true and fair. It is analyzed that
shareholders and investors may face issue and high losses due to the insider trading acts.
Therefore, in order to curb these types of acts, company has kept its financial statements
more transparent and include all the details and other key information. The auditor’s
⊘ This is a preview!⊘
Do you want full access?
Subscribe today to unlock all pages.
Trusted by 1+ million students worldwide
1 out of 16
Related Documents


Your All-in-One AI-Powered Toolkit for Academic Success.
+13062052269
info@desklib.com
Available 24*7 on WhatsApp / Email
![[object Object]](/_next/static/media/star-bottom.7253800d.svg)
Unlock your academic potential
Copyright © 2020–2025 A2Z Services. All Rights Reserved. Developed and managed by ZUCOL.