WOW.AX Finance Project: Free Cash Flow Analysis and Recommendation
VerifiedAdded on 2023/06/03
|10
|2637
|232
Report
AI Summary
This report provides an in-depth analysis of Woolworths Limited's (WOW.AX) free cash flows (FCFF) and offers a buy recommendation based on the company's intrinsic value compared to its market price. The analysis includes a review of the past five years' financial statements to estimate fut...
Running Head: Finance
1
Project Report: Finance
1
Project Report: Finance
Paraphrase This Document
Need a fresh take? Get an instant paraphrase of this document with our AI Paraphraser
Finance
2
Executive summary:
The report focuses on the estimated free cash flows of Woolworths limited. The buy and sell
recommendation has mainly been studied in the report. The financial statement of last 5 years has
been estimated to measure the total cash flows so that the estimated free cash flows of the business
could be measured. On the basis of the overall study, it has been estimated that the intrinsic value of
the business is higher than the market price and thus the company is better choice for the purpose of
investment. The growth rate of the business is also higher than the GDP growth rate which also make
the company a better choice.
Finance
3
Contents
Introduction:.....................................................................................................................4
Company overview:..........................................................................................................4
Dividend cash flow approach:..........................................................................................4
Growth drivers:.................................................................................................................8
Main risk:..........................................................................................................................8
Recommendation and conclusion:....................................................................................9
References:.....................................................................................................................10
⊘ This is a preview!⊘
Do you want full access?
Subscribe today to unlock all pages.
Trusted by 1+ million students worldwide
Finance
4
Introduction:
Free cash flow of a business represents the total cash which is generated by the company after
deducting all the cash outflows of the business in order to support the operations and main the assets
of the business. Free cash flows play an important role in order to identify the value of the business in
near future. It indicates that how much cash would be generated by the business sin the future and
what would be the market value of the stock of the business. It takes the concern on various factors in
order to determine the overall performance of the business. In the report, the Woolworths group
limited has been taken into the concern to measure the free cash flow of the business of next 10 years.
Company overview:
Woolworths limited is the ones of the largest Australian retail companies which operates its
business in the Australian and New Zealand market. In terms of the revenue generation, Woolworths
is the second largest company. It is the largest liquor take away company in the Australian market.
There are various division of the company which are dealing in the different segment in order to run
the business and operations of the company efficiently (Home, 2018). The main divisions of the
business include supermarkets, petrol, liquor, home improvements, general merchandise, hotel &
gambolling etc. Currently, the company is working on its market strategy to improve the market share
and become the leader at the international market.
Dividend cash flow approach:
The valuation study represents the DCF valuation approach on the basis of which the future
cash flow of the business has been estimated. The DCF approach has been used in the Woolworths
group limited to measure the total cash flows in the next 10 years as well as the intrinsic value of the
stock of the business. The DCF valuation method application was quite easier because of the
predictable financial statement. The model forecast the next 10 year cash flows of the business
(Higgins, 2012).
The FCFF method is used in WOW as expected to undertake highly capital intensive projects
in the recent years and it would also focus on the borrowings and debt level of the business. The
FCFF valuation method makes to easier for the business to incorporate the changes and identify the
performance of the business. Additionally, the annual report of the business and other news related to
the business describe that currently the business is not planning for any kind of expansion in the
business and thus the same operations would be carried by the business and there wouldn’t be much
difference in the revenue and the expenses of the business (Gibson, 2011).
Paraphrase This Document
Need a fresh take? Get an instant paraphrase of this document with our AI Paraphraser
Finance
5
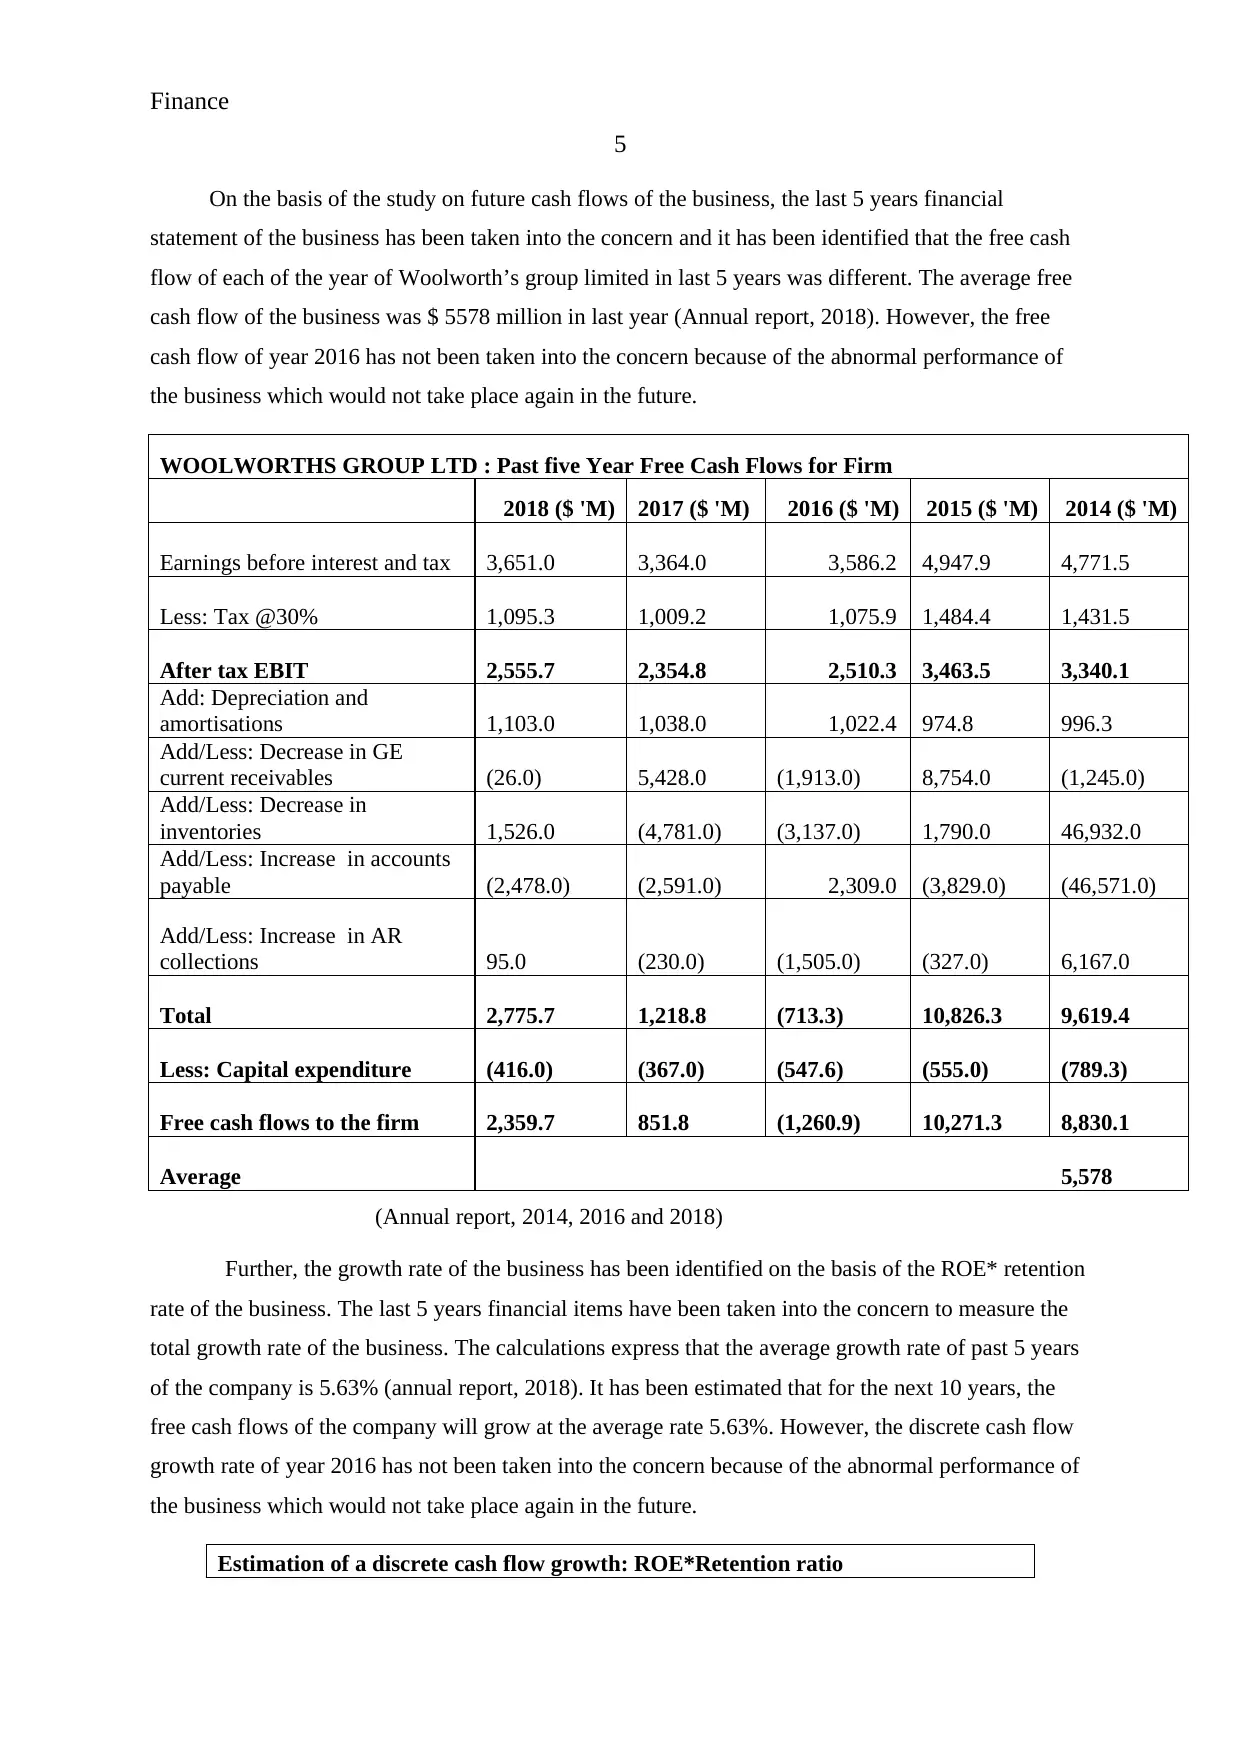
On the basis of the study on future cash flows of the business, the last 5 years financial
statement of the business has been taken into the concern and it has been identified that the free cash
flow of each of the year of Woolworth’s group limited in last 5 years was different. The average free
cash flow of the business was $ 5578 million in last year (Annual report, 2018). However, the free
cash flow of year 2016 has not been taken into the concern because of the abnormal performance of
the business which would not take place again in the future.
WOOLWORTHS GROUP LTD : Past five Year Free Cash Flows for Firm
2018 ($ 'M) 2017 ($ 'M) 2016 ($ 'M) 2015 ($ 'M) 2014 ($ 'M)
Earnings before interest and tax 3,651.0 3,364.0 3,586.2 4,947.9 4,771.5
Less: Tax @30% 1,095.3 1,009.2 1,075.9 1,484.4 1,431.5
After tax EBIT 2,555.7 2,354.8 2,510.3 3,463.5 3,340.1
Add: Depreciation and
amortisations 1,103.0 1,038.0 1,022.4 974.8 996.3
Add/Less: Decrease in GE
current receivables (26.0) 5,428.0 (1,913.0) 8,754.0 (1,245.0)
Add/Less: Decrease in
inventories 1,526.0 (4,781.0) (3,137.0) 1,790.0 46,932.0
Add/Less: Increase in accounts
payable (2,478.0) (2,591.0) 2,309.0 (3,829.0) (46,571.0)
Add/Less: Increase in AR
collections 95.0 (230.0) (1,505.0) (327.0) 6,167.0
Total 2,775.7 1,218.8 (713.3) 10,826.3 9,619.4
Less: Capital expenditure (416.0) (367.0) (547.6) (555.0) (789.3)
Free cash flows to the firm 2,359.7 851.8 (1,260.9) 10,271.3 8,830.1
Average 5,578
(Annual report, 2014, 2016 and 2018)
Further, the growth rate of the business has been identified on the basis of the ROE* retention
rate of the business. The last 5 years financial items have been taken into the concern to measure the
total growth rate of the business. The calculations express that the average growth rate of past 5 years
of the company is 5.63% (annual report, 2018). It has been estimated that for the next 10 years, the
free cash flows of the company will grow at the average rate 5.63%. However, the discrete cash flow
growth rate of year 2016 has not been taken into the concern because of the abnormal performance of
the business which would not take place again in the future.
Estimation of a discrete cash flow growth: ROE*Retention ratio
5
On the basis of the study on future cash flows of the business, the last 5 years financial
statement of the business has been taken into the concern and it has been identified that the free cash
flow of each of the year of Woolworth’s group limited in last 5 years was different. The average free
cash flow of the business was $ 5578 million in last year (Annual report, 2018). However, the free
cash flow of year 2016 has not been taken into the concern because of the abnormal performance of
the business which would not take place again in the future.
WOOLWORTHS GROUP LTD : Past five Year Free Cash Flows for Firm
2018 ($ 'M) 2017 ($ 'M) 2016 ($ 'M) 2015 ($ 'M) 2014 ($ 'M)
Earnings before interest and tax 3,651.0 3,364.0 3,586.2 4,947.9 4,771.5
Less: Tax @30% 1,095.3 1,009.2 1,075.9 1,484.4 1,431.5
After tax EBIT 2,555.7 2,354.8 2,510.3 3,463.5 3,340.1
Add: Depreciation and
amortisations 1,103.0 1,038.0 1,022.4 974.8 996.3
Add/Less: Decrease in GE
current receivables (26.0) 5,428.0 (1,913.0) 8,754.0 (1,245.0)
Add/Less: Decrease in
inventories 1,526.0 (4,781.0) (3,137.0) 1,790.0 46,932.0
Add/Less: Increase in accounts
payable (2,478.0) (2,591.0) 2,309.0 (3,829.0) (46,571.0)
Add/Less: Increase in AR
collections 95.0 (230.0) (1,505.0) (327.0) 6,167.0
Total 2,775.7 1,218.8 (713.3) 10,826.3 9,619.4
Less: Capital expenditure (416.0) (367.0) (547.6) (555.0) (789.3)
Free cash flows to the firm 2,359.7 851.8 (1,260.9) 10,271.3 8,830.1
Average 5,578
(Annual report, 2014, 2016 and 2018)
Further, the growth rate of the business has been identified on the basis of the ROE* retention
rate of the business. The last 5 years financial items have been taken into the concern to measure the
total growth rate of the business. The calculations express that the average growth rate of past 5 years
of the company is 5.63% (annual report, 2018). It has been estimated that for the next 10 years, the
free cash flows of the company will grow at the average rate 5.63%. However, the discrete cash flow
growth rate of year 2016 has not been taken into the concern because of the abnormal performance of
the business which would not take place again in the future.
Estimation of a discrete cash flow growth: ROE*Retention ratio
Finance
6
Year
Net profit for
equity ($M) Equity ($M) ROE (%)
Retention
ratio (EPS-
DPS/EPS) Growth rate
2014 24,517.00 102,525.00 23.91% -2.92% -0.70%
2015 21,460.00 108,342.00 19.81% -16.81% -3.33%
2016 (12,348.00) 84,706.00 -14.58% 178.57% -26.03%
2017 15,335.00 95,260.00 16.10% 50.59% 8.14%
2018 17,240.00 104,810.00 16.45% 111.83% 18.39%
Average growth of past five years 5.63%
(Yahoo finance, 2018)
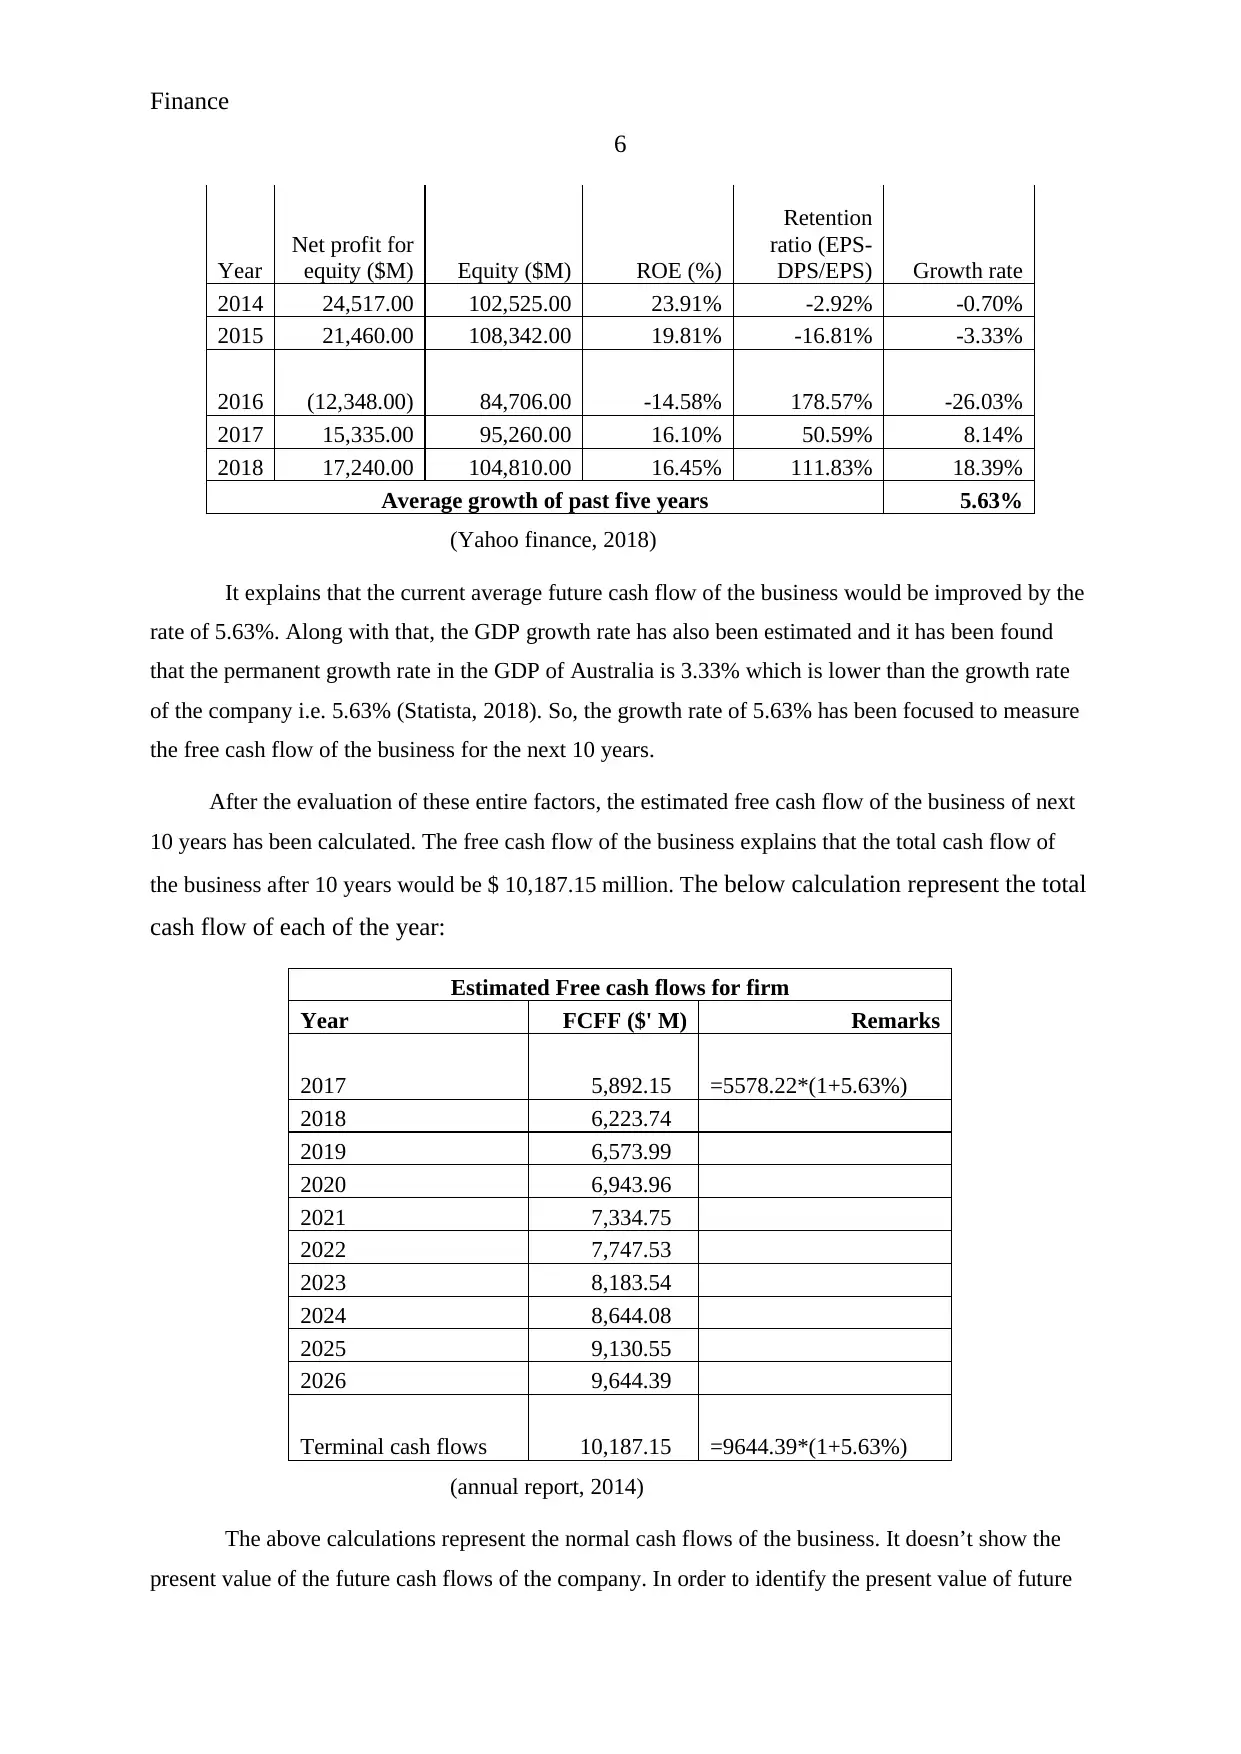
It explains that the current average future cash flow of the business would be improved by the
rate of 5.63%. Along with that, the GDP growth rate has also been estimated and it has been found
that the permanent growth rate in the GDP of Australia is 3.33% which is lower than the growth rate
of the company i.e. 5.63% (Statista, 2018). So, the growth rate of 5.63% has been focused to measure
the free cash flow of the business for the next 10 years.
After the evaluation of these entire factors, the estimated free cash flow of the business of next
10 years has been calculated. The free cash flow of the business explains that the total cash flow of
the business after 10 years would be $ 10,187.15 million. The below calculation represent the total
cash flow of each of the year:
Estimated Free cash flows for firm
Year FCFF ($' M) Remarks
2017 5,892.15 =5578.22*(1+5.63%)
2018 6,223.74
2019 6,573.99
2020 6,943.96
2021 7,334.75
2022 7,747.53
2023 8,183.54
2024 8,644.08
2025 9,130.55
2026 9,644.39
Terminal cash flows 10,187.15 =9644.39*(1+5.63%)
(annual report, 2014)
The above calculations represent the normal cash flows of the business. It doesn’t show the
present value of the future cash flows of the company. In order to identify the present value of future
6
Year
Net profit for
equity ($M) Equity ($M) ROE (%)
Retention
ratio (EPS-
DPS/EPS) Growth rate
2014 24,517.00 102,525.00 23.91% -2.92% -0.70%
2015 21,460.00 108,342.00 19.81% -16.81% -3.33%
2016 (12,348.00) 84,706.00 -14.58% 178.57% -26.03%
2017 15,335.00 95,260.00 16.10% 50.59% 8.14%
2018 17,240.00 104,810.00 16.45% 111.83% 18.39%
Average growth of past five years 5.63%
(Yahoo finance, 2018)
It explains that the current average future cash flow of the business would be improved by the
rate of 5.63%. Along with that, the GDP growth rate has also been estimated and it has been found
that the permanent growth rate in the GDP of Australia is 3.33% which is lower than the growth rate
of the company i.e. 5.63% (Statista, 2018). So, the growth rate of 5.63% has been focused to measure
the free cash flow of the business for the next 10 years.
After the evaluation of these entire factors, the estimated free cash flow of the business of next
10 years has been calculated. The free cash flow of the business explains that the total cash flow of
the business after 10 years would be $ 10,187.15 million. The below calculation represent the total
cash flow of each of the year:
Estimated Free cash flows for firm
Year FCFF ($' M) Remarks
2017 5,892.15 =5578.22*(1+5.63%)
2018 6,223.74
2019 6,573.99
2020 6,943.96
2021 7,334.75
2022 7,747.53
2023 8,183.54
2024 8,644.08
2025 9,130.55
2026 9,644.39
Terminal cash flows 10,187.15 =9644.39*(1+5.63%)
(annual report, 2014)
The above calculations represent the normal cash flows of the business. It doesn’t show the
present value of the future cash flows of the company. In order to identify the present value of future
⊘ This is a preview!⊘
Do you want full access?
Subscribe today to unlock all pages.
Trusted by 1+ million students worldwide
Finance
7
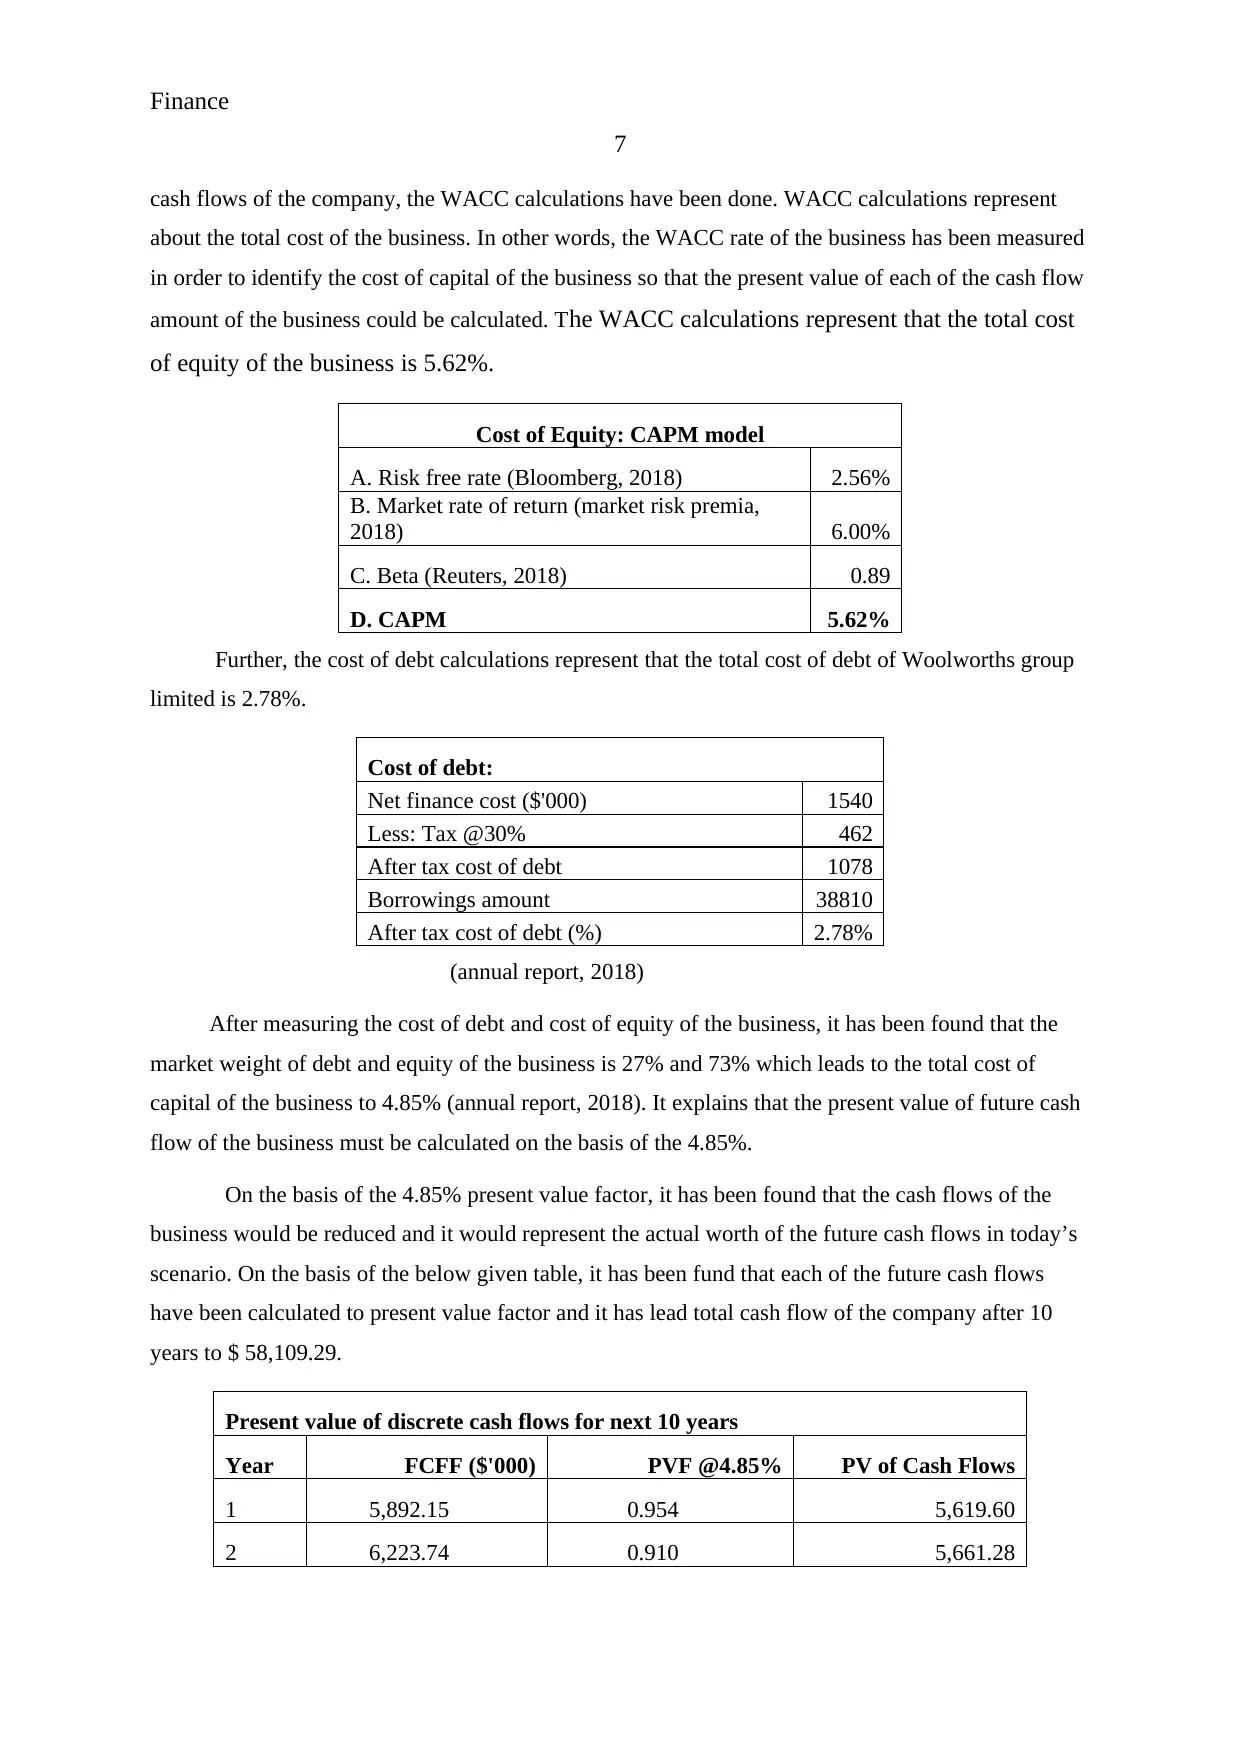
cash flows of the company, the WACC calculations have been done. WACC calculations represent
about the total cost of the business. In other words, the WACC rate of the business has been measured
in order to identify the cost of capital of the business so that the present value of each of the cash flow
amount of the business could be calculated. The WACC calculations represent that the total cost
of equity of the business is 5.62%.
Cost of Equity: CAPM model
A. Risk free rate (Bloomberg, 2018) 2.56%
B. Market rate of return (market risk premia,
2018) 6.00%
C. Beta (Reuters, 2018) 0.89
D. CAPM 5.62%
Further, the cost of debt calculations represent that the total cost of debt of Woolworths group
limited is 2.78%.
Cost of debt:
Net finance cost ($'000) 1540
Less: Tax @30% 462
After tax cost of debt 1078
Borrowings amount 38810
After tax cost of debt (%) 2.78%
(annual report, 2018)
After measuring the cost of debt and cost of equity of the business, it has been found that the
market weight of debt and equity of the business is 27% and 73% which leads to the total cost of
capital of the business to 4.85% (annual report, 2018). It explains that the present value of future cash
flow of the business must be calculated on the basis of the 4.85%.
On the basis of the 4.85% present value factor, it has been found that the cash flows of the
business would be reduced and it would represent the actual worth of the future cash flows in today’s
scenario. On the basis of the below given table, it has been fund that each of the future cash flows
have been calculated to present value factor and it has lead total cash flow of the company after 10
years to $ 58,109.29.
Present value of discrete cash flows for next 10 years
Year FCFF ($'000) PVF @4.85% PV of Cash Flows
1 5,892.15 0.954 5,619.60
2 6,223.74 0.910 5,661.28
7
cash flows of the company, the WACC calculations have been done. WACC calculations represent
about the total cost of the business. In other words, the WACC rate of the business has been measured
in order to identify the cost of capital of the business so that the present value of each of the cash flow
amount of the business could be calculated. The WACC calculations represent that the total cost
of equity of the business is 5.62%.
Cost of Equity: CAPM model
A. Risk free rate (Bloomberg, 2018) 2.56%
B. Market rate of return (market risk premia,
2018) 6.00%
C. Beta (Reuters, 2018) 0.89
D. CAPM 5.62%
Further, the cost of debt calculations represent that the total cost of debt of Woolworths group
limited is 2.78%.
Cost of debt:
Net finance cost ($'000) 1540
Less: Tax @30% 462
After tax cost of debt 1078
Borrowings amount 38810
After tax cost of debt (%) 2.78%
(annual report, 2018)
After measuring the cost of debt and cost of equity of the business, it has been found that the
market weight of debt and equity of the business is 27% and 73% which leads to the total cost of
capital of the business to 4.85% (annual report, 2018). It explains that the present value of future cash
flow of the business must be calculated on the basis of the 4.85%.
On the basis of the 4.85% present value factor, it has been found that the cash flows of the
business would be reduced and it would represent the actual worth of the future cash flows in today’s
scenario. On the basis of the below given table, it has been fund that each of the future cash flows
have been calculated to present value factor and it has lead total cash flow of the company after 10
years to $ 58,109.29.
Present value of discrete cash flows for next 10 years
Year FCFF ($'000) PVF @4.85% PV of Cash Flows
1 5,892.15 0.954 5,619.60
2 6,223.74 0.910 5,661.28
Paraphrase This Document
Need a fresh take? Get an instant paraphrase of this document with our AI Paraphraser
Finance
8
3 6,573.99 0.868 5,703.27
4 6,943.96 0.827 5,745.58
5 7,334.75 0.789 5,788.19
6 7,747.53 0.753 5,831.13
7 8,183.54 0.718 5,874.38
8 8,644.08 0.685 5,917.95
9 9,130.55 0.653 5,961.85
10 9,644.39 0.623 6,006.07
Total 58,109.29
(Higgins, 2012)
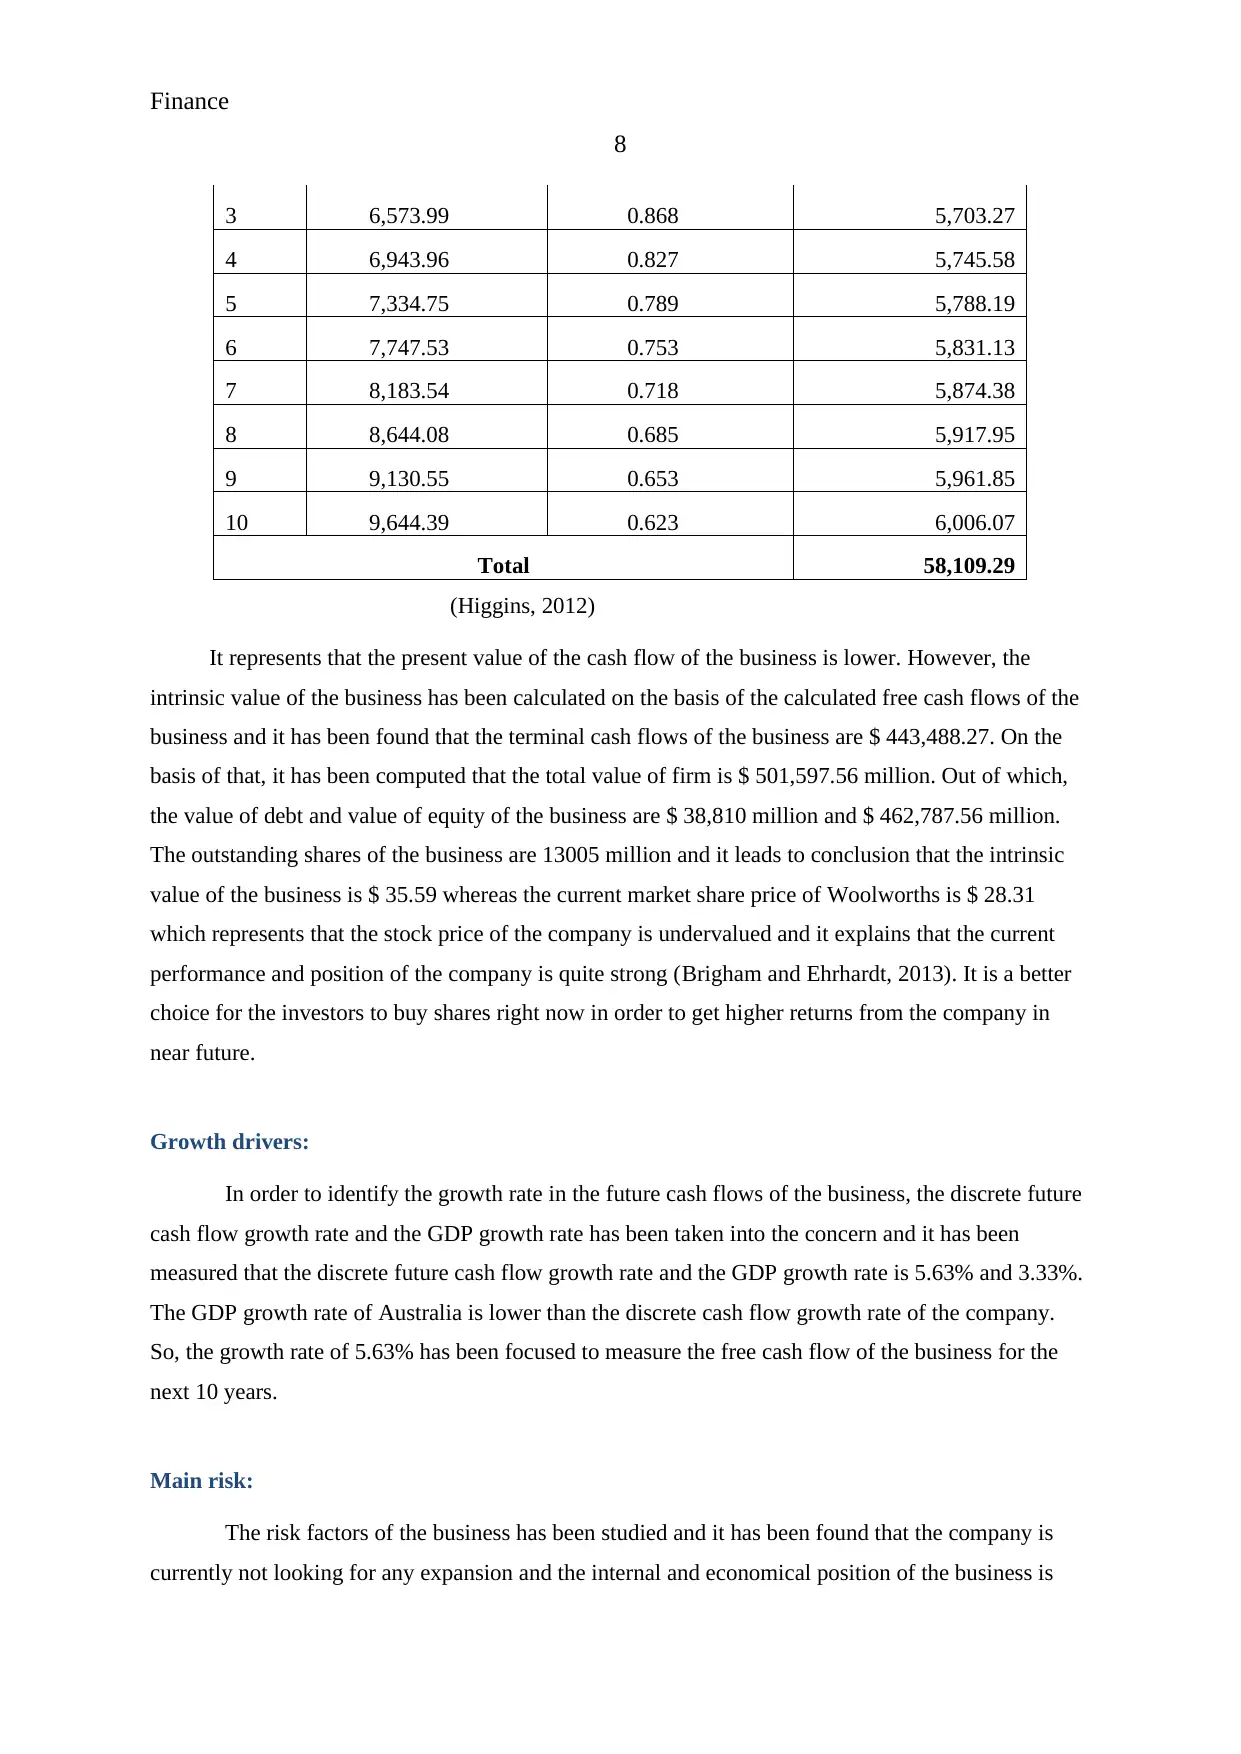
It represents that the present value of the cash flow of the business is lower. However, the
intrinsic value of the business has been calculated on the basis of the calculated free cash flows of the
business and it has been found that the terminal cash flows of the business are $ 443,488.27. On the
basis of that, it has been computed that the total value of firm is $ 501,597.56 million. Out of which,
the value of debt and value of equity of the business are $ 38,810 million and $ 462,787.56 million.
The outstanding shares of the business are 13005 million and it leads to conclusion that the intrinsic
value of the business is $ 35.59 whereas the current market share price of Woolworths is $ 28.31
which represents that the stock price of the company is undervalued and it explains that the current
performance and position of the company is quite strong (Brigham and Ehrhardt, 2013). It is a better
choice for the investors to buy shares right now in order to get higher returns from the company in
near future.
Growth drivers:
In order to identify the growth rate in the future cash flows of the business, the discrete future
cash flow growth rate and the GDP growth rate has been taken into the concern and it has been
measured that the discrete future cash flow growth rate and the GDP growth rate is 5.63% and 3.33%.
The GDP growth rate of Australia is lower than the discrete cash flow growth rate of the company.
So, the growth rate of 5.63% has been focused to measure the free cash flow of the business for the
next 10 years.
Main risk:
The risk factors of the business has been studied and it has been found that the company is
currently not looking for any expansion and the internal and economical position of the business is
8
3 6,573.99 0.868 5,703.27
4 6,943.96 0.827 5,745.58
5 7,334.75 0.789 5,788.19
6 7,747.53 0.753 5,831.13
7 8,183.54 0.718 5,874.38
8 8,644.08 0.685 5,917.95
9 9,130.55 0.653 5,961.85
10 9,644.39 0.623 6,006.07
Total 58,109.29
(Higgins, 2012)
It represents that the present value of the cash flow of the business is lower. However, the
intrinsic value of the business has been calculated on the basis of the calculated free cash flows of the
business and it has been found that the terminal cash flows of the business are $ 443,488.27. On the
basis of that, it has been computed that the total value of firm is $ 501,597.56 million. Out of which,
the value of debt and value of equity of the business are $ 38,810 million and $ 462,787.56 million.
The outstanding shares of the business are 13005 million and it leads to conclusion that the intrinsic
value of the business is $ 35.59 whereas the current market share price of Woolworths is $ 28.31
which represents that the stock price of the company is undervalued and it explains that the current
performance and position of the company is quite strong (Brigham and Ehrhardt, 2013). It is a better
choice for the investors to buy shares right now in order to get higher returns from the company in
near future.
Growth drivers:
In order to identify the growth rate in the future cash flows of the business, the discrete future
cash flow growth rate and the GDP growth rate has been taken into the concern and it has been
measured that the discrete future cash flow growth rate and the GDP growth rate is 5.63% and 3.33%.
The GDP growth rate of Australia is lower than the discrete cash flow growth rate of the company.
So, the growth rate of 5.63% has been focused to measure the free cash flow of the business for the
next 10 years.
Main risk:
The risk factors of the business has been studied and it has been found that the company is
currently not looking for any expansion and the internal and economical position of the business is
Finance
9
also stable which explains that there is no major risk associated with the business which also makes
the company a better choice in terms of the investment.
Recommendation and conclusion:
On the basis of the overall study on the company and its future cash flows, it has been found
that the performance of the company and cash flows of the company would be improved at a huge
rate in near future. The growth rate of the company is even higher than the GDP growth rate of the
country which makes the company a better choice for the purpose of the investment. So, it is
recommended to the investors to invest into the company in order to get the higher return in near
future.
⊘ This is a preview!⊘
Do you want full access?
Subscribe today to unlock all pages.
Trusted by 1+ million students worldwide
Finance
10
References:
Annual report. 2014. Woolworths Limited. (Online). Available at:
https://www.woolworthsgroup.com.au/icms_docs/185964_annual-report-2014.pdf (accessed
30/10/18).
Annual report. 2016. Woolworths Limited. (Online). Available at:
https://wow2016ar.qreports.com.au/xresources/pdf/wow16ar-full.pdf (accessed 30/10/18).
Annual report. 2018. Woolworths Limited. (Online). Available at:
https://www.woolworthsgroup.com.au/icms_docs/195396_annual-report-2018.pdf (accessed
30/10/18).
Bloomberg. 2018. Australian market rates. (Online). Available at:
https://www.bloomberg.com/markets/rates (accessed 30/10/18).
Brigham, E.F. and Ehrhardt, M.C., 2013. Financial management: Theory & practice. Cengage
Learning.
Gibson, C.H., 2011. Financial reporting and analysis. South-Western Cengage Learning.
Higgins, R.C., 2012. Analysis for financial management. McGraw-Hill/Irwin.
Home. 2018. Woolworths Limited. (Online). Available at: https://www.woolworthsgroup.com.au/
(accessed 30/10/18).
Market risk premia. 2018. Market return. (Online). Available at: http://www.market-risk-
premia.com/au.html (accessed 30/10/18).
Reuters. 2018. Woolworths Limited. (Online). Available at:
https://www.reuters.com/finance/stocks/overview/WOW.AX (accessed 30/10/18).
Statista. 2018. Australia GDP. (Online). Available at:
https://www.statista.com/statistics/263602/gross-domestic-product-gdp-growth-rate-in-australia/
(accessed 30/10/18).
Yahoo finance. 2018. Woolworths Limited. (Online). Available at:
https://finance.yahoo.com/quote/WOW.AX/history?
period1=1382985000&period2=1540751400&interval=div%7Csplit&filter=div&frequency=1mo
(accessed 30/10/18).
1 out of 10
Related Documents


Your All-in-One AI-Powered Toolkit for Academic Success.
+13062052269
info@desklib.com
Available 24*7 on WhatsApp / Email
![[object Object]](/_next/static/media/star-bottom.7253800d.svg)
Unlock your academic potential
© 2024 | Zucol Services PVT LTD | All rights reserved.