Workforce Analytics and Turnover Report for Kariuki Flynn Realty

Verified

Added on  2023/06/12

|17
|2859
|119
Report
AI Summary
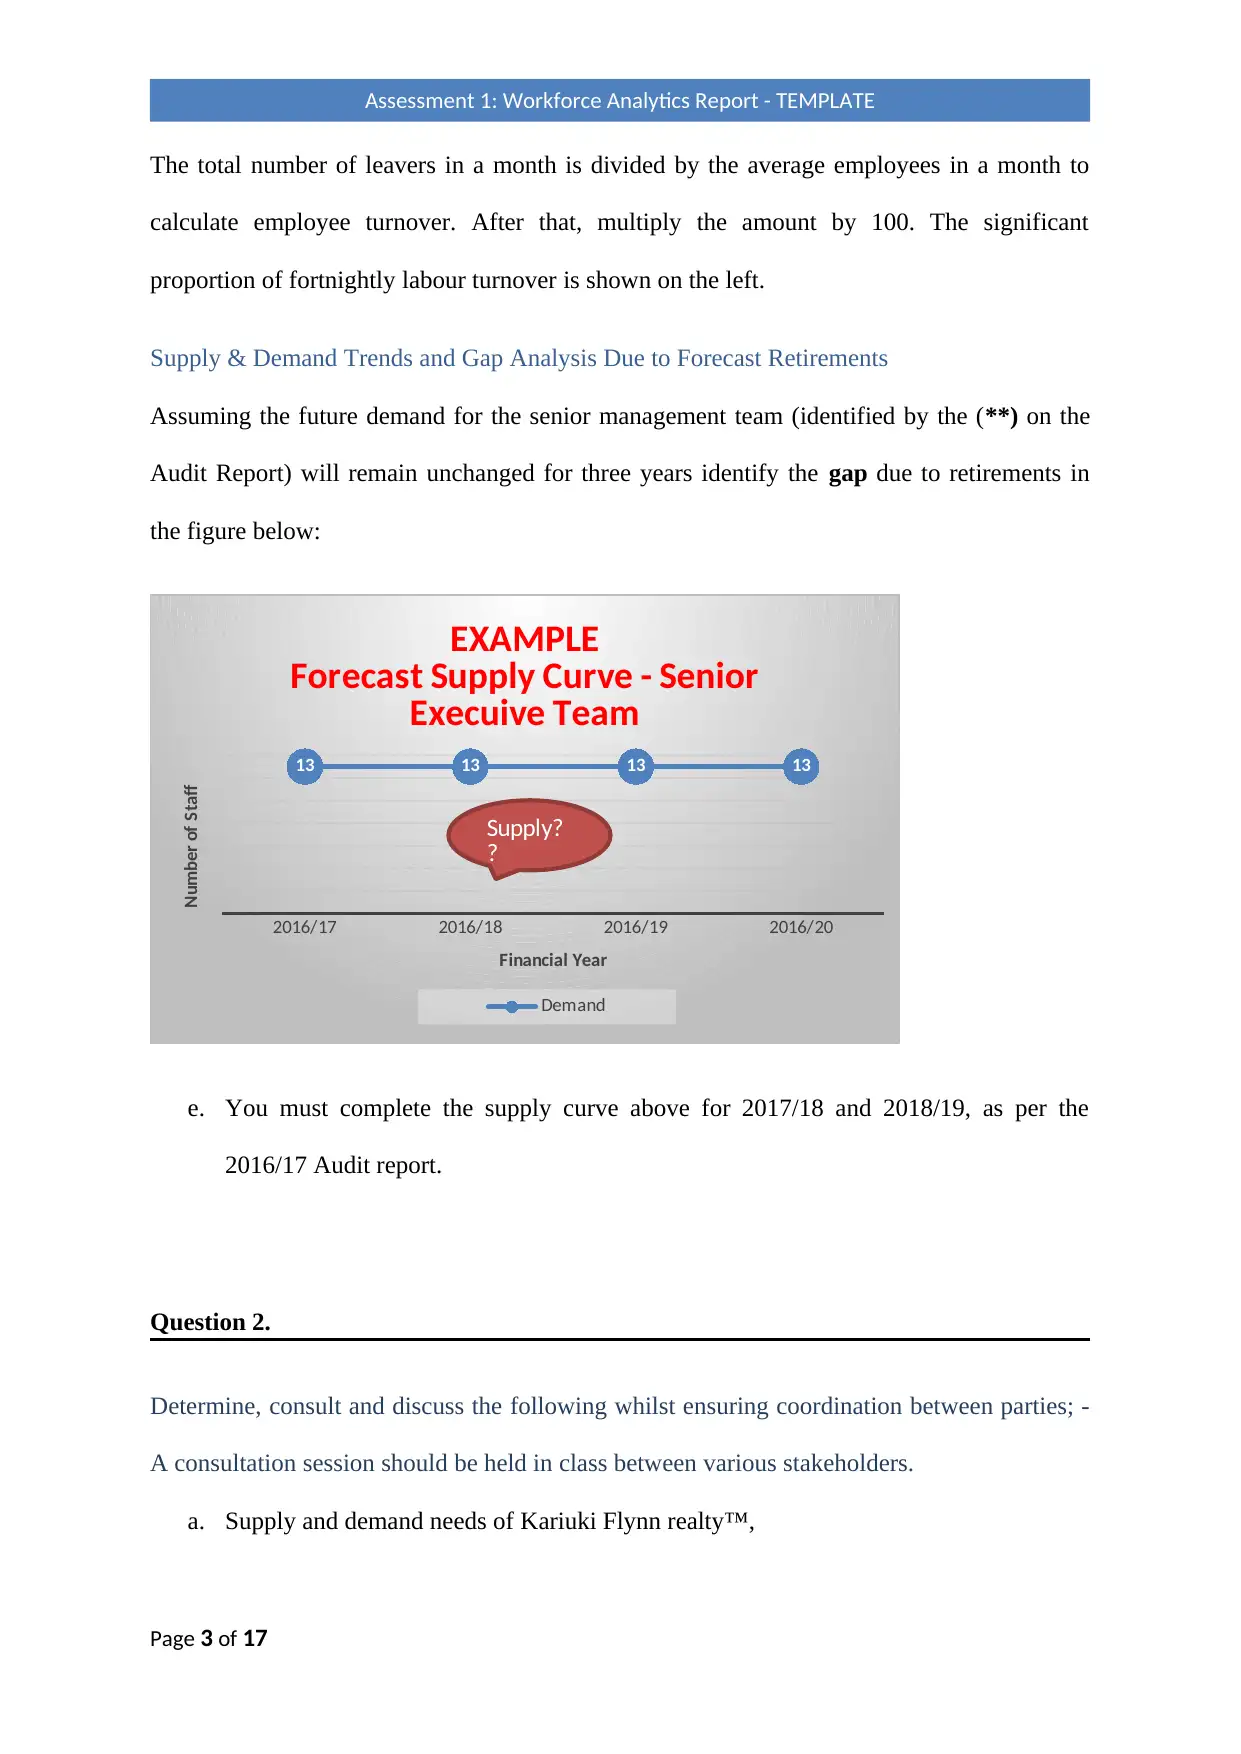
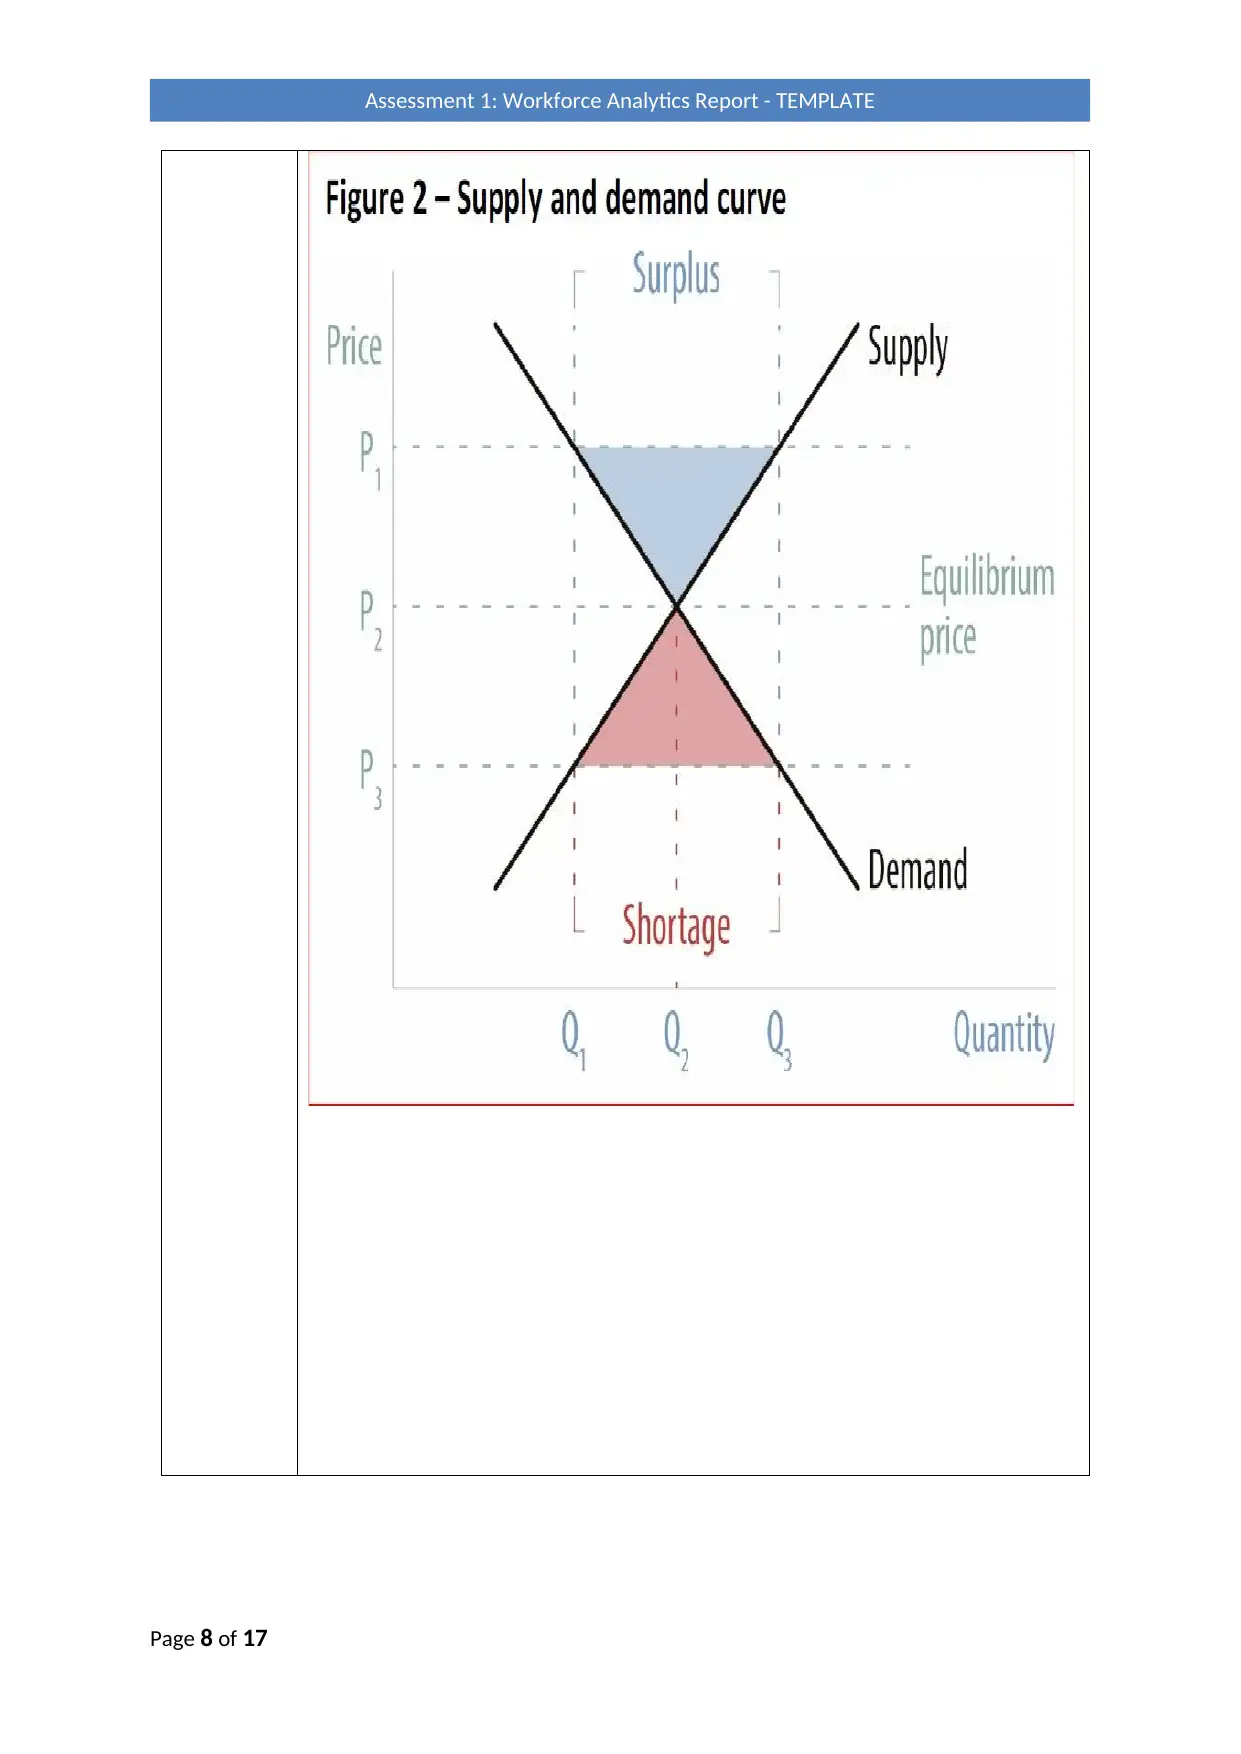
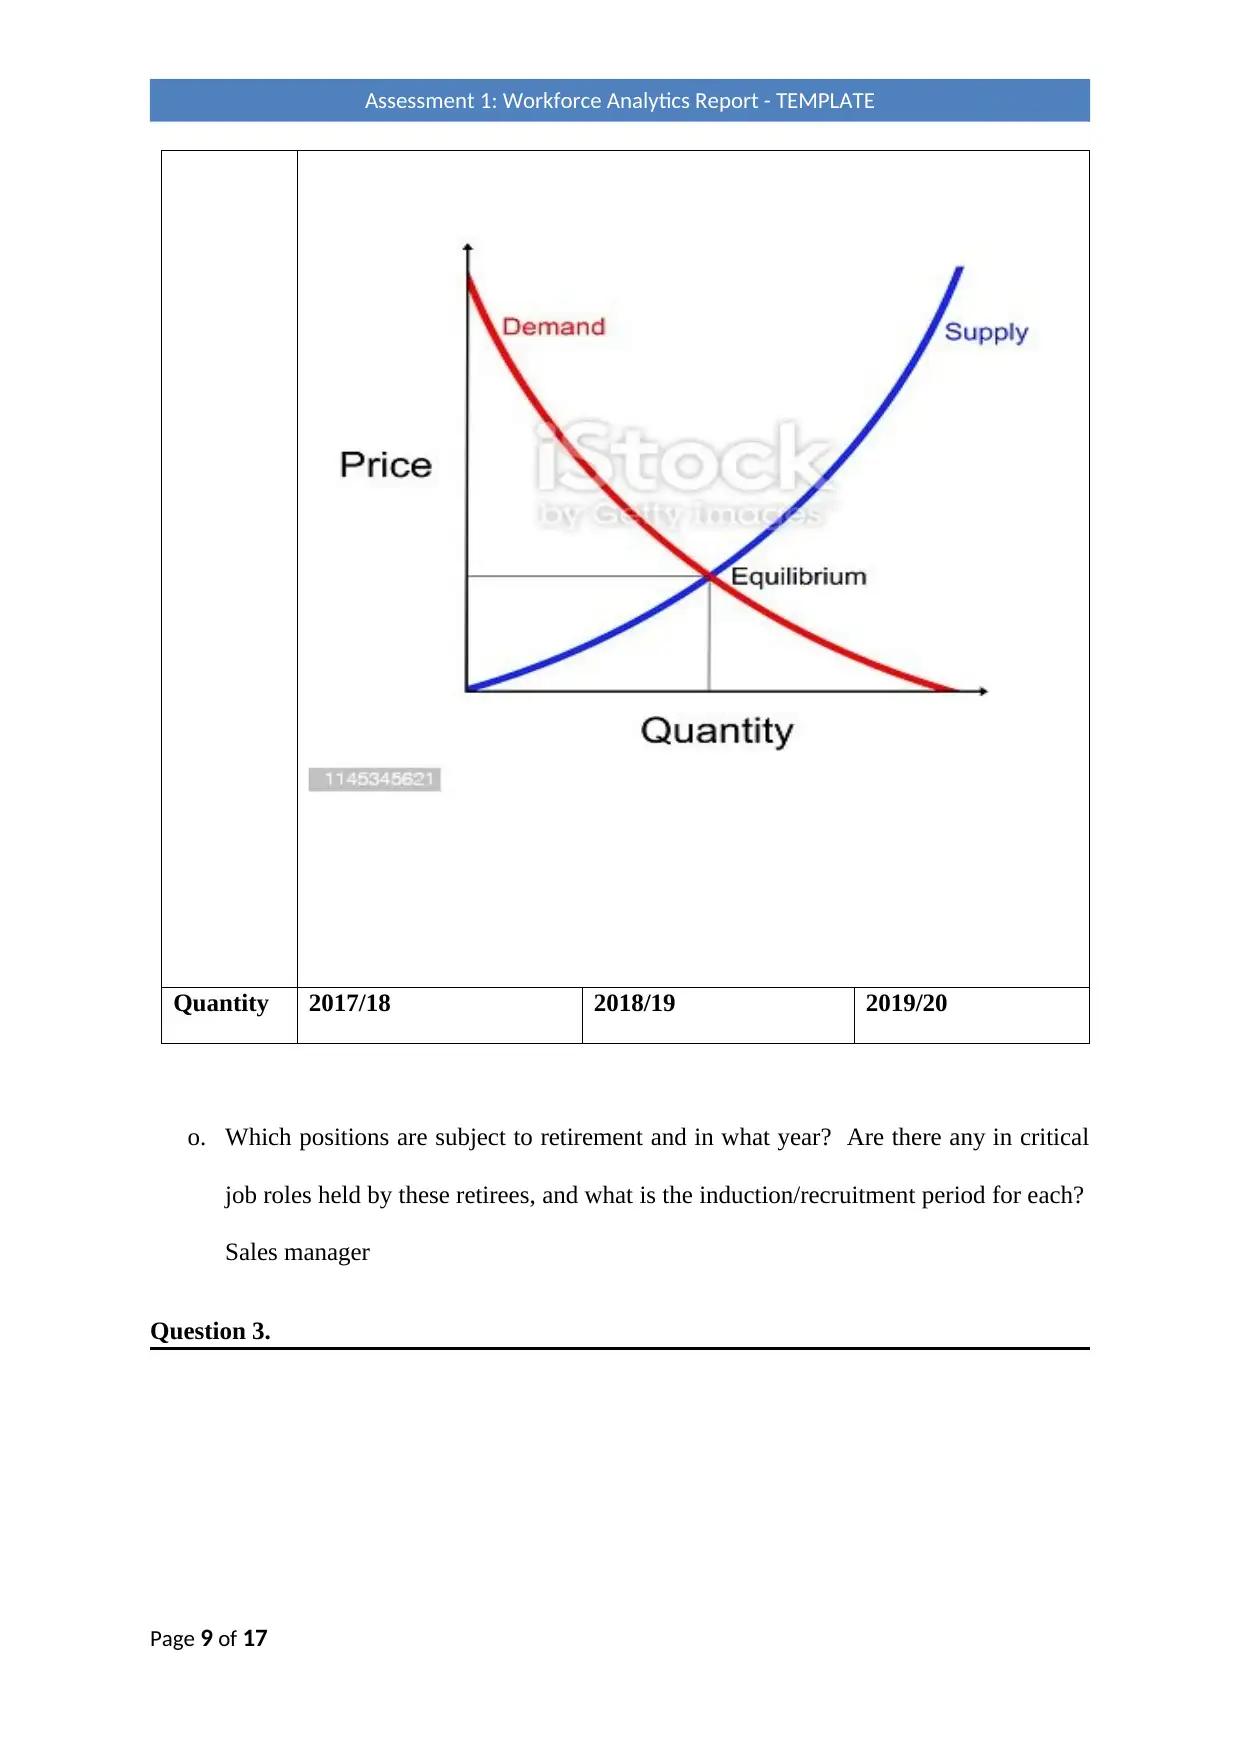
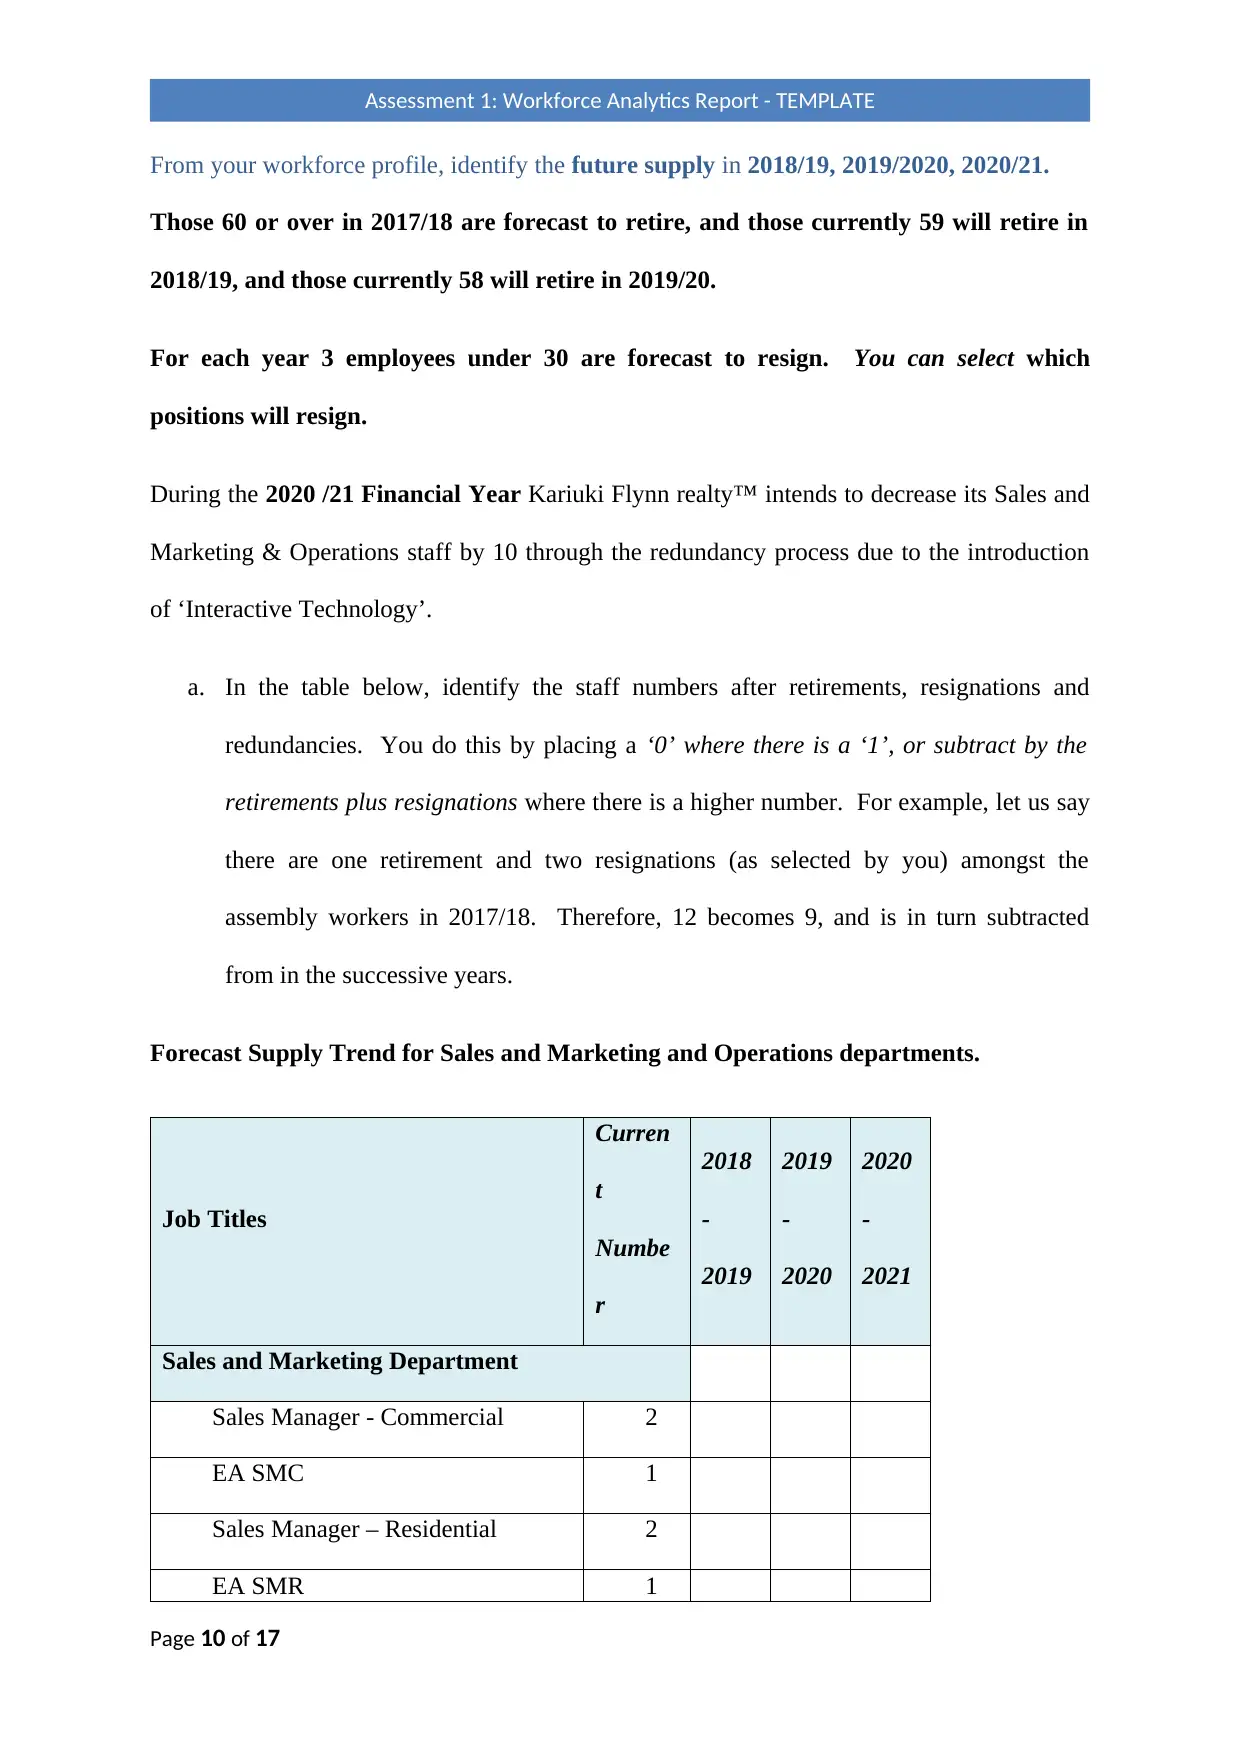
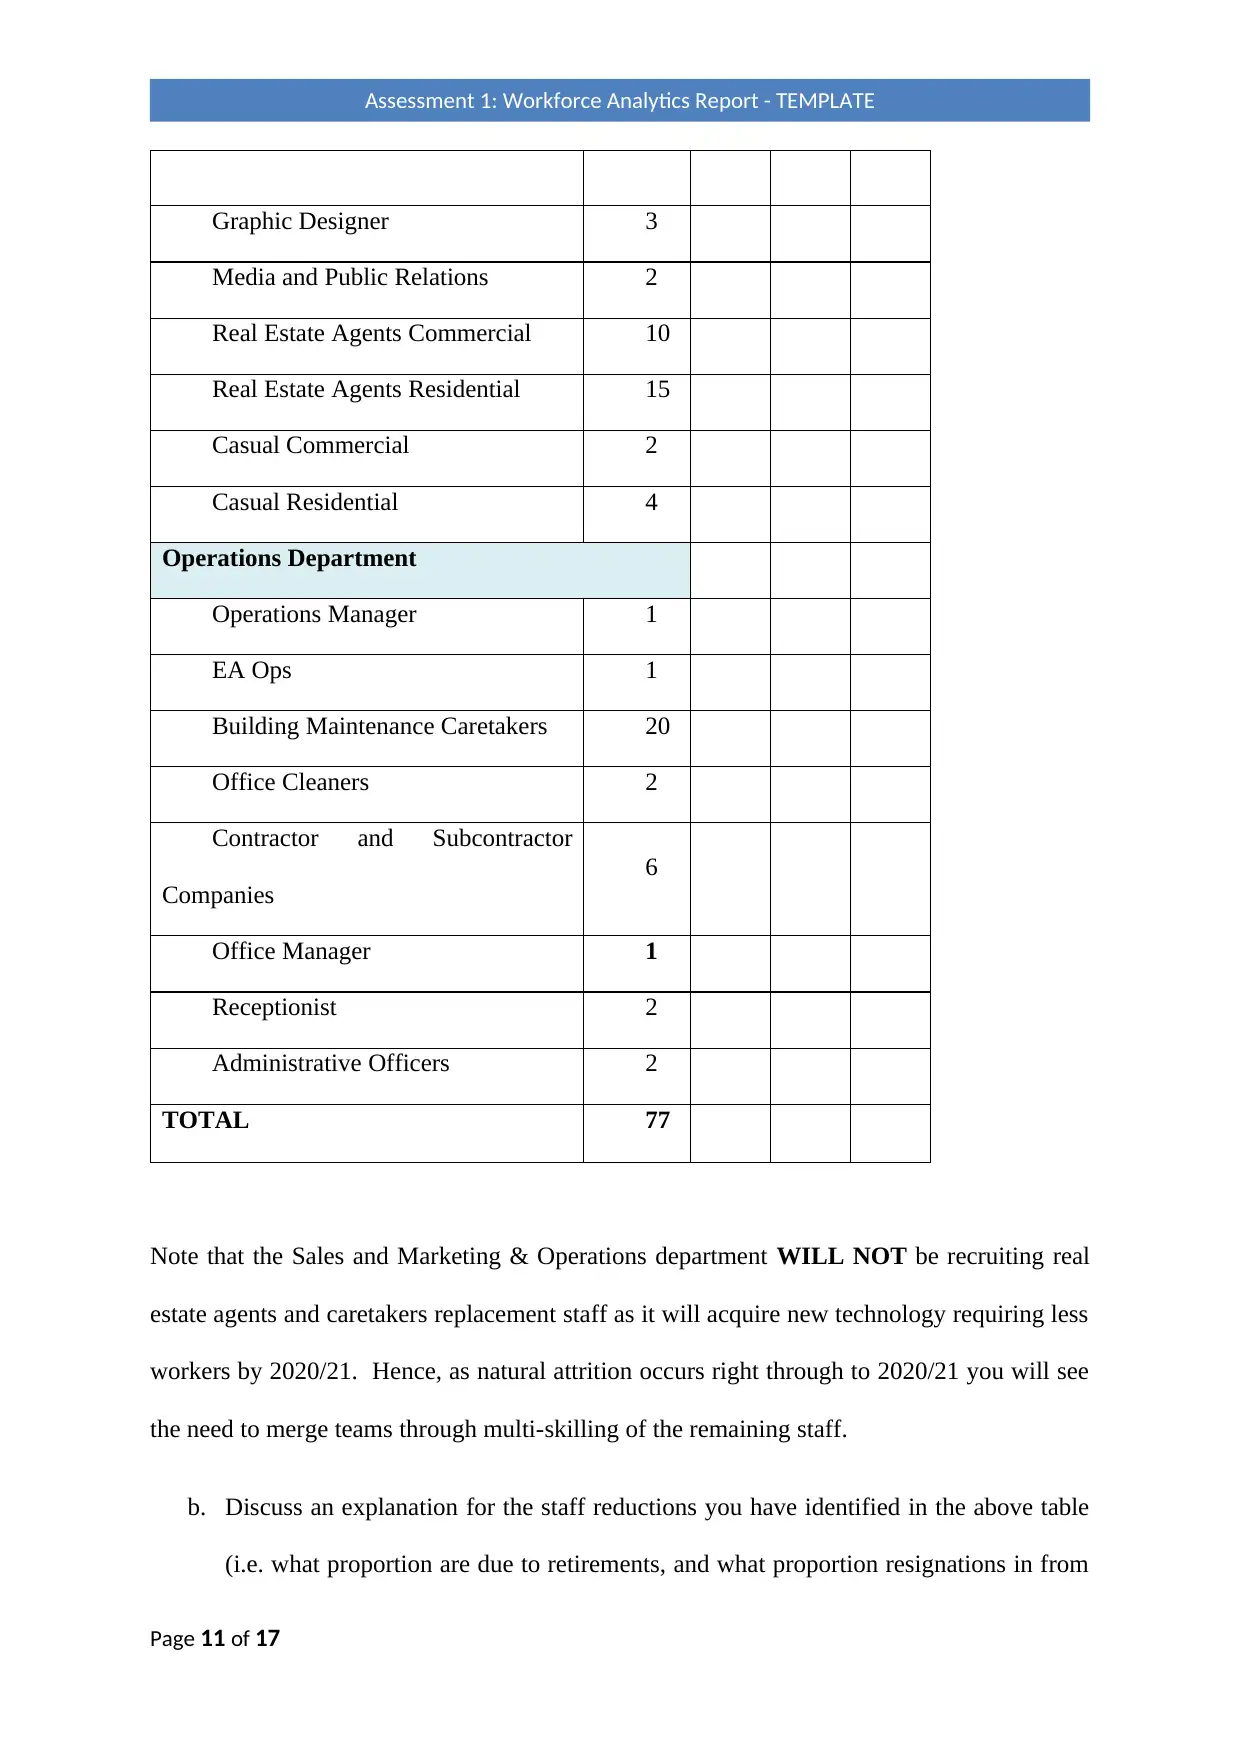
This workforce analytics report template provides a framework for analyzing workforce distribution, turnover, and future trends within Kariuki Flynn Realty. It covers key areas such as demographics, skills, jobs, retirement, and maternity leave, guiding users on calculating staff turnover and identifying supply and demand gaps due to forecasted retirements. The report emphasizes the importance of understanding current and future workforce requirements through consultations and interviews, addressing critical job roles held by retirees, and determining induction/recruitment periods. Furthermore, it explores diversity profiles, identifies staff reductions due to retirements, resignations, and redundancies, and suggests potential job role mergers. The analysis includes creating supply and demand curves for senior executive teams, manager staff retirements, and all staff in sales and marketing functions, providing a comprehensive overview of workforce dynamics and strategic planning considerations.
Document Page
Assessment 1: Workforce Analytics Report - TEMPLATE
[Document subtitle]
tabler-icon-diamond-filled.svg

Paraphrase This Document

Need a fresh take? Get an instant paraphrase of this document with our AI Paraphraser
Document Page
Table of Contents
Workforce Analytics Report......................................................................................................2
NOTE: The following TEMPLATE has been developed to guide you with developing your
Workforce Analytics Report. You are required to edit the examples, develop suitable
headings/sub-headings with corresponding discussions on your findings. The examples and
suggestions should be reviewed and developed to ensure a good flow of your discussions and
ideas in your final report. The examples are for guideline purposes ONLY.............................2
Analyse the workforce distribution and turn over in.................................................................2
Supply & Demand Trends and Gap Analysis Due to Forecast Retirements..........................3
Determine and discuss the following;-...............................................................................3
From your workforce profile, identify the future supply in 2018/19, 2019/2020, 2020/21. 5
Diversity Profile.........................................................................................................................6
Appendix
…………………………………………………………………………………………………
…………………………………….
References
…………………………………………………………………………………………………
…………………………………
Page 1 of 17
Assessment 1: Workforce Analytics Report - TEMPLATE
Document Page
Workforce Analytics Report
NOTE: The following TEMPLATE has been developed to guide you with developing your
Workforce Analytics Report. You are required to edit the examples, develop suitable
headings/sub-headings with corresponding discussions on your findings. The examples and
suggestions should be reviewed and developed to ensure a good flow of your discussions and
ideas in your final report. The examples are for guideline purposes ONLY.
The following questions are designed to help you build scenarios for your discussions
whilst performing the analysis. Read ALL instructions, pay attention to the questions,
and make sure that you address ALL the requirements. You may choose to add
headings and subheadings to your report to enable your discussions to flow. However,
ensure that all the sections of the marking criteria provided in the assessment cover-
sheet and instructions document are ALL addressed.
Question 1.
Analyse the workforce distribution and turn over in
a. Demographics (groups such as disability, gender race, sexual orientation etc.)
b. Skills
c. Jobs
d. Retirement and maternity
*For the above, identify and select the best method to calculate staff turnover and explain
your reasons.
Page 2 of 17
Assessment 1: Workforce Analytics Report - TEMPLATE
Document Page
The total number of leavers in a month is divided by the average employees in a month to
calculate employee turnover. After that, multiply the amount by 100. The significant
proportion of fortnightly labour turnover is shown on the left.
Supply & Demand Trends and Gap Analysis Due to Forecast Retirements
Assuming the future demand for the senior management team (identified by the (**) on the
Audit Report) will remain unchanged for three years identify the gap due to retirements in
the figure below:
2016/17 2016/18 2016/19 2016/20
13 13 13 13
EXAMPLE
Forecast Supply Curve - Senior
Execuive Team
Demand
Financial Year
Number of Staff
Supply?
?
e. You must complete the supply curve above for 2017/18 and 2018/19, as per the
2016/17 Audit report.
Question 2.
Determine, consult and discuss the following whilst ensuring coordination between parties; -
A consultation session should be held in class between various stakeholders.
a. Supply and demand needs of Kariuki Flynn realty™,
Page 3 of 17
Assessment 1: Workforce Analytics Report - TEMPLATE
tabler-icon-diamond-filled.svg

Paraphrase This Document

Need a fresh take? Get an instant paraphrase of this document with our AI Paraphraser
Document Page
It's difficult to strike a balance between supply and demand in the real estate market. It
takes time, effort, and a lot of work to make more saleable properties. In some cases, it
isn't possible at all, and even when it is, supply may not be able to keep up with consumer
demand in time. Understanding this fundamental economic principle can assist buyers
and sellers in determining the best time to buy or sell their homes. Allowing it can also
benefit real estate brokers and agents. The rate at which people want to buy a product is
known as demand. According to economic theory, demand is determined by two factors:
palate and purchasing power. Taste, or a person's desire for something, determines
whether or not they are willing to pay a certain price for it. To be able to buy something at
a specific price, an individual must have sufficient wealth or income. The market price
affects both demand factors. When a product's market price is high, demand will be low.
Demand is high when the price is low. Many customers are allowed to buy the product at
very low prices. People, on the other hand, usually only want so much of a decent.
Manufacturers will increase both the supply and the price of their product. Manufacturing
costs rise as a result of the short-term increase in supply, resulting in a price increase. As
a result of the price change, the desired rate of production increases. If inventory is too
high, a similar effect occurs.
b. Current and future workforce requirements through interviews and various other
tools.
Because of the rapid pace of change, employers must be proactive in ensuring that
their workforce has the skills of the future. Employers must first understand the skills
they will require to remain competitive and innovative in order to achieve this. Then
they must figure out how to best prepare and train their current workforce, as well as
how to find, recruit, and hire future talent. We'll go over the top future skills, how
Page 4 of 17
Assessment 1: Workforce Analytics Report - TEMPLATE
Document Page
technology is changing the way we work, and how businesses can prepare for the
workforce of the future in this post.
c. Which positions are subject to retirement and in what year?
d. Identify any in critical job roles held by these retirees,
e. What is the induction/recruitment period for each?
f. Provide the demand and supply curves for 2017/18, 2018/19 and 2019/20 using the
2016/17 data
Note: Forecast Supply Curve: Senior Executive Team (includes the CEO down to the
General Manager Level). This does not include Media/PR or Audit Staff.
g. Which positions are subject to retirement and in what year? Are there any in critical
job roles held by these retirees, and what is the induction/recruitment period for each?
Provide your answers below.
Supply/Demand Gap Curve: Manager Staff Retirements.
Assume that future demand for the Managers in HR, Finance and Legal Department, Sales
and Marketing, and IT will remain unchanged for three years identify the gap due to
retirements in the figure below.
Page 5 of 17
Assessment 1: Workforce Analytics Report - TEMPLATE
Document Page
h. You are to provide the demand and supply curves below.
30
20
10
0
1 1
2
Quantity 2017/18 2018/19 2019/20
Page 6 of 17
Assessment 1: Workforce Analytics Report - TEMPLATE
tabler-icon-diamond-filled.svg

Paraphrase This Document

Need a fresh take? Get an instant paraphrase of this document with our AI Paraphraser
Document Page
i. Which positions are subject to retirement and in what year? Are there any in critical
job roles held by these retirees, and what is the induction/recruitment period for each?
Provide your answers below.
j. **Sales Manager - Commercial
k. 59 yrs
l. **Sales Manager – Residential
m. 58yrs
Supply/Demand Gap Curve: All Staff in the Sales and Marketing functions.
Assume that future demand for ALL staff in the Sales and Marketing and Operations
functions will remain unchanged for three years identify the gap due to retirements.
n. You are to provide the demand and supply curves below.
60
50
40
30
20
10
0
Page 7 of 17
Assessment 1: Workforce Analytics Report - TEMPLATE
Document Page
Page 8 of 17
Assessment 1: Workforce Analytics Report - TEMPLATE
Document Page
Quantity 2017/18 2018/19 2019/20
o. Which positions are subject to retirement and in what year? Are there any in critical
job roles held by these retirees, and what is the induction/recruitment period for each?
Sales manager
Question 3.
Page 9 of 17
Assessment 1: Workforce Analytics Report - TEMPLATE
tabler-icon-diamond-filled.svg

Paraphrase This Document

Need a fresh take? Get an instant paraphrase of this document with our AI Paraphraser
Document Page
From your workforce profile, identify the future supply in 2018/19, 2019/2020, 2020/21.
Those 60 or over in 2017/18 are forecast to retire, and those currently 59 will retire in
2018/19, and those currently 58 will retire in 2019/20.
For each year 3 employees under 30 are forecast to resign. You can select which
positions will resign.
During the 2020 /21 Financial Year Kariuki Flynn realty™ intends to decrease its Sales and
Marketing & Operations staff by 10 through the redundancy process due to the introduction
of ‘Interactive Technology’.
a. In the table below, identify the staff numbers after retirements, resignations and
redundancies. You do this by placing a ‘0’ where there is a ‘1’, or subtract by the
retirements plus resignations where there is a higher number. For example, let us say
there are one retirement and two resignations (as selected by you) amongst the
assembly workers in 2017/18. Therefore, 12 becomes 9, and is in turn subtracted
from in the successive years.
Forecast Supply Trend for Sales and Marketing and Operations departments.
Job Titles
Curren
t
Numbe
r
2018
-
2019
2019
-
2020
2020
-
2021
Sales and Marketing Department
Sales Manager - Commercial 2
EA SMC 1
Sales Manager – Residential 2
EA SMR 1
Page 10 of 17
Assessment 1: Workforce Analytics Report - TEMPLATE
Document Page
Graphic Designer 3
Media and Public Relations 2
Real Estate Agents Commercial 10
Real Estate Agents Residential 15
Casual Commercial 2
Casual Residential 4
Operations Department
Operations Manager 1
EA Ops 1
Building Maintenance Caretakers 20
Office Cleaners 2
Contractor and Subcontractor
Companies
6
Office Manager 1
Receptionist 2
Administrative Officers 2
TOTAL 77
Note that the Sales and Marketing & Operations department WILL NOT be recruiting real
estate agents and caretakers replacement staff as it will acquire new technology requiring less
workers by 2020/21. Hence, as natural attrition occurs right through to 2020/21 you will see
the need to merge teams through multi-skilling of the remaining staff.
b. Discuss an explanation for the staff reductions you have identified in the above table
(i.e. what proportion are due to retirements, and what proportion resignations in from
Page 11 of 17
Assessment 1: Workforce Analytics Report - TEMPLATE
chevron_up_icon
1 out of 17
circle_padding
hide_on_mobile
zoom_out_icon
[object Object]