Sporting Events: Motives, Satisfaction & Revisit Intention Gold Coast
VerifiedAdded on 2021/05/30
|10
|3216
|60
Report
AI Summary
This report investigates the understanding of sporting events concerning motives, satisfaction, and revisit intentions, focusing on the Gold Coast. It examines demographic profiles of attendees, identifies key motives for attending, and explores the correlation between visitor satisfaction and the likelihood of return visits. The study employs quantitative methods, including frequency statistics, Pearson correlation, and t-tests, to analyze data collected from a sample of 100 participants. Results indicate that female spectators outnumbered males, and the 31-40 age group was highly represented. Satisfaction emerged as the strongest motive across all tourist groups, while excitement and intention to return varied in significance between domestic and international tourists. The report concludes with recommendations for future research, including a more thorough evaluation of attendee demographics and the exploration of additional motives influencing event attendance.
Sporting events’
understanding on the
motives, satisfaction and
intention to revisit Gold Coast
1.0 Introduction
Sporting events have gained popularity and being held worldwide since the past decades. In the
hosting countries, local markets seem to have boost due to the increased demand from the large
number of visitors from all countries across the world Kavetsos & Szymanski (2010). Variety of
products (fruits and other ready for consumption products) get increased number of sales which
is contributed to by both the players and spectators. The major focus of this research study was to
determine the sporting events’ understanding of motives, satisfaction and the intentions to revisit
the Gold Coast. The worldwide sporting events are attended by people with different motives
such as networking and socializing, shows during the halftime, for promotions and giveaways,
gaining or giving impression to people around and also the team spirit (for players) Stavros,
Meng, Westberg & Farrelly (2014). Opinions of people in regards to their level of satisfaction
vary due to a number of things that can either make them wish to revisit the place or never to
revisit the place some other time in the future. Such factors could be unfriendly environment,
boredom, weather hostility, lack of visitors’ favorite delicacies among other factors.
1.1 Research objectives
The general objective to be met in this research was to evaluate the understanding of sporting
events on motives, satisfaction and intention to revisit Gold Coast.
1.2 Specific objectives
1. To evaluate the demographic profit of visitors to the games in April, 2018
2. To determine the most important motives to the games and their significance difference
between domestic and international visitors
3. To determine the correlation between visitors’ satisfaction and intentions to return
Paraphrase This Document
Need a fresh take? Get an instant paraphrase of this document with our AI Paraphraser
2.0 Literature review
Motivation can be referred to as representation of the activated internal states that results to
arousal, direction and leading to behavior change of a person Mega, Ronconi & De Beni, (2014);
Blackwell & Pinder, (2014). Some emotional responses are subjective and such include vicarious
achievements, excitement, fantasies, having social interactions and affiliation by groups Aron et
al., (2015). Consequently, people could attend sporting events with the aim of gaining or creating
impression to others. Studies reveal that most of the researches give seldom report on the game
attendance behavior Osti, Disegna & Brida (2012). When it comes to the measure of motivation
to engage in leisurely activities, their measure could in four different dimensions which include
escape, mastery, competency and lastly socialization Neale & Funk (2006); Wann, Schrader &
Wilson (1999).
Further in this research, the motivational content facets such as the performance, excitement,
socialization diversion and esteem are the representatives to be conceptualized through spectator
motivation. These are the parsimonious group of motives that invoke people’s attendance to the
sporting events from the previous researches Yoshida, Gordon, Nakazawa & Biscaia (2014).
Satisfaction of the needs of the attendees is accompanied by some benefits particularly arising
from the group of motives Lee, Seo, & Green (2013); Funk, Filo, Beaton & Pritchard (2009).
The acronym SPEED is used in the representation of the major motivational themes that have
been aforementioned in the group of motives. Socialization can be explained as the interpersonal
aspect of sport representing the need for sociability and giving the degree to which an individual
attends sporting events with the intention of interacting with families, friends and better
proportion of the spectators Thomas, & Blackmon (2015). Performance is the measure of the
extent to which the attendees believe that sporting events results to beauty, excellence and
creativity of the athletic performance Sarkar, Fletcher & Brown, (2015); Könecke &
Kwiatkowski (2016). In regards to that, excitement is the perceived stimulation from sporting
events through experience of the spectators Yoshida, Heere & Gordon (2015). Esteem gives the
degree an individual perceives attending sporting events as means of providing opportunities for
various achievements Herstein & Berger (2013).
3.0 Research questions
3.1 Specific questions
1. What is the demographic profile of visitors to the Games in April, 2018?
2. What are the most important motives to the games and are there significance difference
between the domestic and international visitors?
3. Is there any correlation between visitors’ satisfaction and intention to return?
4.0 Research methods
This part will give the approaches that were taken in the data collection process and the
instruments used for the same. The targeted population of this research was about over 10,000
attendees at the Gold Coast where the probabilistic approach was employed in the sampling
process. The attendees (spectators) at the gold coast were randomly selected to take part in the
attending to the self-administered questionnaires to express their views in relation to the
questions’ demands. Seven items with five Likert scaled questions were used where the
respondents were to choose their levels of agreement, satisfaction and certainty in regards to the
sporting events at Gold Coast. Simple random sampling technique was employed by the
researcher in the selection of a sample of 100 participants who completely filled the
questionnaires. Quantitative data was preferable in this research since the main objectives of this
research was to give inferential results that could be tangible and dependable.
For data analysis, the collected data were organized, entered into excel and cleaned in
preparation of the data analysis process. Frequency statistics was used in the representation of
the categorical data for easy understanding and interpretations. For the test of correlation
between the variables, Pearson correlation coefficient was used. Furthermore, t-test was carried
out to determine the existing differences in motives between domestic and international tourists.
⊘ This is a preview!⊘
Do you want full access?
Subscribe today to unlock all pages.
Trusted by 1+ million students worldwide
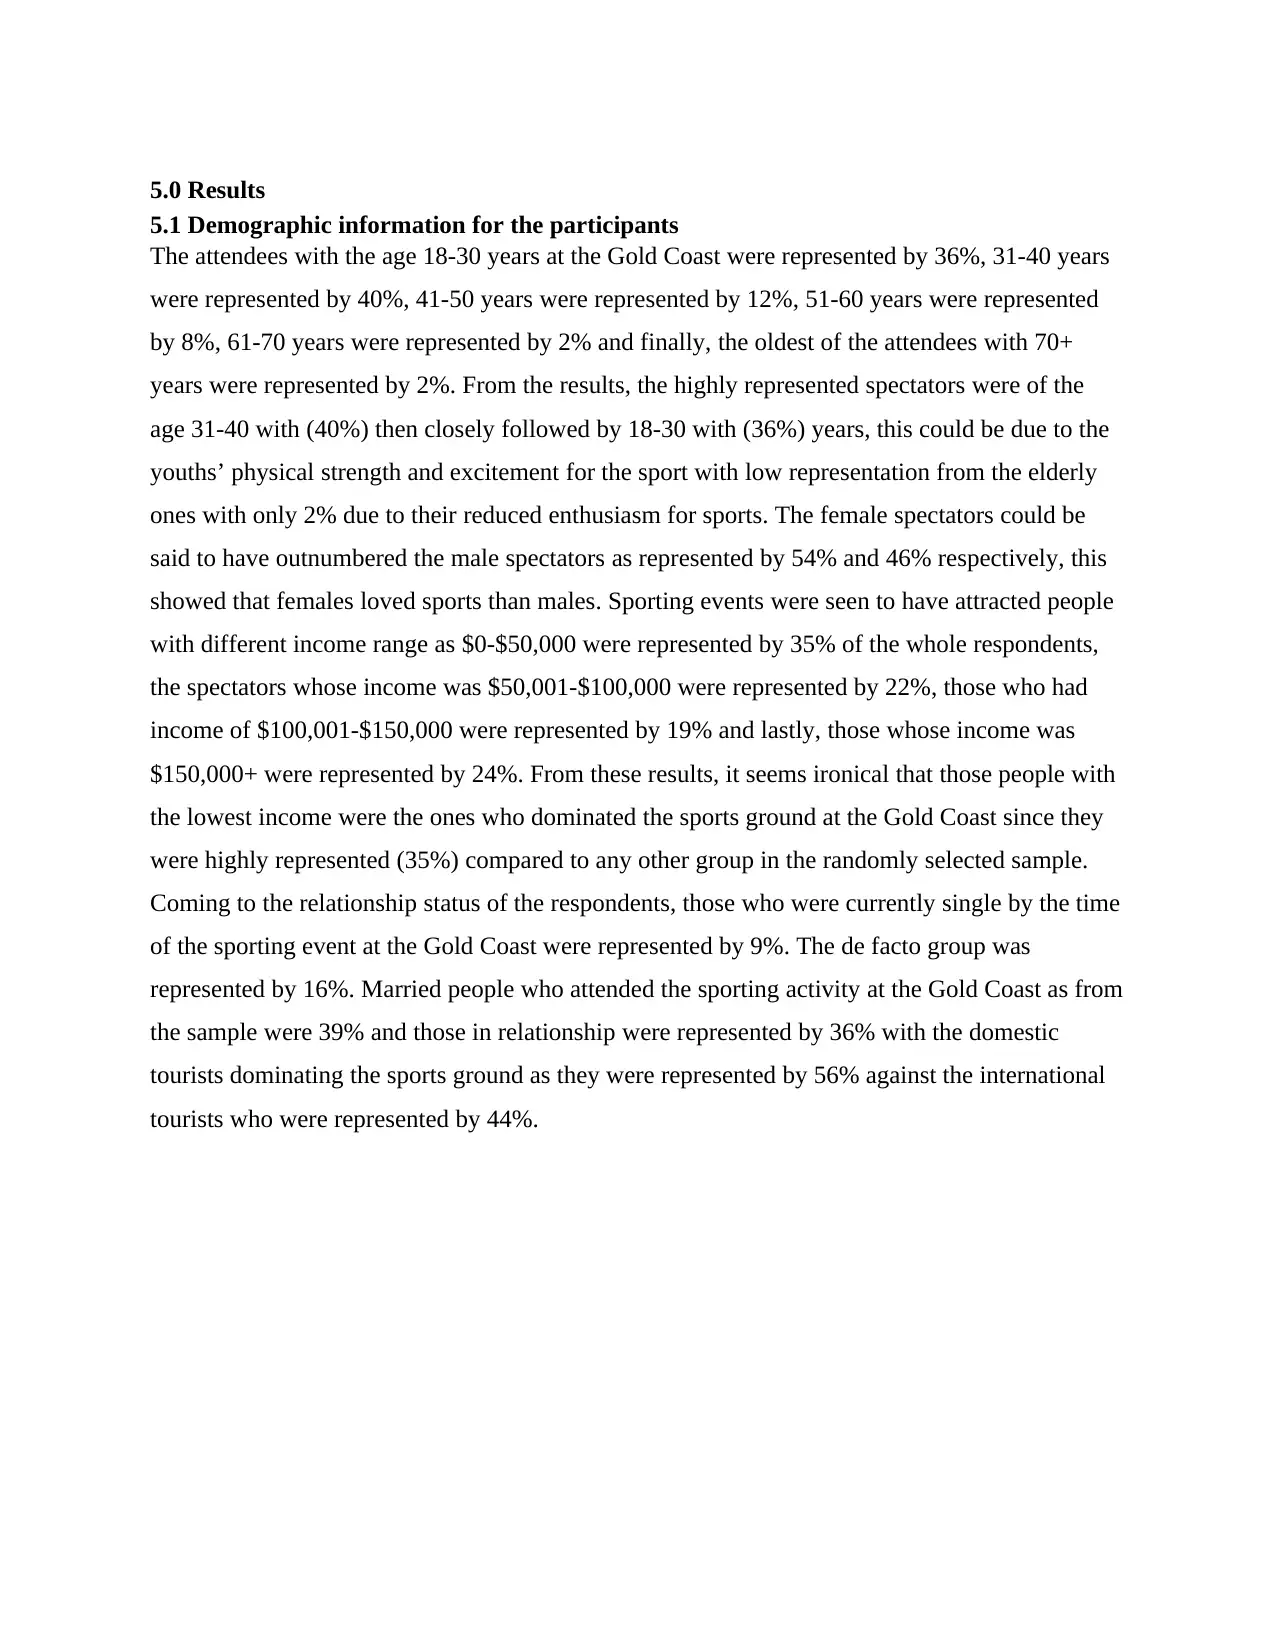
5.0 Results
5.1 Demographic information for the participants
The attendees with the age 18-30 years at the Gold Coast were represented by 36%, 31-40 years
were represented by 40%, 41-50 years were represented by 12%, 51-60 years were represented
by 8%, 61-70 years were represented by 2% and finally, the oldest of the attendees with 70+
years were represented by 2%. From the results, the highly represented spectators were of the
age 31-40 with (40%) then closely followed by 18-30 with (36%) years, this could be due to the
youths’ physical strength and excitement for the sport with low representation from the elderly
ones with only 2% due to their reduced enthusiasm for sports. The female spectators could be
said to have outnumbered the male spectators as represented by 54% and 46% respectively, this
showed that females loved sports than males. Sporting events were seen to have attracted people
with different income range as $0-$50,000 were represented by 35% of the whole respondents,
the spectators whose income was $50,001-$100,000 were represented by 22%, those who had
income of $100,001-$150,000 were represented by 19% and lastly, those whose income was
$150,000+ were represented by 24%. From these results, it seems ironical that those people with
the lowest income were the ones who dominated the sports ground at the Gold Coast since they
were highly represented (35%) compared to any other group in the randomly selected sample.
Coming to the relationship status of the respondents, those who were currently single by the time
of the sporting event at the Gold Coast were represented by 9%. The de facto group was
represented by 16%. Married people who attended the sporting activity at the Gold Coast as from
the sample were 39% and those in relationship were represented by 36% with the domestic
tourists dominating the sports ground as they were represented by 56% against the international
tourists who were represented by 44%.
Paraphrase This Document
Need a fresh take? Get an instant paraphrase of this document with our AI Paraphraser
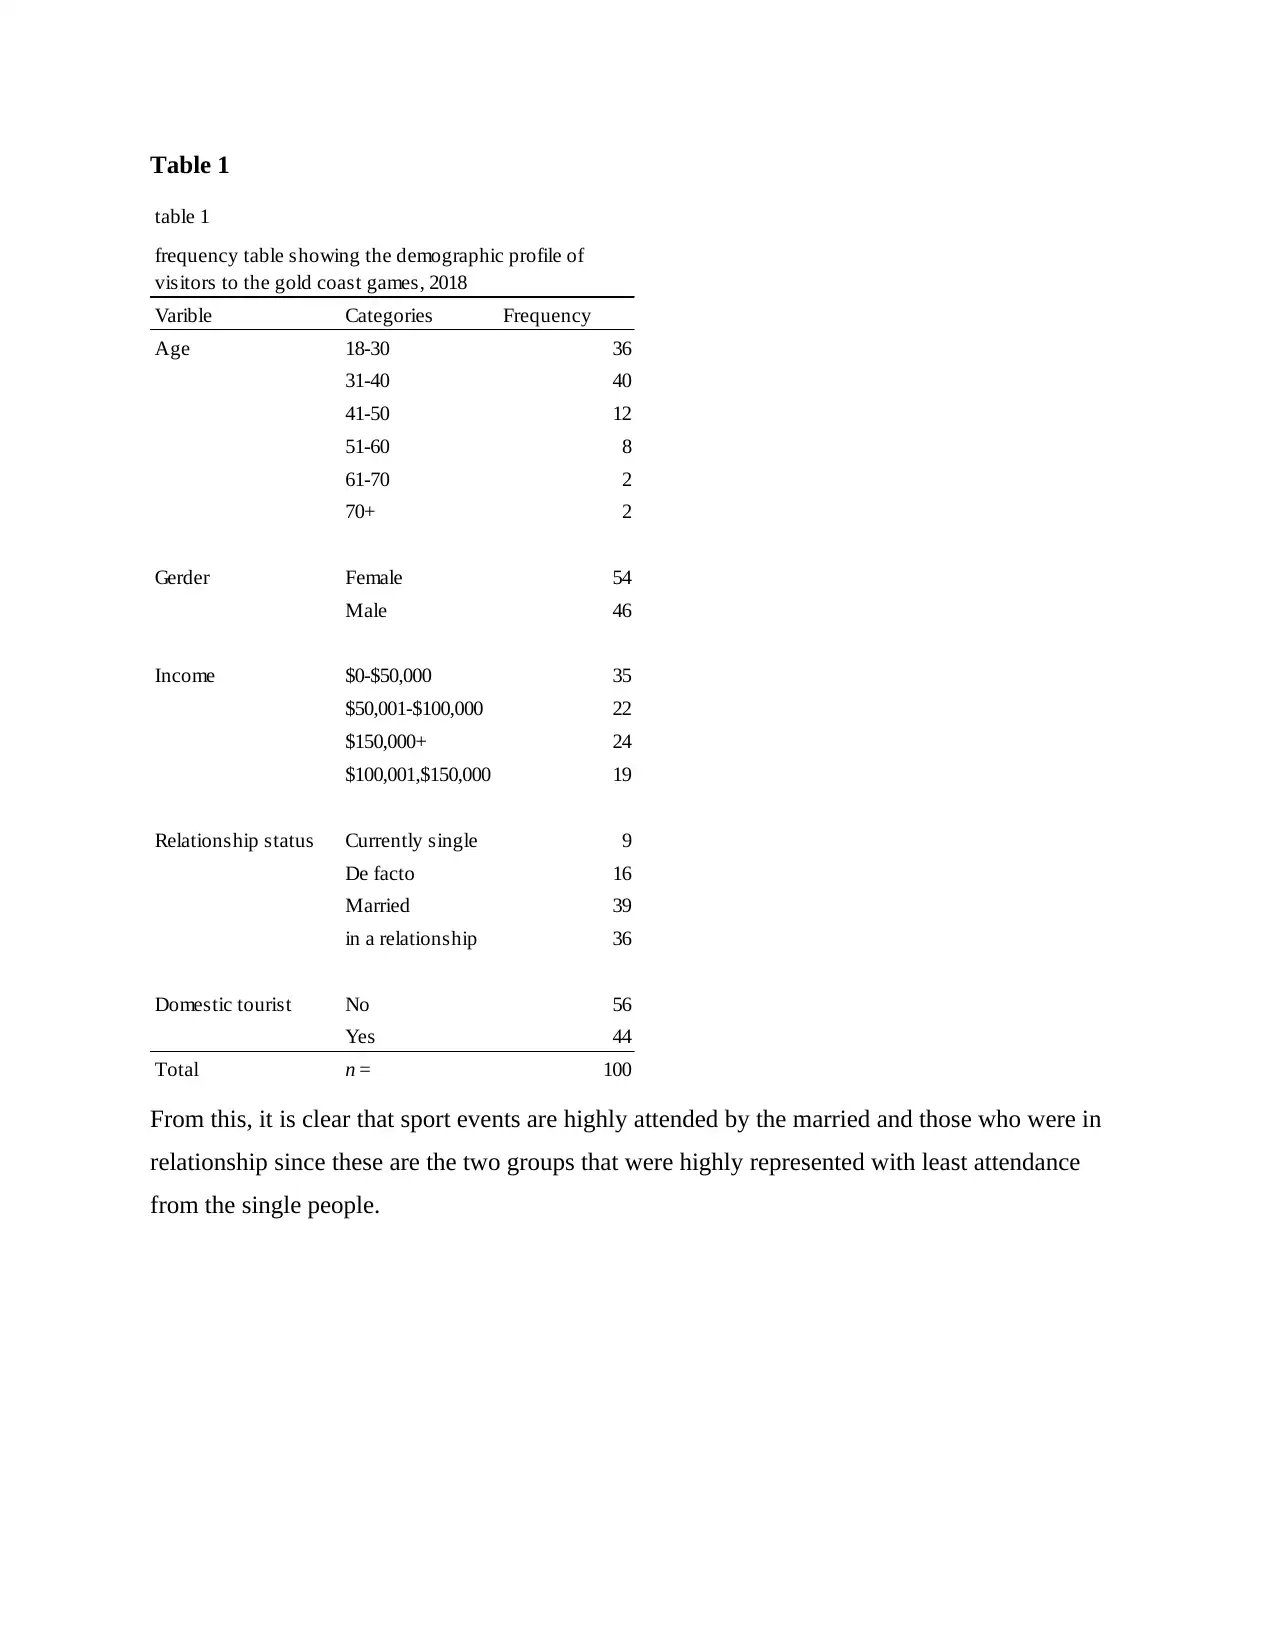
Table 1
table 1
Varible Categories Frequency
Age 18-30 36
31-40 40
41-50 12
51-60 8
61-70 2
70+ 2
Gerder Female 54
Male 46
Income $0-$50,000 35
$50,001-$100,000 22
$150,000+ 24
$100,001,$150,000 19
Relationship status Currently single 9
De facto 16
Married 39
in a relationship 36
Domestic tourist No 56
Yes 44
Total n = 100
frequency table showing the demographic profile of
visitors to the gold coast games, 2018
From this, it is clear that sport events are highly attended by the married and those who were in
relationship since these are the two groups that were highly represented with least attendance
from the single people.
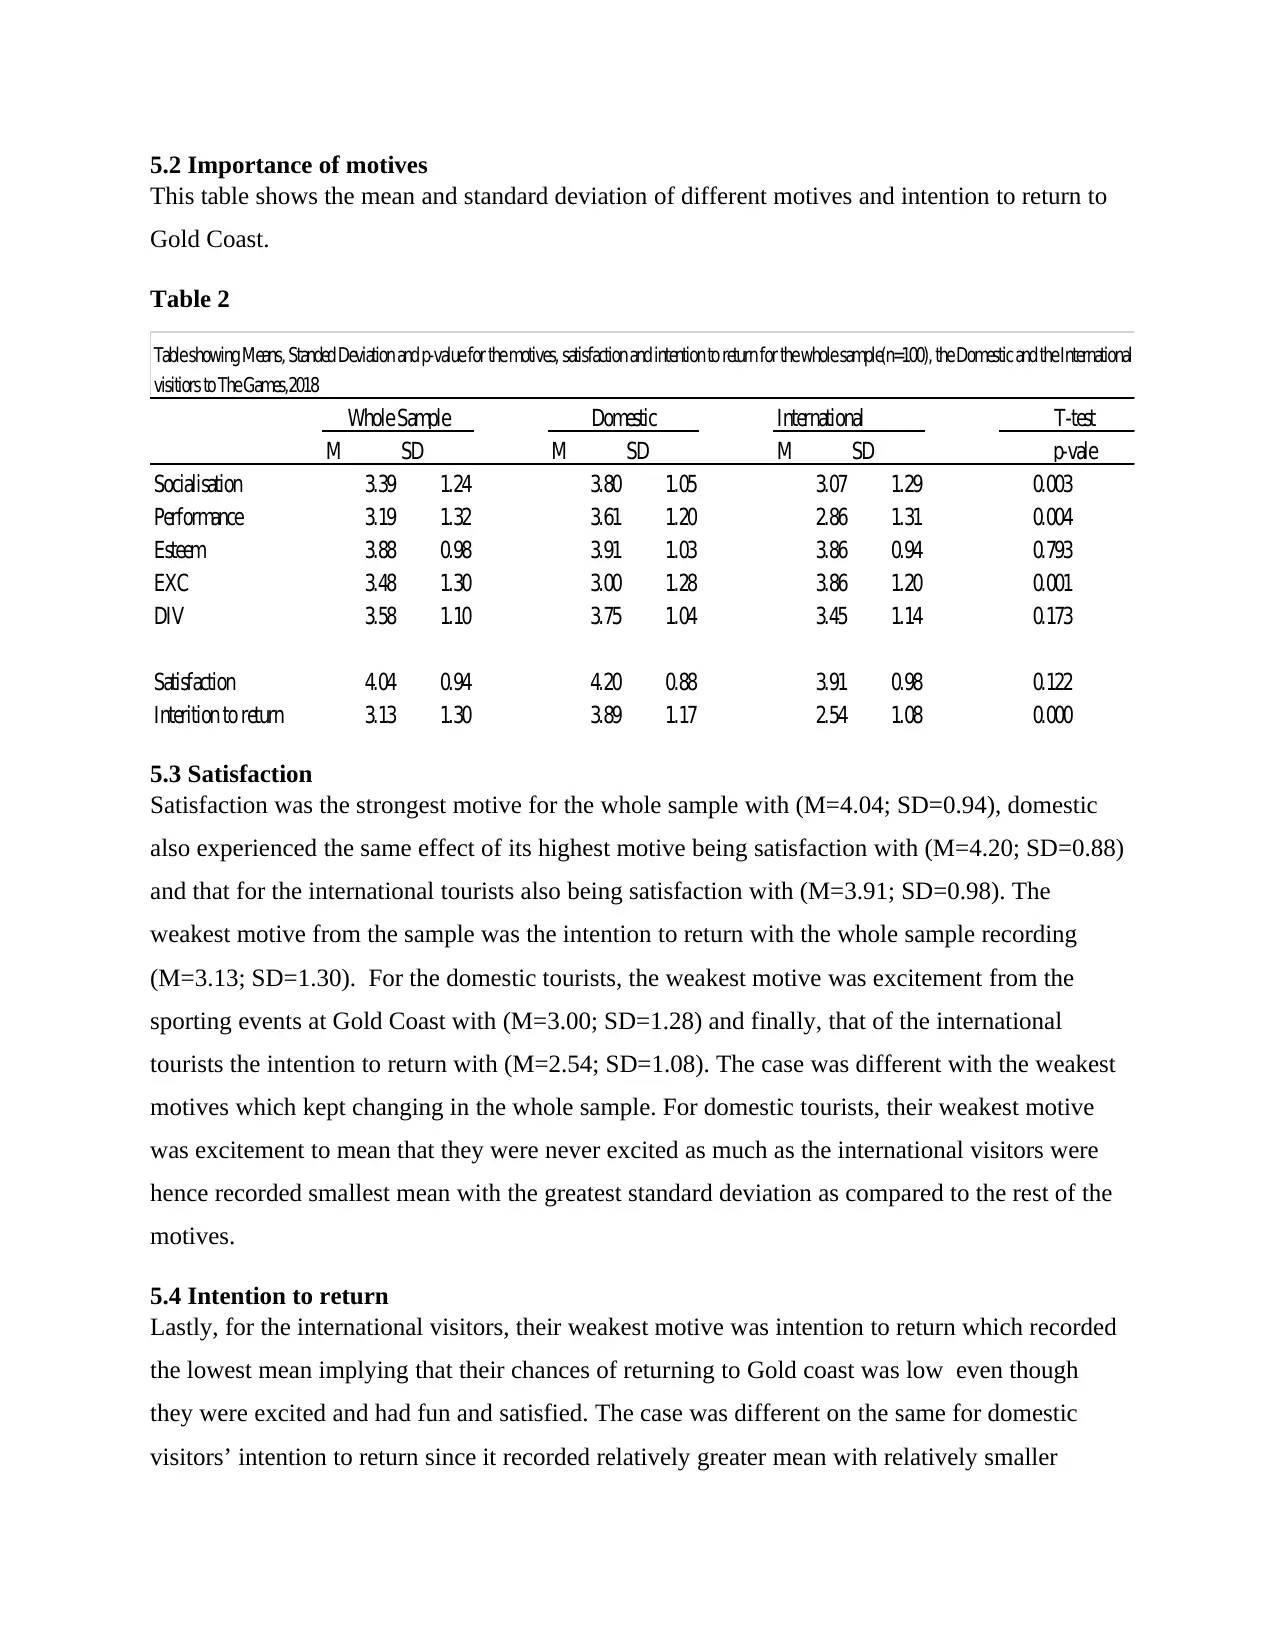
5.2 Importance of motives
This table shows the mean and standard deviation of different motives and intention to return to
Gold Coast.
Table 2
Table 2
International
M SD M SD M SD
Socialisation 3.39 1.24 3.80 1.05 3.07 1.29 0.003
Performance 3.19 1.32 3.61 1.20 2.86 1.31 0.004
Esteem 3.88 0.98 3.91 1.03 3.86 0.94 0.793
EXC 3.48 1.30 3.00 1.28 3.86 1.20 0.001
DIV 3.58 1.10 3.75 1.04 3.45 1.14 0.173
Satisfaction 4.04 0.94 4.20 0.88 3.91 0.98 0.122
Interition to return 3.13 1.30 3.89 1.17 2.54 1.08 0.000
DomesticWhole Sample T-test
p-vale
Tableshowing Means, Standed Deviation and p-valuefor themotives, satisfaction and intention to return for thewholesample(n=100), theDomestic and theInternational
visitiors to TheGames,2018
5.3 Satisfaction
Satisfaction was the strongest motive for the whole sample with (M=4.04; SD=0.94), domestic
also experienced the same effect of its highest motive being satisfaction with (M=4.20; SD=0.88)
and that for the international tourists also being satisfaction with (M=3.91; SD=0.98). The
weakest motive from the sample was the intention to return with the whole sample recording
(M=3.13; SD=1.30). For the domestic tourists, the weakest motive was excitement from the
sporting events at Gold Coast with (M=3.00; SD=1.28) and finally, that of the international
tourists the intention to return with (M=2.54; SD=1.08). The case was different with the weakest
motives which kept changing in the whole sample. For domestic tourists, their weakest motive
was excitement to mean that they were never excited as much as the international visitors were
hence recorded smallest mean with the greatest standard deviation as compared to the rest of the
motives.
5.4 Intention to return
Lastly, for the international visitors, their weakest motive was intention to return which recorded
the lowest mean implying that their chances of returning to Gold coast was low even though
they were excited and had fun and satisfied. The case was different on the same for domestic
visitors’ intention to return since it recorded relatively greater mean with relatively smaller
⊘ This is a preview!⊘
Do you want full access?
Subscribe today to unlock all pages.
Trusted by 1+ million students worldwide
standard deviation (i.e. 3.89 and 1.17) respectively. That was to mean that domestic visitors were
most likely to return to Gold Coast than the international visitors.
5.5 T-test results
The t-test was conducted to check for the significant difference existing between motives for the
domestic tourists and the international tourists. In regards to that test, (p=0.003) showed that
difference existed in socialization between the domestic tourists and international tourists. This
could be as a result that the domestic visitors were familiar with the place thus they could easily
socialize than the international visitors. There was also significance difference in the
performance between the domestic visitors and the international visitors since (p=0.004).
Excitement between the domestic tourists and the international tourists showed some significant
difference since (p=0.001). Finally, the intention to return to Gold Coast also showed to there
being significant difference between domestic tourists and the international tourists since
(P<0.05) as in table 2.
5.6 Correlations
Correlation was the test conducted to check for the strength of relationship that existed between
satisfaction and intension to revisit Gold Coast for the two levels of tourist groups (domestic and
international) tourists. Correlation coefficient between satisfaction of both groups of visitors and
their intention to revisit Gold Coast was (r=0.01). This display showed a very weak positive
correlation between the two variables for the two groups in the sample since the value was too
small and closer to zero. If the value is made negligible, then it could be concluded that no
correlation existed between satisfaction and future intension to revisit Gold Cost for the two
groups of tourists. Correlation coefficient between satisfaction and domestic tourists’ intention to
revisit Gold Coast was (r=-0.23) which showed a weak negative relationship. Finally, the
correlation between satisfaction of the international tourists and their intention to revisit Gold
Coast was (r=0.03), which showed a very weak positive correlation.
5.8 Conclusion
From the results in this research, it can be concluded that females loved the sporting activities
than their male counterpart. Most of the spectators were seen to those whose ages were either
forty or below. Among the motives tested, the strongest of them all in all groups of tourists
(domestic and international) was satisfaction whereas the weakest motives varied between the
groups with domestic tourists having posting excitement and the international tourists posting
Paraphrase This Document
Need a fresh take? Get an instant paraphrase of this document with our AI Paraphraser
intention to return. Significant difference existed between a number of motives such as
socialization for the domestic and international tourists, performance, excitement and the
intention to revisit Gold Coast between domestic and international tourists. Weak positive
correlation existed between satisfaction and intention of the international tourists to revisit Gold
Coast whereas negative correlation existed between satisfaction and their intention to revisit
Gold Coast.
6.0 Recommendations
1. It is recommended that in the future, demographic profile of the attendees be thoroughly
evaluated.
2. It is also recommended that other motives be determined and their significant differences
be made clear for both groups (domestic and international tourists).
3. The future management should bank their efforts on the possible existence of relationship
between satisfaction and the intention of the visitors to revisit the place of the event.
7.0 Limitations of the study
This study was basically based and focused on meeting three objectives which were not limited
to evaluation of the demographic information of those people visiting the places where games are
played, to determine some of the most important motives and their significance between the
domestic visitors and international visitors and lastly the study was as well aimed at determining
the relationship in satisfaction of the visitors and their intention to return to the hosting place.
This did not capture what could be steering the return of visitors to the place or never to return at
all any other time in future. The factors resulting to the variation in levels of satisfaction of both
domestic and international visitors was not discussed in this report. The future research should
therefore focus in revealing the factors leading to variation in the levels of satisfaction of the
visitors in case of the sporting events.
References
Aron, A., Fisher, H., Mashek, D. J., Strong, G., Li, H., & Brown, L. L. (2005). Reward,
motivation, and emotion systems associated with early-stage intense romantic
love. Journal of neurophysiology, 94(1), 327-337.
Blackwell, E., & Pinder, P. (2014). What are the motivational factors of first-generation minority
college students who overcome their family histories to pursue higher
education?. College Student Journal, 48(1), 45-56.
Funk, D. C., Filo, K., Beaton, A. A., & Pritchard, M. (2009). Measuring the motives of sport
event attendance: Bridging the academic-practitioner divide to understanding
behavior. Sport Marketing Quarterly, 18(3), 126.
Herstein, R., & Berger, R. (2013). Much more than sports: sports events as stimuli for city re-
branding. Journal of Business Strategy, 34(2), 38-44.
Kavetsos, G., & Szymanski, S. (2010). National well-being and international sports
events. Journal of Economic Psychology, 31(2), 158-171.
Könecke, T., & Kwiatkowski, G. (2016). Why do people attend sport events at mature tourist
destinations? an analysis of visitors' motivation to attend the windsurf world cup on
sylt. Polish Journal of Sport and Tourism, 23(2), 104-112.
doi:http://dx.doi.org.libraryproxy.griffith.edu.au/10.1515/pjst-2016-0013
Lee, S., Seo, W. J., & Green, B. C. (2013). Understanding why people play fantasy sport:
Development of the fantasy sport motivation inventory (FanSMI). European Sport
Management Quarterly, 13(2), 166-199.
Mega, C., Ronconi, L., & De Beni, R. (2014). What makes a good student? How emotions, self-
regulated learning, and motivation contribute to academic achievement. Journal of
Educational Psychology, 106(1), 121.
Neale, L., & Funk, D. (2006). Investigating motivation, attitudinal loyalty and attendance
behaviour with fans of Australian football. International Journal of Sports Marketing
and Sponsorship, 7(4), 12-22.
Osti, L., Disegna, M., & Brida, J. G. (2012). Repeat visits and intentions to revisit a sporting
event and its nearby destinations. Journal of Vacation Marketing, 18(1), 31-42.
Sarkar, M., Fletcher, D., & Brown, D. J. (2015). What doesn’t kill me…: adversity-related
experiences are vital in the development of superior Olympic performance. Journal of
Science and Medicine in Sport, 18(4), 475-479.
Stavros, C., Meng, M. D., Westberg, K., & Farrelly, F. (2014). Understanding fan motivation for
interacting on social media. Sport management review, 17(4), 455-469.
⊘ This is a preview!⊘
Do you want full access?
Subscribe today to unlock all pages.
Trusted by 1+ million students worldwide
Thomas, A. J., & Blackmon, S. K. M. (2015). The influence of the Trayvon Martin shooting on
racial socialization practices of African American parents. Journal of Black
Psychology, 41(1), 75-89.
Wann, D. L., Schrader, M. P., & Wilson, A. M. (1999). Sport fan motivation: Questionnarie
validation, comparisons by sport, and relationship to athletic motivation. Journal of
Sport Behavior, 22(1), 114-139. Retrieved
from http://search.proquest.com.libraryproxy.griffith.edu.au/docview/215877417?
accountid=14543
Yoshida, M., Gordon, B., Nakazawa, M., & Biscaia, R. (2014). Conceptualization and
measurement of fan engagement: Empirical evidence from a professional sport
context. Journal of Sport Management, 28(4), 399-417.
Yoshida, M., Heere, B., & Gordon, B. (2015). Predicting behavioral loyalty through community:
Why other fans are more important than our own intentions, our satisfaction, and the
team itself. Journal of Sport Management, 29(3), 318-333.
1 out of 10


Your All-in-One AI-Powered Toolkit for Academic Success.
+13062052269
info@desklib.com
Available 24*7 on WhatsApp / Email
![[object Object]](/_next/static/media/star-bottom.7253800d.svg)
Unlock your academic potential
Copyright © 2020–2026 A2Z Services. All Rights Reserved. Developed and managed by ZUCOL.