Melbourne Polytechnic: Zone-Wise Analysis of Expenses & Purchases
VerifiedAdded on 2023/06/03
|20
|4197
|164
Report
AI Summary
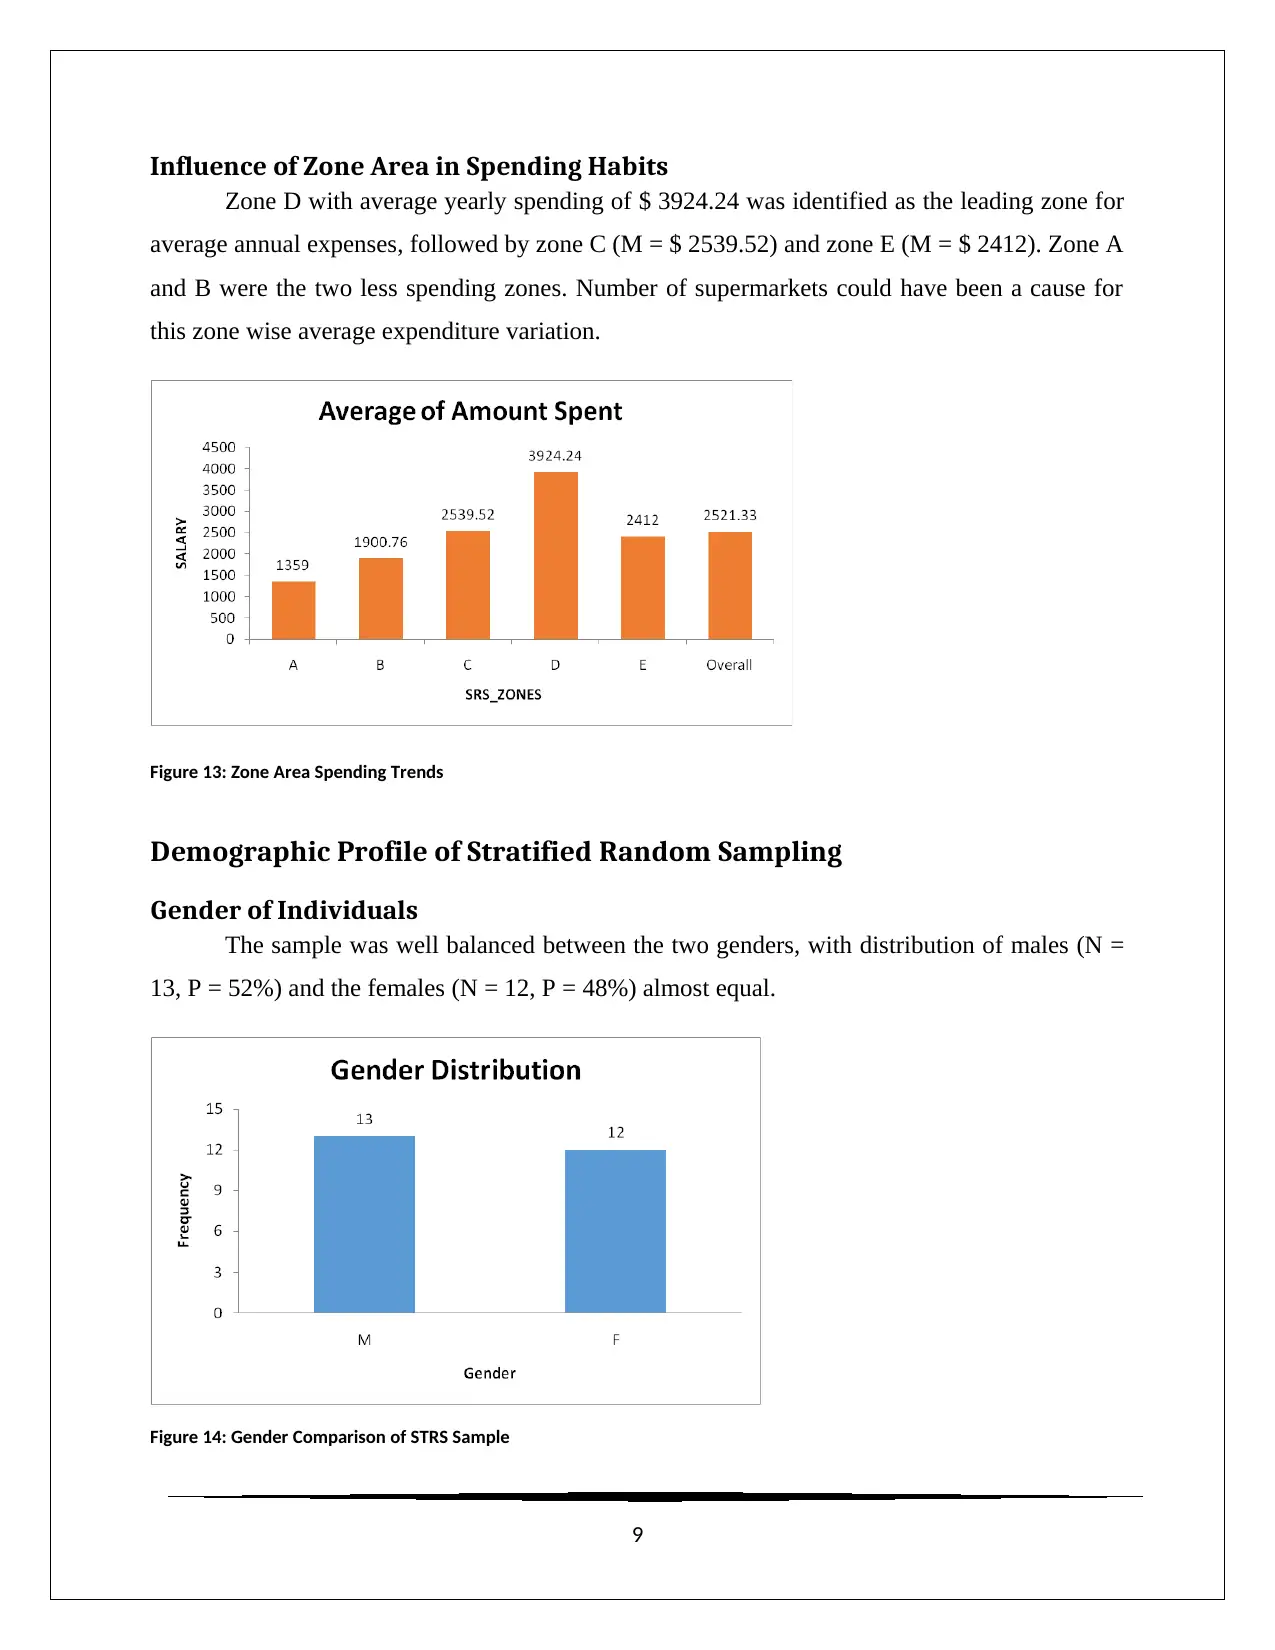
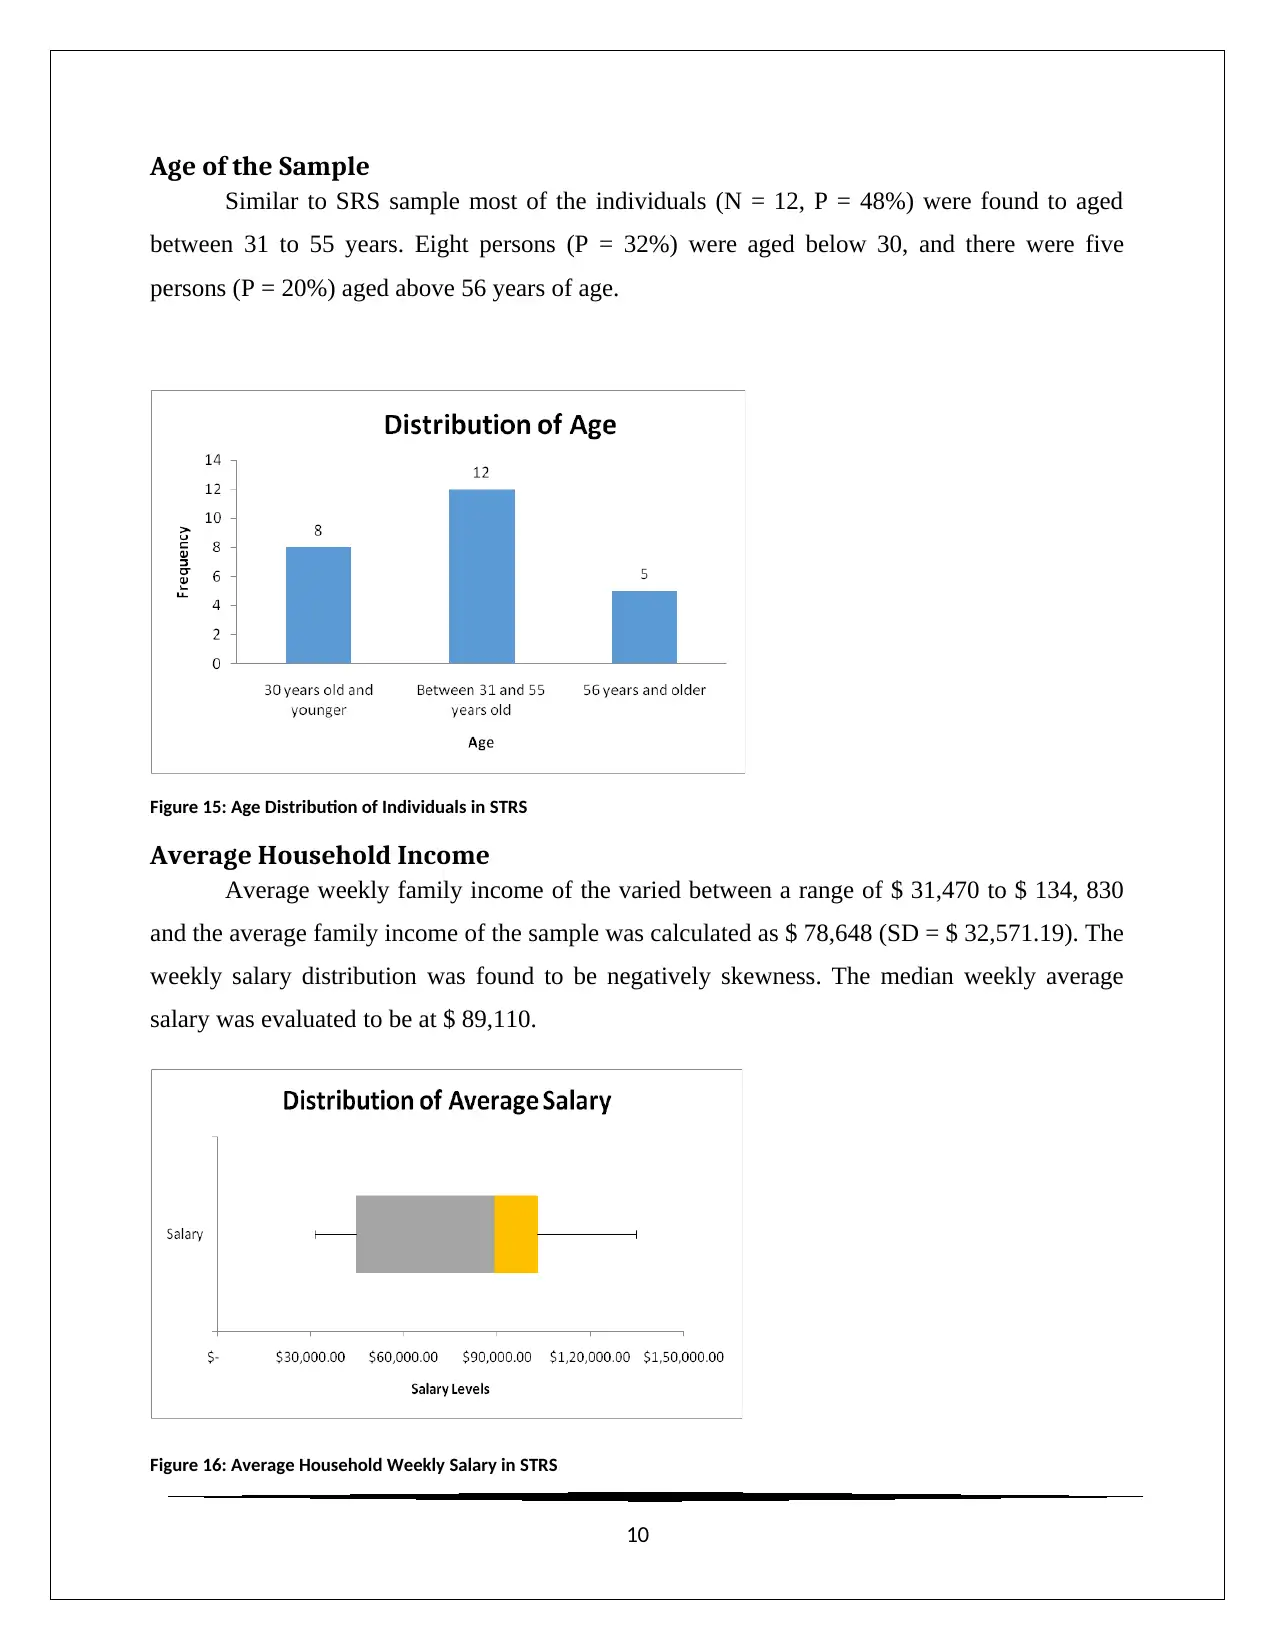
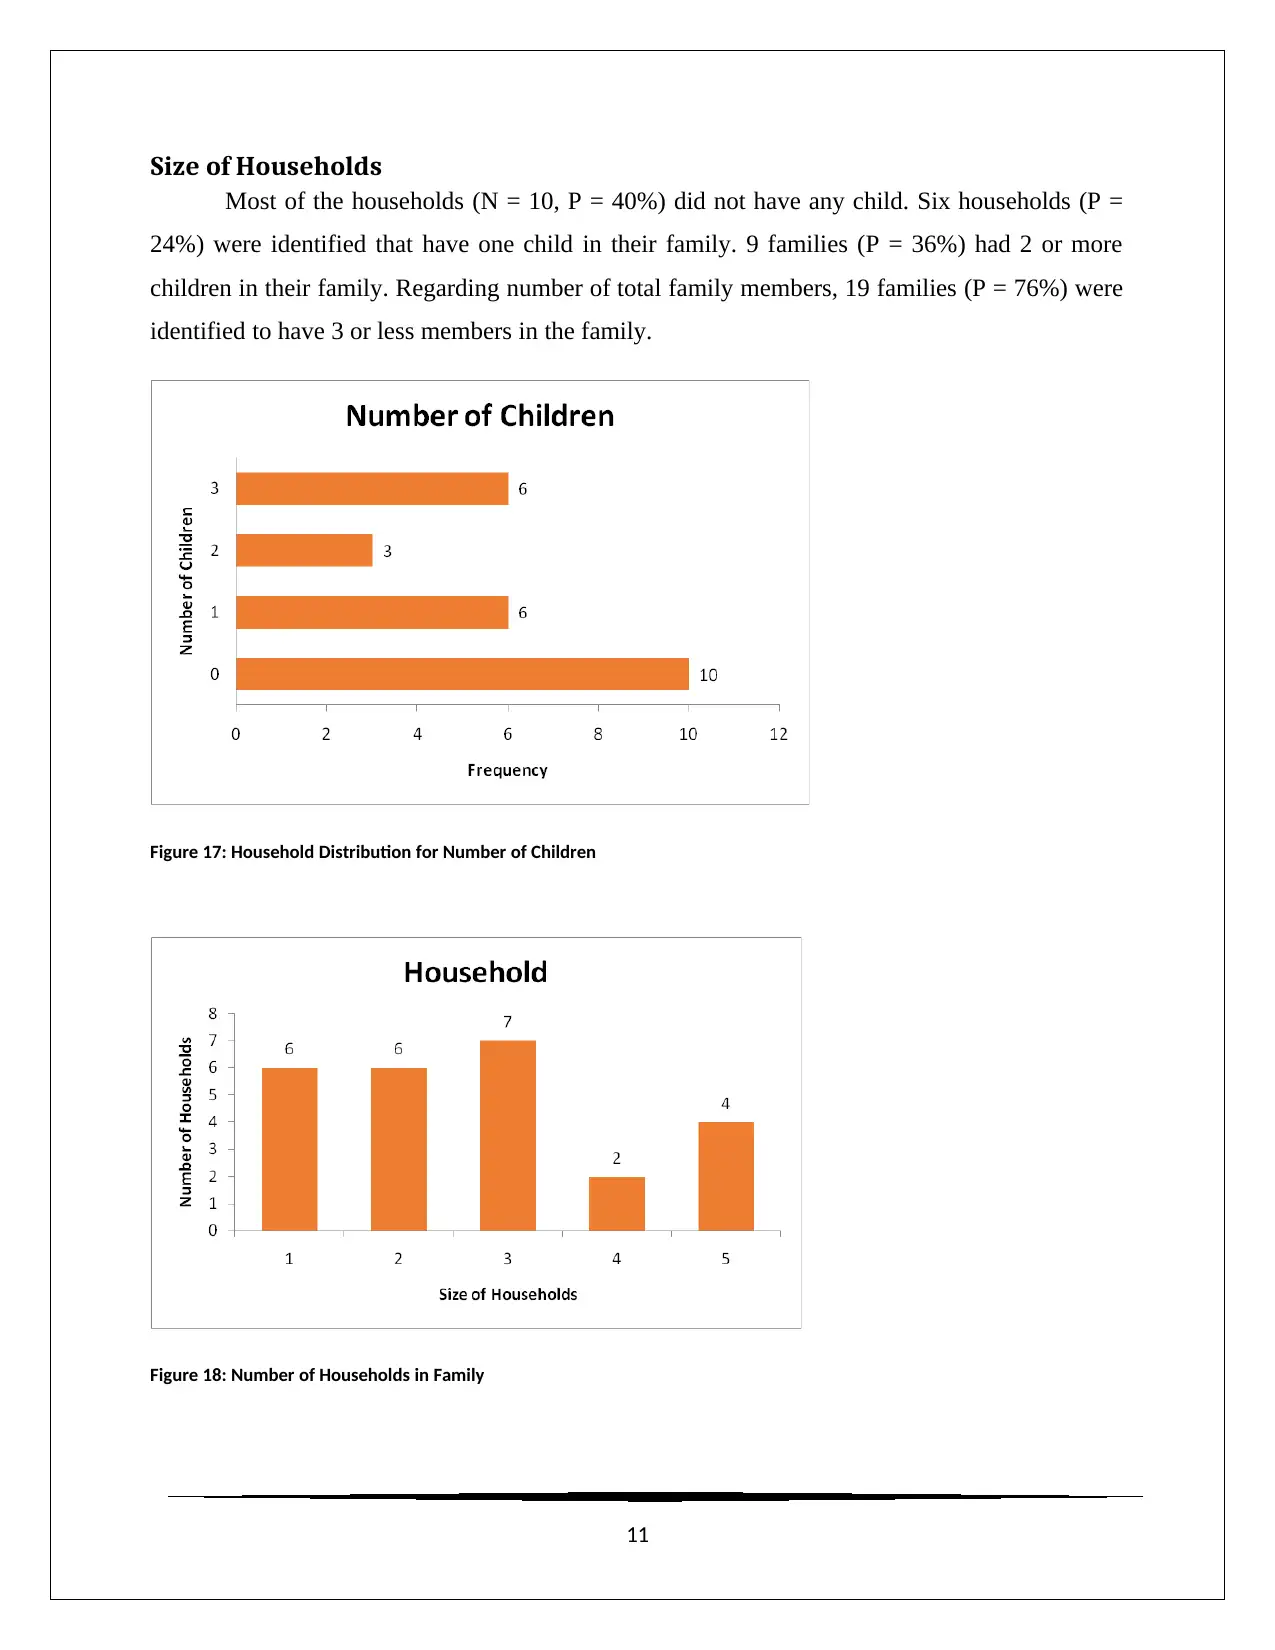
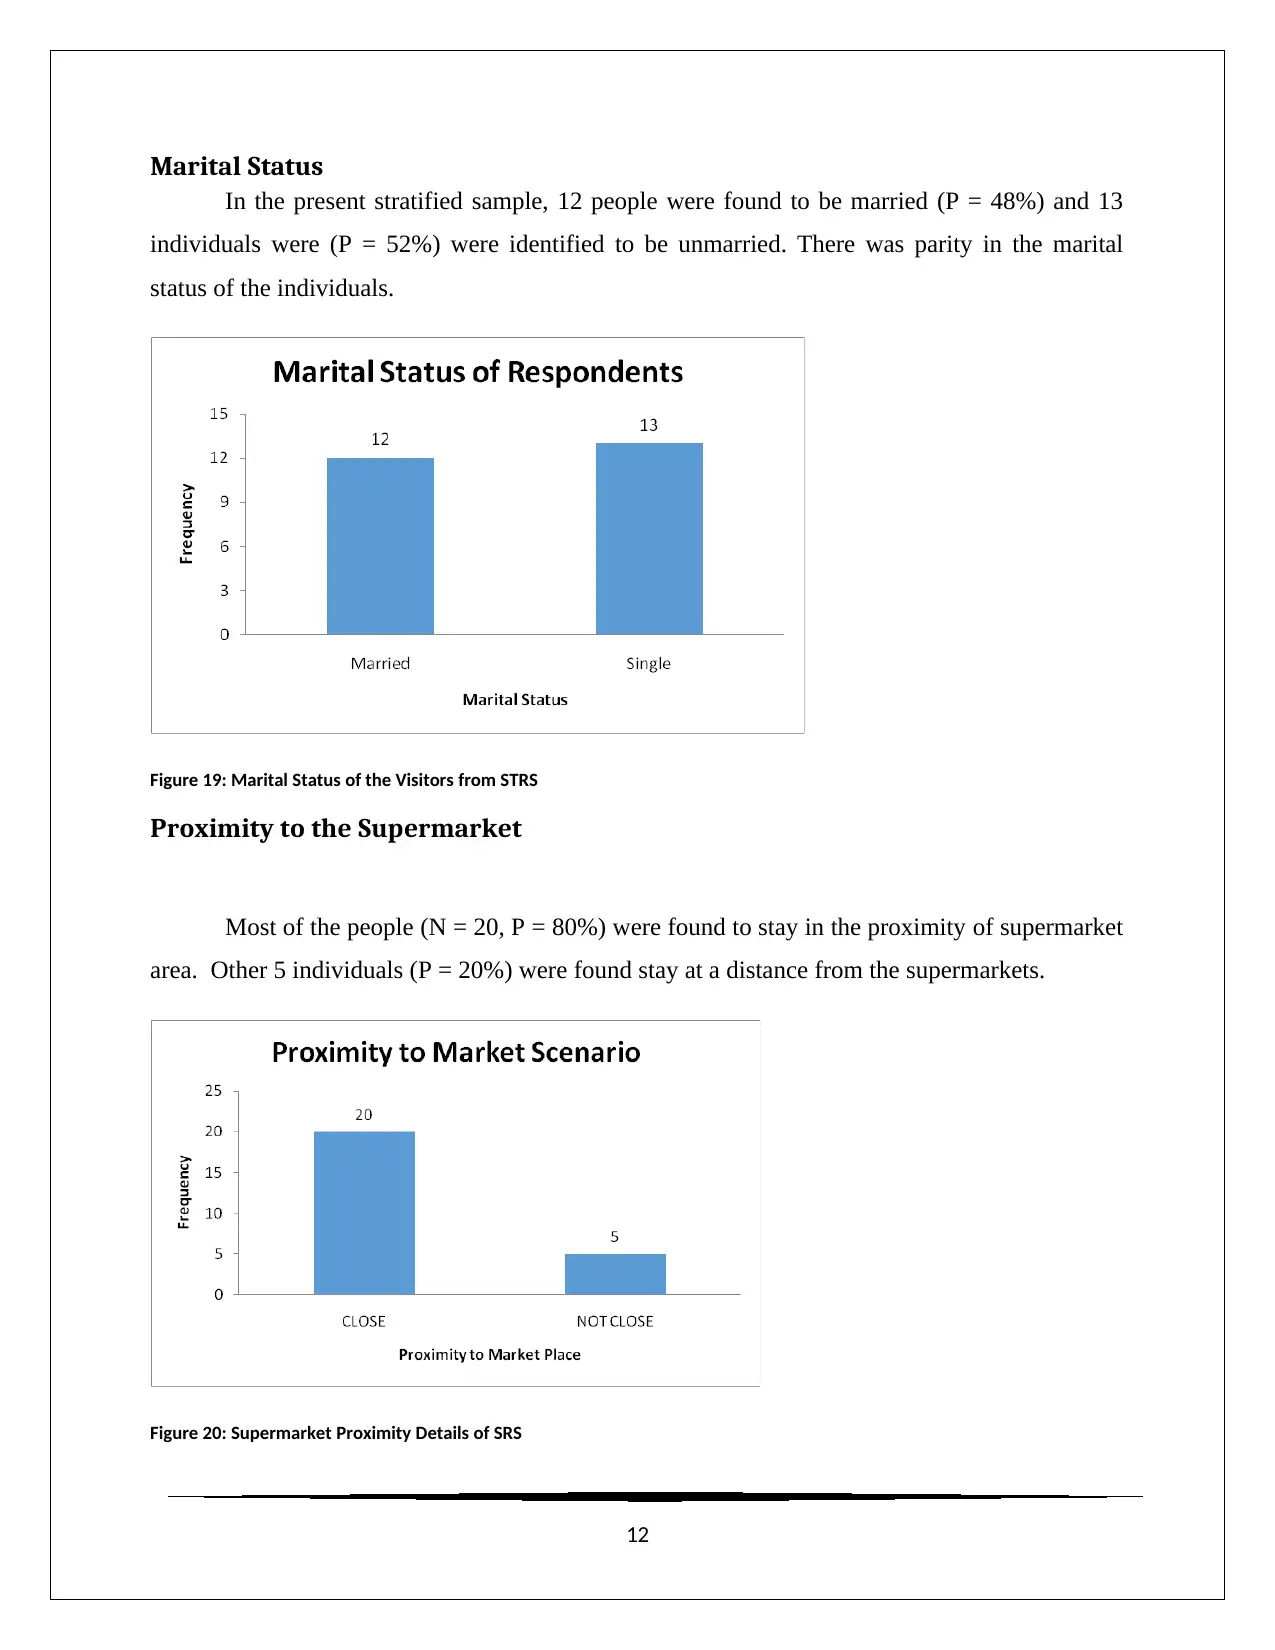
This report analyzes the relationship between individuals' yearly expenses and their supermarket purchases, categorized by zone. Two samples, one using Simple Random Sampling (SRS) and the other using Stratified Random Sampling (STRS), were collected from a population of 1000 individuals. The study examines demographic profiles, including gender, age, household income, and marital status, and their influence on spending habits. Key findings include the impact of zone area on spending, comparisons of male and female salaries, and an inferential analysis testing the supermarket chain's claim about the possibility of increased expenditure towards service improvement based on yearly average spending. The report provides detailed descriptive profiles of both the SRS and STRS samples, highlighting differences in average yearly purchases, debt levels, and proportion of debt to income, offering insights into consumer behavior and spending patterns.
1 out of 20


Your All-in-One AI-Powered Toolkit for Academic Success.
+13062052269
info@desklib.com
Available 24*7 on WhatsApp / Email
![[object Object]](/_next/static/media/star-bottom.7253800d.svg)
Copyright © 2020–2026 A2Z Services. All Rights Reserved. Developed and managed by ZUCOL.