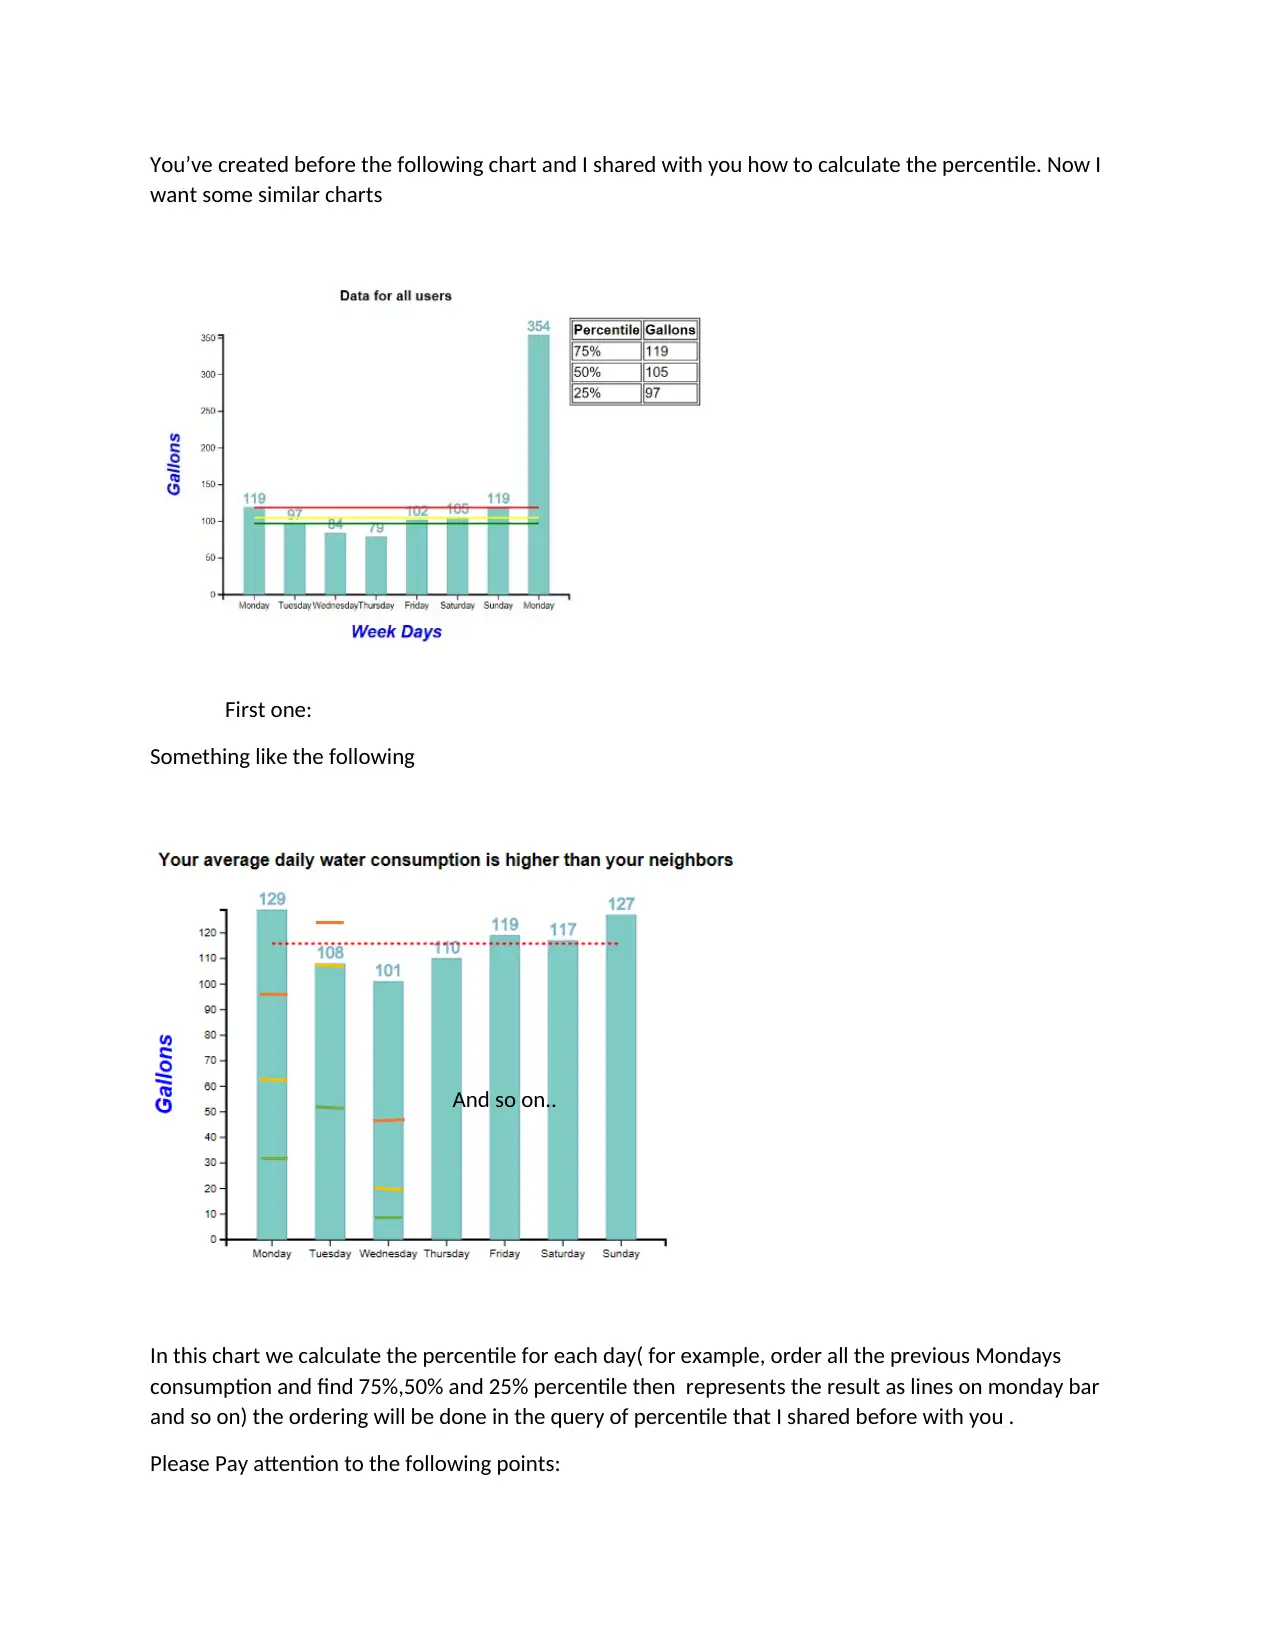
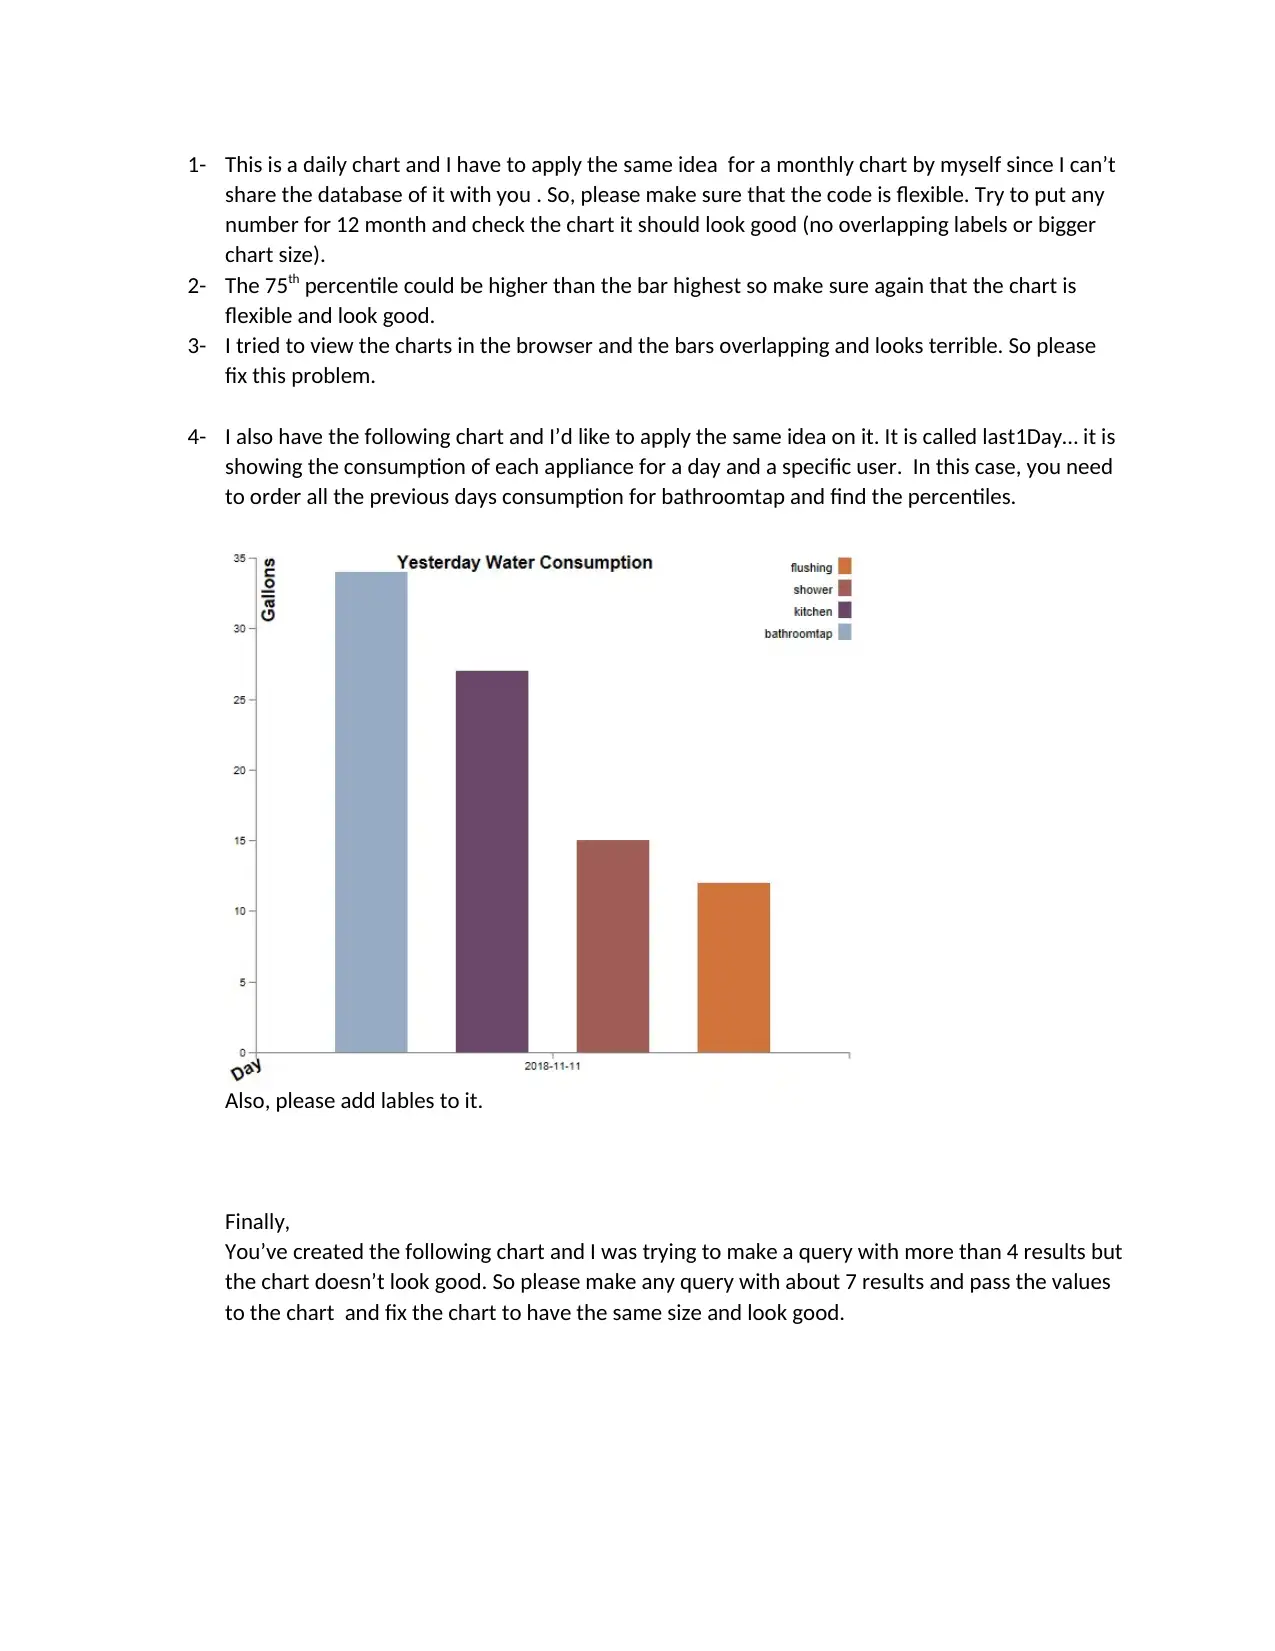
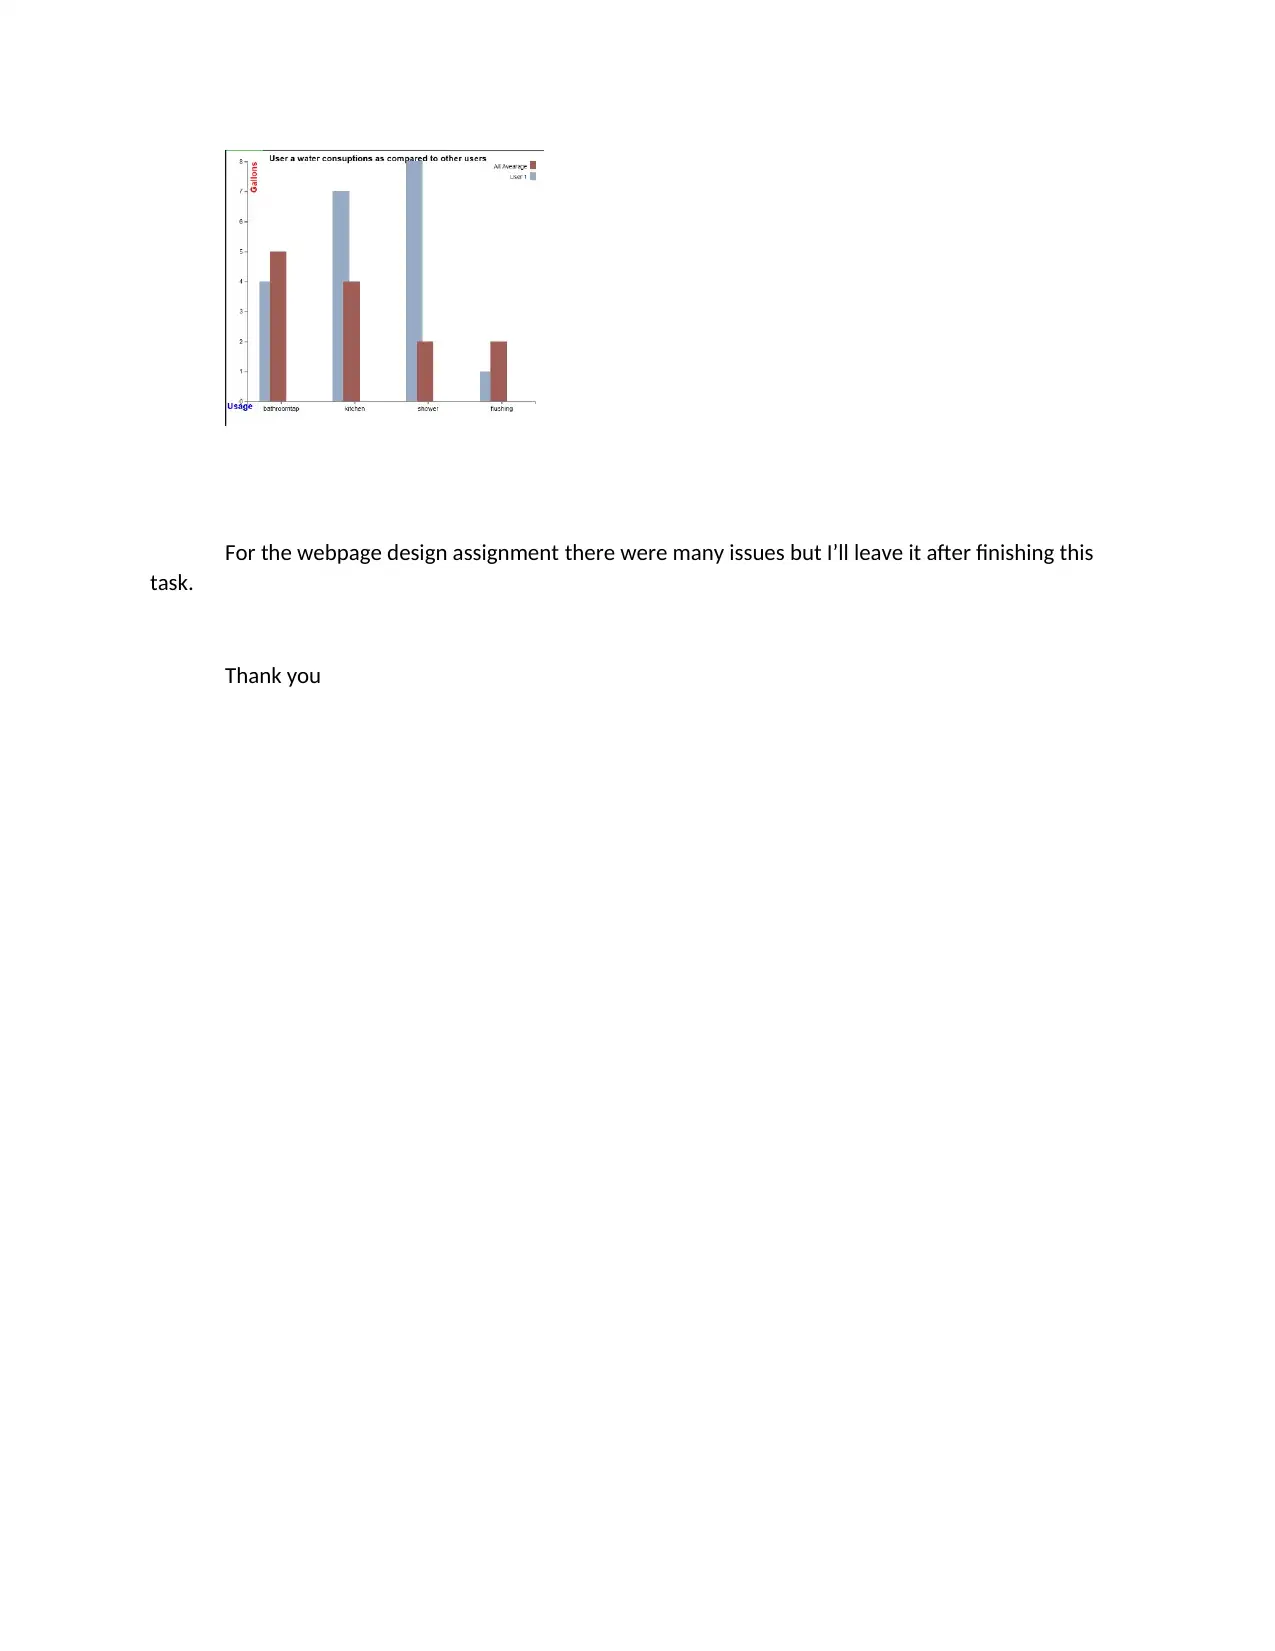
The assignment requires creating a series of charts that calculate percentiles for daily consumption data. The first chart will display the percentile for each day, with the ordering done using the shared query. The code must be flexible to accommodate a monthly chart and ensure it looks good without overlapping labels or excessive size. Additionally, the 75th percentile may exceed the highest bar height. A second chart, 'last1Day', will show appliance consumption for a specific user and day, with percentiles calculated for bathroomtap data. The chart should include labels. Finally, a third chart will display the results of a query with approximately 7 values and ensure it looks good with no overlapping labels or excessive size.
![[object Object]](/_next/static/media/star-bottom.7253800d.svg)