6MV500 Advanced Powertrain Engineering: Piston Motion & Gear Selection
VerifiedAdded on 2023/05/31
|31
|6467
|75
Practical Assignment
AI Summary
This assignment delves into two key aspects of powertrain technology: piston motion in relation to crankshaft position and gear ratio selection. The piston motion analysis involves determining parameters like travel distance, speed, and acceleration through engine simulation and experimental data, considering factors such as lubrication, friction forces, and the impact of crankshaft rod length on engine performance. The gear ratio selection focuses on optimizing vehicle performance based on engine characteristics and road conditions, using data from road run tests to determine optimal gear ratios for maximizing speed and efficiency. The analysis incorporates MATLAB simulations to visualize and interpret data, providing a comprehensive understanding of the interplay between piston dynamics and gear selection in powertrain engineering. Desklib offers a platform to access this and similar solved assignments, enhancing students' understanding.
6MV500
Advanced Powertrain Engineering
Student Name
Student ID Number
Institutional Affiliation
Instructor
Date of submission
Advanced Powertrain Engineering
Student Name
Student ID Number
Institutional Affiliation
Instructor
Date of submission
Paraphrase This Document
Need a fresh take? Get an instant paraphrase of this document with our AI Paraphraser
TABLE OF CONTENTS
PISTON MOTION..........................................................................................................................2
INTRODUCTION.......................................................................................................................2
AIMS & OUTCOMES.................................................................................................................3
EQUIPMENT...............................................................................................................................3
RESULTS....................................................................................................................................3
CALCULATION AND ANALYSIS...........................................................................................3
DISCUSSION..............................................................................................................................6
CONCLUDING REMARKS.....................................................................................................11
REFERENCES...........................................................................................................................12
GEAR RATIO SELECTION........................................................................................................13
INTRODUCTION.....................................................................................................................13
AIMS & OUTCOMES...............................................................................................................15
ANALYSIS................................................................................................................................15
RESULTS..................................................................................................................................15
DISCUSSION............................................................................................................................15
1

LIST OF FIGURES
Figure 1 Piston motion for the crankshaft [source: Wikander,2004]..............................................3
Figure 2 The plot of the travel distance against angle [Matlab R2018b]........................................4
Figure 3 plot of speed on torque generation [Matlab r2018b].........................................................5
Figure 4 The road run test I [Matlab r2018b]..................................................................................6
Figure 5 The piston assembly [Maskinelement Handbook, 2003]..................................................7
Figure 6 The piston force balance...................................................................................................9
Figure 7 The piston side thrust load..............................................................................................10
Figure 8 The four-stroke engine balance.......................................................................................11
Figure 9 Estimated power and torque curves for the engine.........................................................16
Figure 10 The road run test............................................................................................................17
Figure 11 Plot of te RPM against the time [Matlab r2018b].........................................................17
Figure 12 The maximum possible top speed of the vehicle..........................................................18
Figure 13 [Wang]...........................................................................................................................20
LIST OF TABLES
Table 1 Experiment Table...............................................................................................................3
Table 2 Powertrain crank rotation...................................................................................................4
Table 3 Vehicle payload system parameters.................................................................................16
2
⊘ This is a preview!⊘
Do you want full access?
Subscribe today to unlock all pages.
Trusted by 1+ million students worldwide
PISTON MOTION
INTRODUCTION
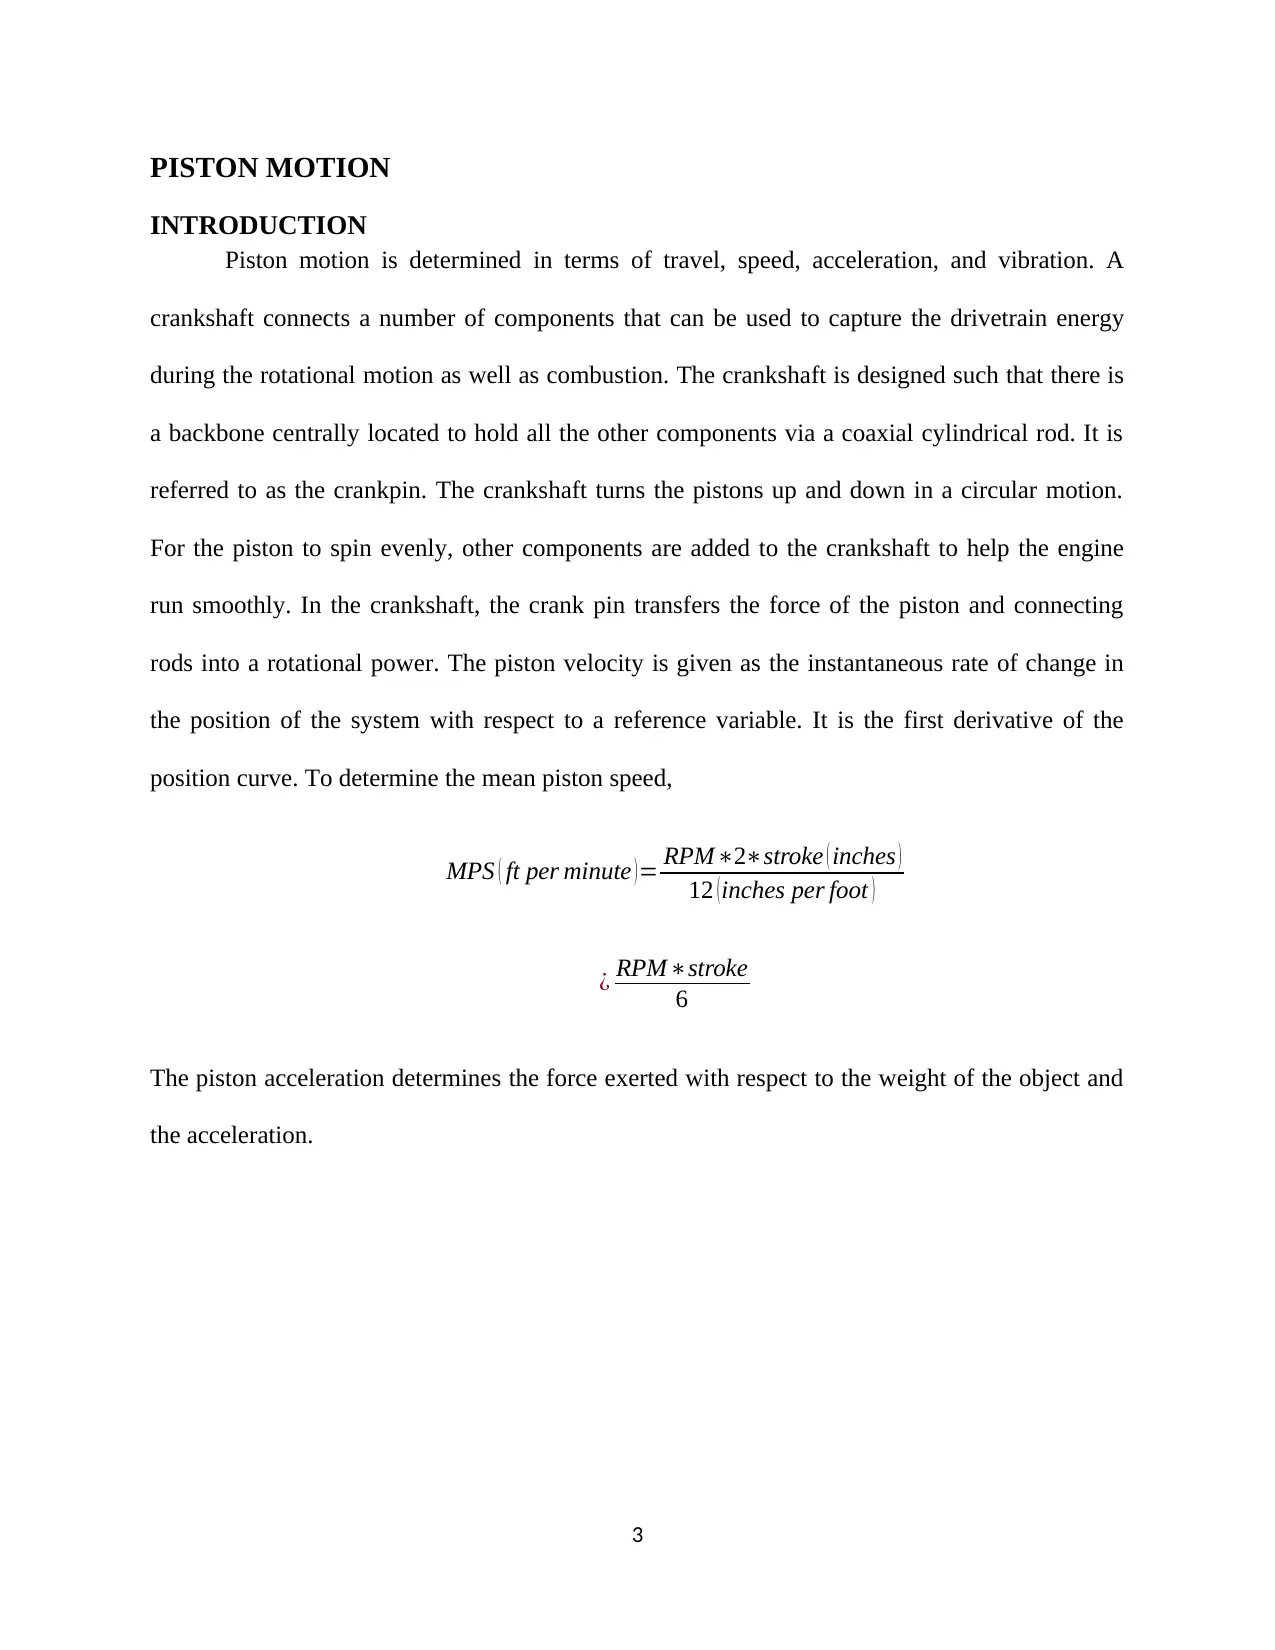
Piston motion is determined in terms of travel, speed, acceleration, and vibration. A
crankshaft connects a number of components that can be used to capture the drivetrain energy
during the rotational motion as well as combustion. The crankshaft is designed such that there is
a backbone centrally located to hold all the other components via a coaxial cylindrical rod. It is
referred to as the crankpin. The crankshaft turns the pistons up and down in a circular motion.
For the piston to spin evenly, other components are added to the crankshaft to help the engine
run smoothly. In the crankshaft, the crank pin transfers the force of the piston and connecting
rods into a rotational power. The piston velocity is given as the instantaneous rate of change in
the position of the system with respect to a reference variable. It is the first derivative of the
position curve. To determine the mean piston speed,
MPS ( ft per minute )= RPM∗2∗stroke ( inches )
12 (inches per foot )
¿ RPM∗stroke
6
The piston acceleration determines the force exerted with respect to the weight of the object and
the acceleration.
3
INTRODUCTION
Piston motion is determined in terms of travel, speed, acceleration, and vibration. A
crankshaft connects a number of components that can be used to capture the drivetrain energy
during the rotational motion as well as combustion. The crankshaft is designed such that there is
a backbone centrally located to hold all the other components via a coaxial cylindrical rod. It is
referred to as the crankpin. The crankshaft turns the pistons up and down in a circular motion.
For the piston to spin evenly, other components are added to the crankshaft to help the engine
run smoothly. In the crankshaft, the crank pin transfers the force of the piston and connecting
rods into a rotational power. The piston velocity is given as the instantaneous rate of change in
the position of the system with respect to a reference variable. It is the first derivative of the
position curve. To determine the mean piston speed,
MPS ( ft per minute )= RPM∗2∗stroke ( inches )
12 (inches per foot )
¿ RPM∗stroke
6
The piston acceleration determines the force exerted with respect to the weight of the object and
the acceleration.
3
Paraphrase This Document
Need a fresh take? Get an instant paraphrase of this document with our AI Paraphraser
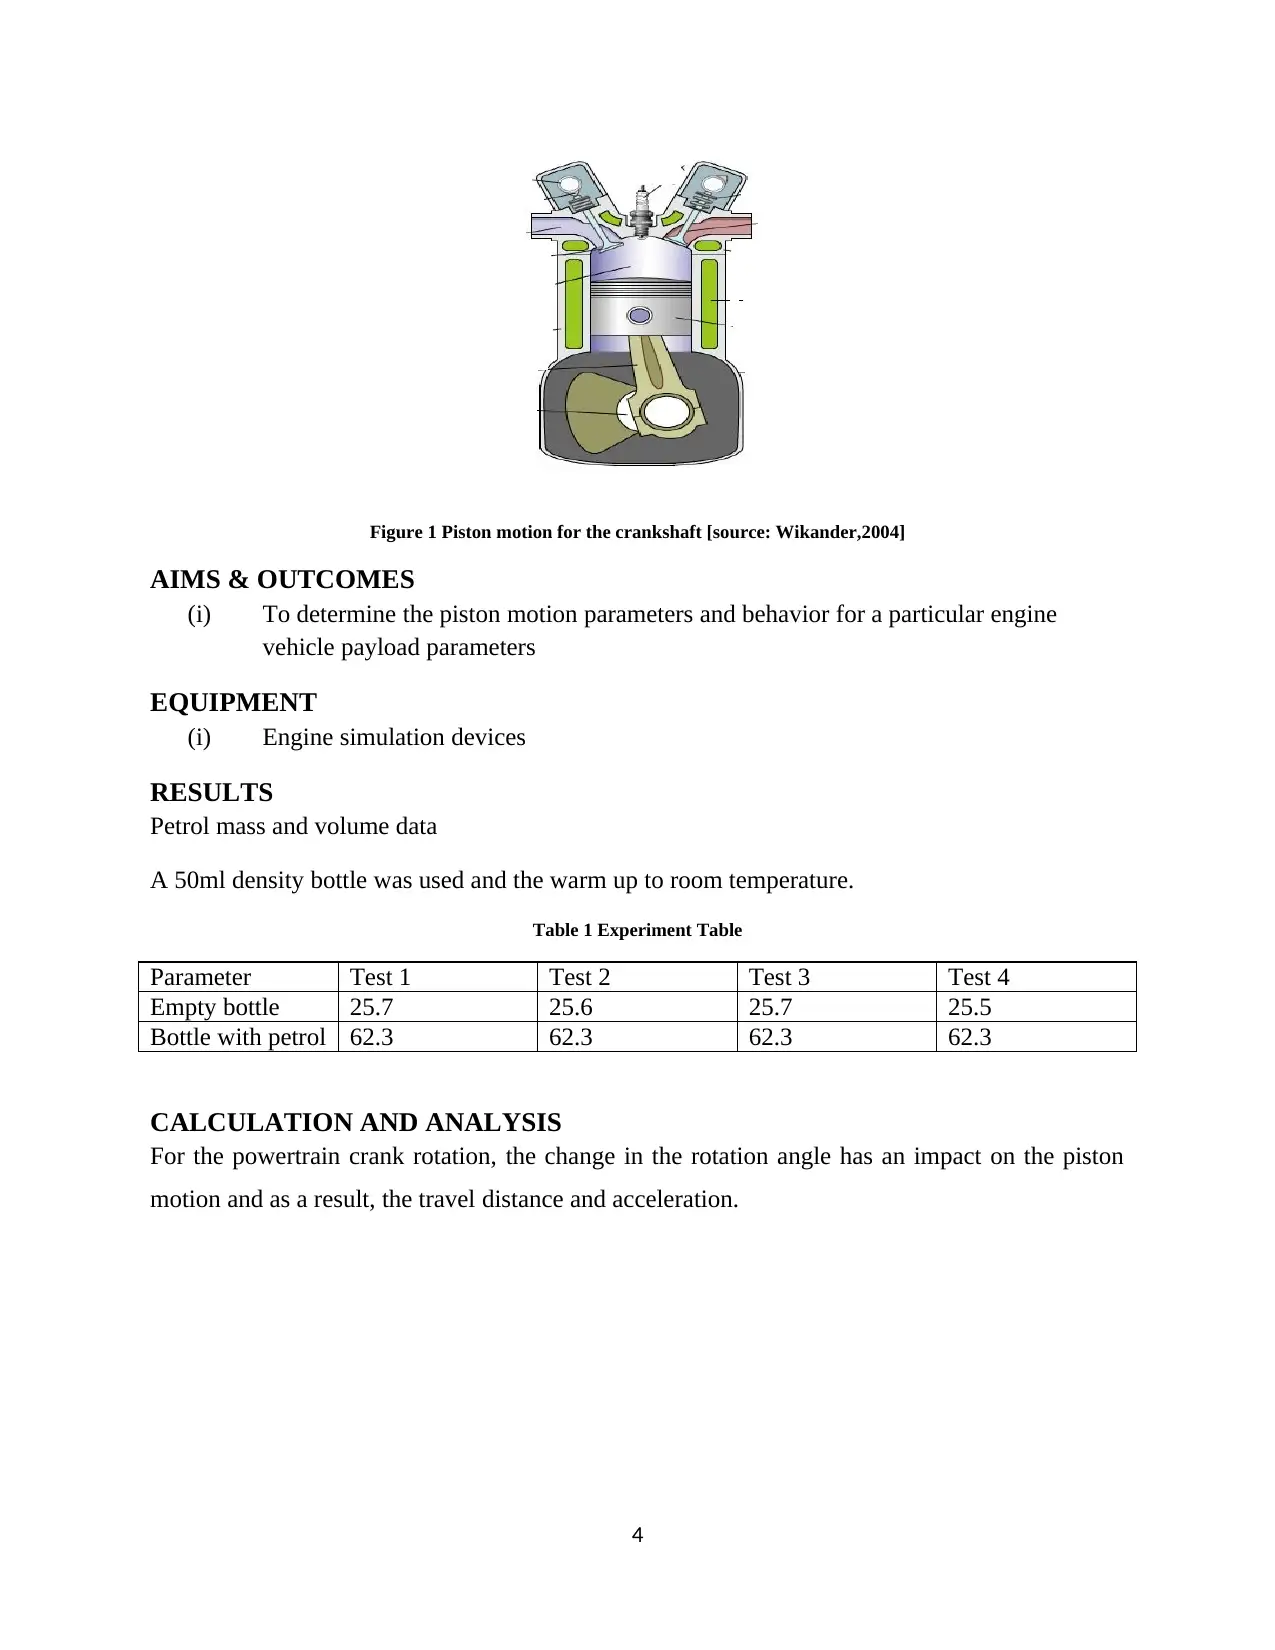
Figure 1 Piston motion for the crankshaft [source: Wikander,2004]
AIMS & OUTCOMES
(i) To determine the piston motion parameters and behavior for a particular engine
vehicle payload parameters
EQUIPMENT
(i) Engine simulation devices
RESULTS
Petrol mass and volume data
A 50ml density bottle was used and the warm up to room temperature.
Table 1 Experiment Table
Parameter Test 1 Test 2 Test 3 Test 4
Empty bottle 25.7 25.6 25.7 25.5
Bottle with petrol 62.3 62.3 62.3 62.3
CALCULATION AND ANALYSIS
For the powertrain crank rotation, the change in the rotation angle has an impact on the piston
motion and as a result, the travel distance and acceleration.
4
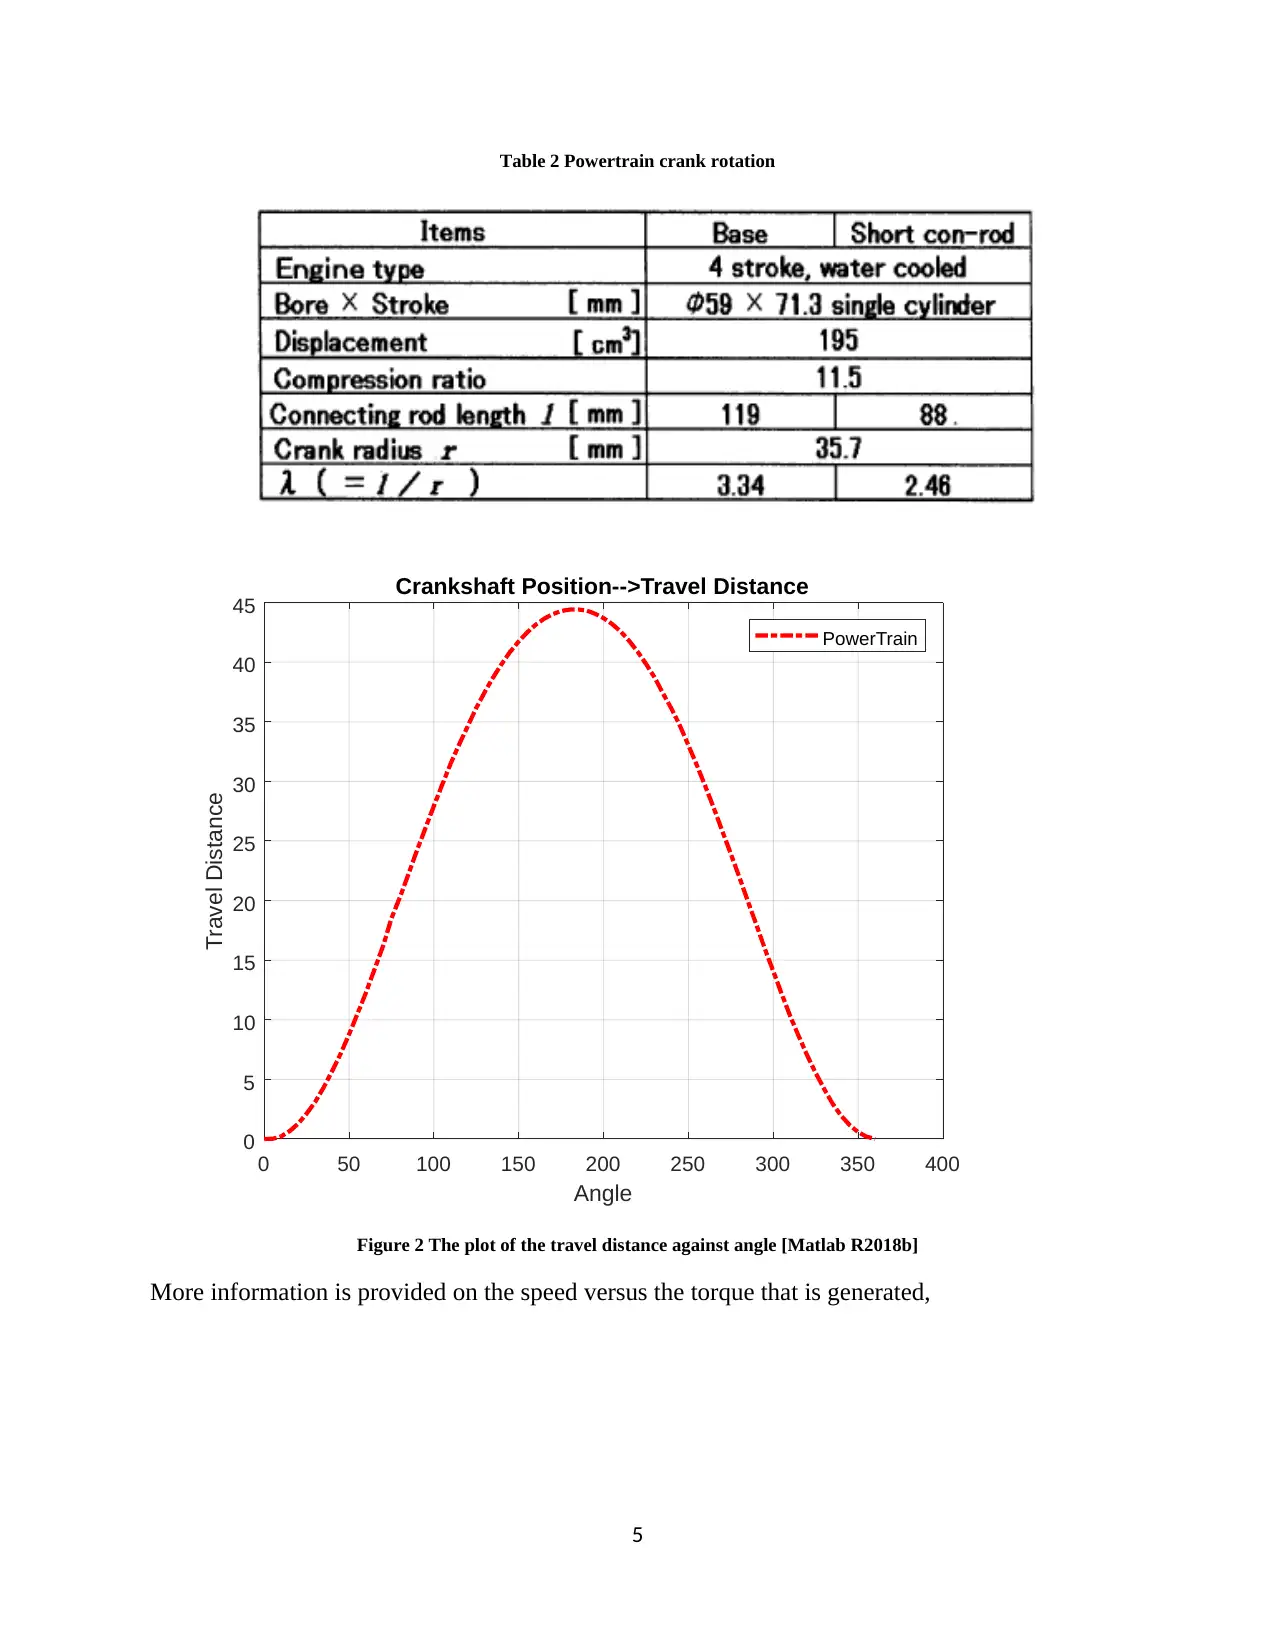
Table 2 Powertrain crank rotation
0 50 100 150 200 250 300 350 400
Angle
0
5
10
15
20
25
30
35
40
45
Travel Distance
Crankshaft Position-->Travel Distance
PowerTrain
Figure 2 The plot of the travel distance against angle [Matlab R2018b]
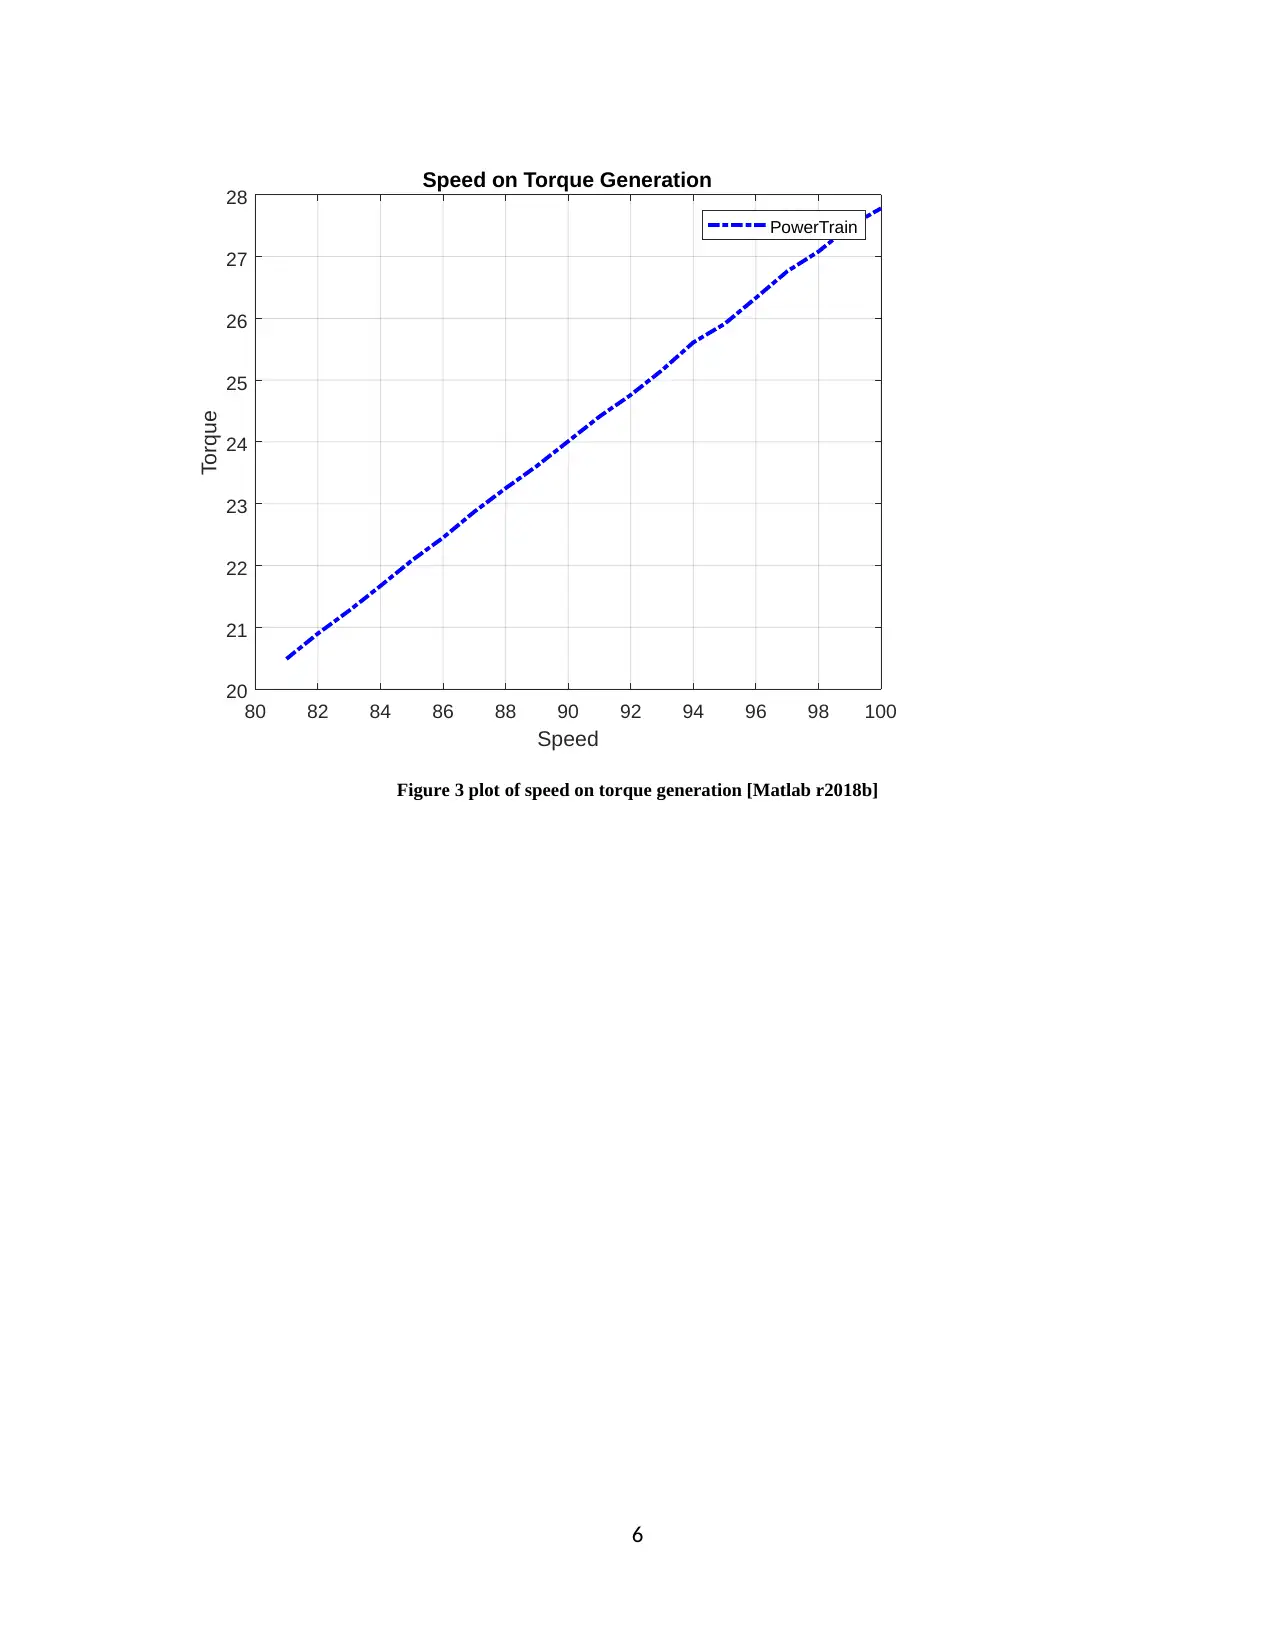
More information is provided on the speed versus the torque that is generated,
5
0 50 100 150 200 250 300 350 400
Angle
0
5
10
15
20
25
30
35
40
45
Travel Distance
Crankshaft Position-->Travel Distance
PowerTrain
Figure 2 The plot of the travel distance against angle [Matlab R2018b]
More information is provided on the speed versus the torque that is generated,
5
⊘ This is a preview!⊘
Do you want full access?
Subscribe today to unlock all pages.
Trusted by 1+ million students worldwide
80 82 84 86 88 90 92 94 96 98 100
Speed
20
21
22
23
24
25
26
27
28
Torque
Speed on Torque Generation
PowerTrain
Figure 3 plot of speed on torque generation [Matlab r2018b]
6
Speed
20
21
22
23
24
25
26
27
28
Torque
Speed on Torque Generation
PowerTrain
Figure 3 plot of speed on torque generation [Matlab r2018b]
6
Paraphrase This Document
Need a fresh take? Get an instant paraphrase of this document with our AI Paraphraser
60 80 100 120 140 160 180 200
Time(sec)
0
2
4
6
Power(Watts)
Road Run Tests
Power
60 80 100 120 140 160 180 200
Time(sec)
0
20
40
60
Speed(km/h) Speed
60 80 100 120 140 160 180 200
Time(sec)
0
5000
10000
Revolutions per minute(RPM)
RPM against Time
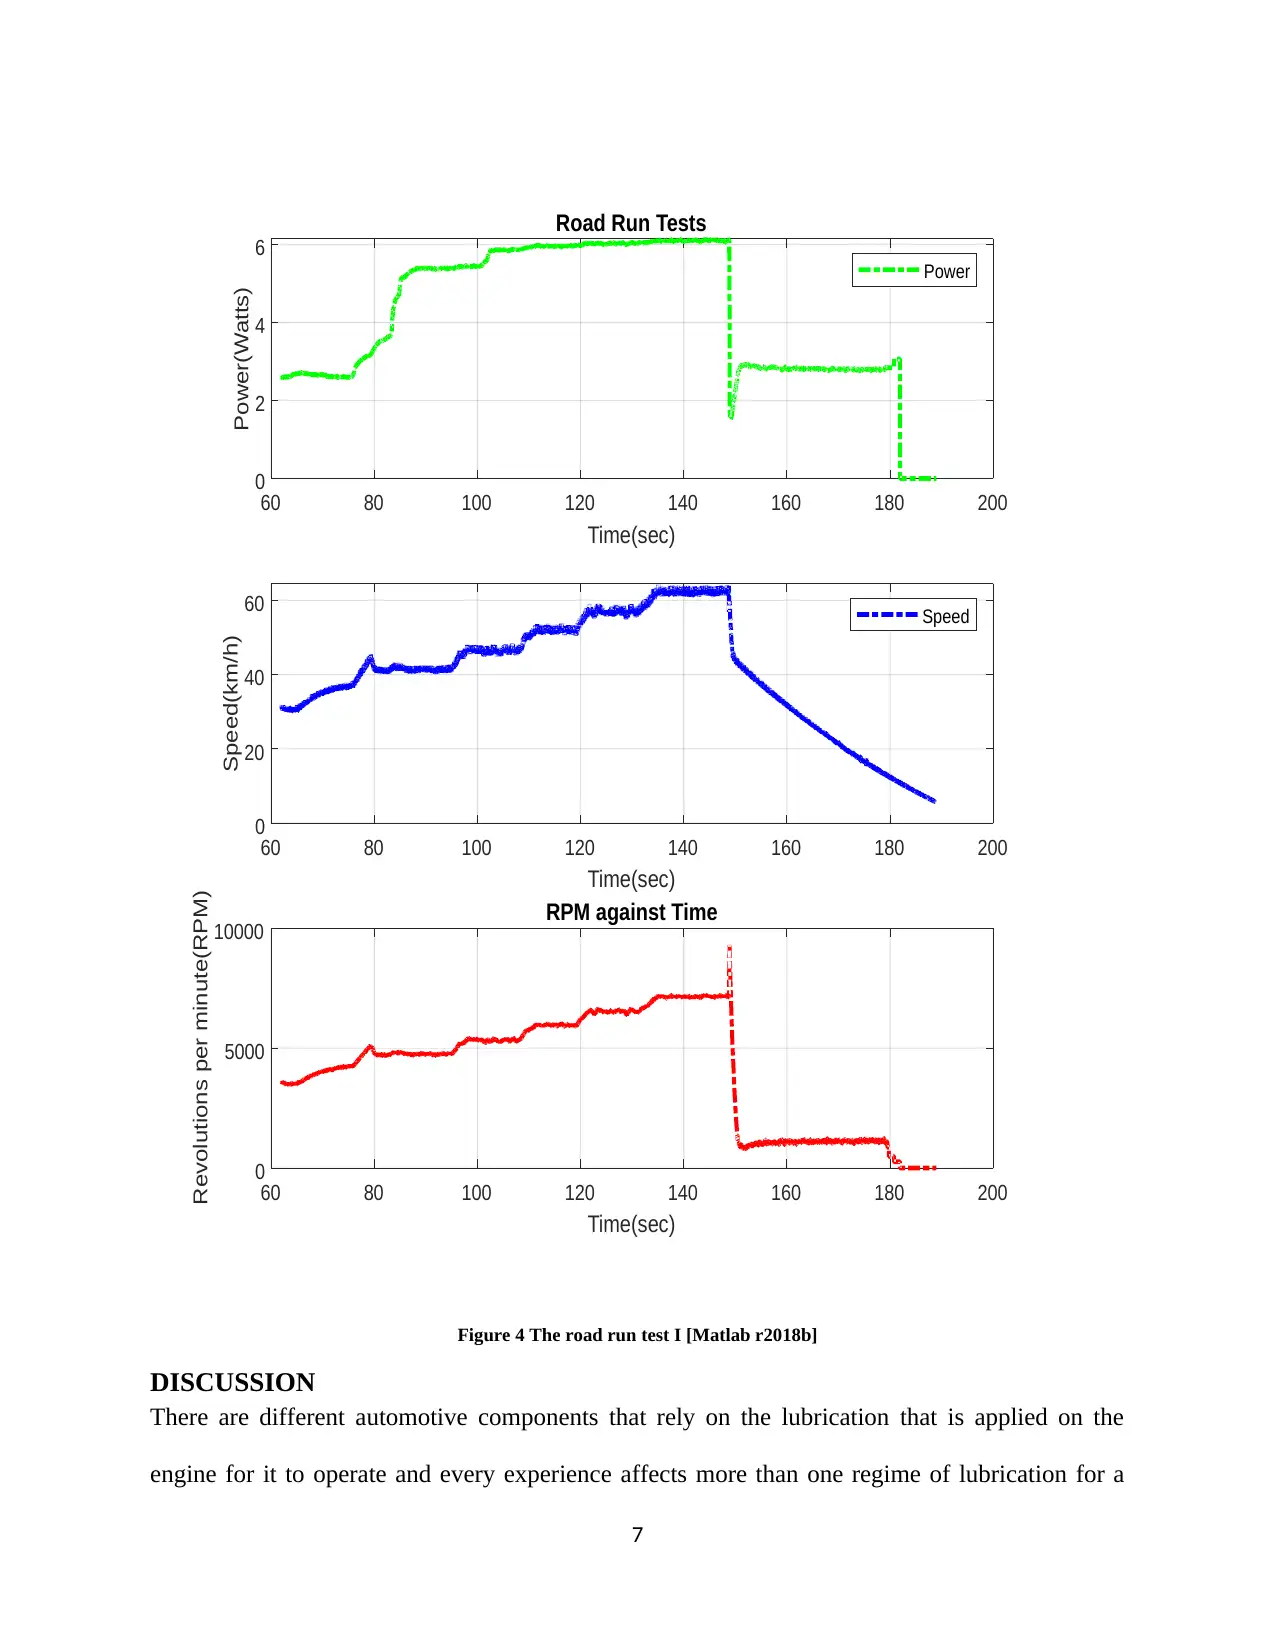
Figure 4 The road run test I [Matlab r2018b]
DISCUSSION
There are different automotive components that rely on the lubrication that is applied on the
engine for it to operate and every experience affects more than one regime of lubrication for a
7
Time(sec)
0
2
4
6
Power(Watts)
Road Run Tests
Power
60 80 100 120 140 160 180 200
Time(sec)
0
20
40
60
Speed(km/h) Speed
60 80 100 120 140 160 180 200
Time(sec)
0
5000
10000
Revolutions per minute(RPM)
RPM against Time
Figure 4 The road run test I [Matlab r2018b]
DISCUSSION
There are different automotive components that rely on the lubrication that is applied on the
engine for it to operate and every experience affects more than one regime of lubrication for a
7
single cycle. The key operating tribological parameter that is used in the powertrain system is the
lubricant film thickness that seeks to separate the interaction among components especially those
that are moving on the crankshaft in rotary motion. The lubrication is defined as a means of the
relative magnitude of the lubricant film compared to the combined surface roughness that
connects to more combined surface roughness for different surfaces. The ratio difference is
equated as,
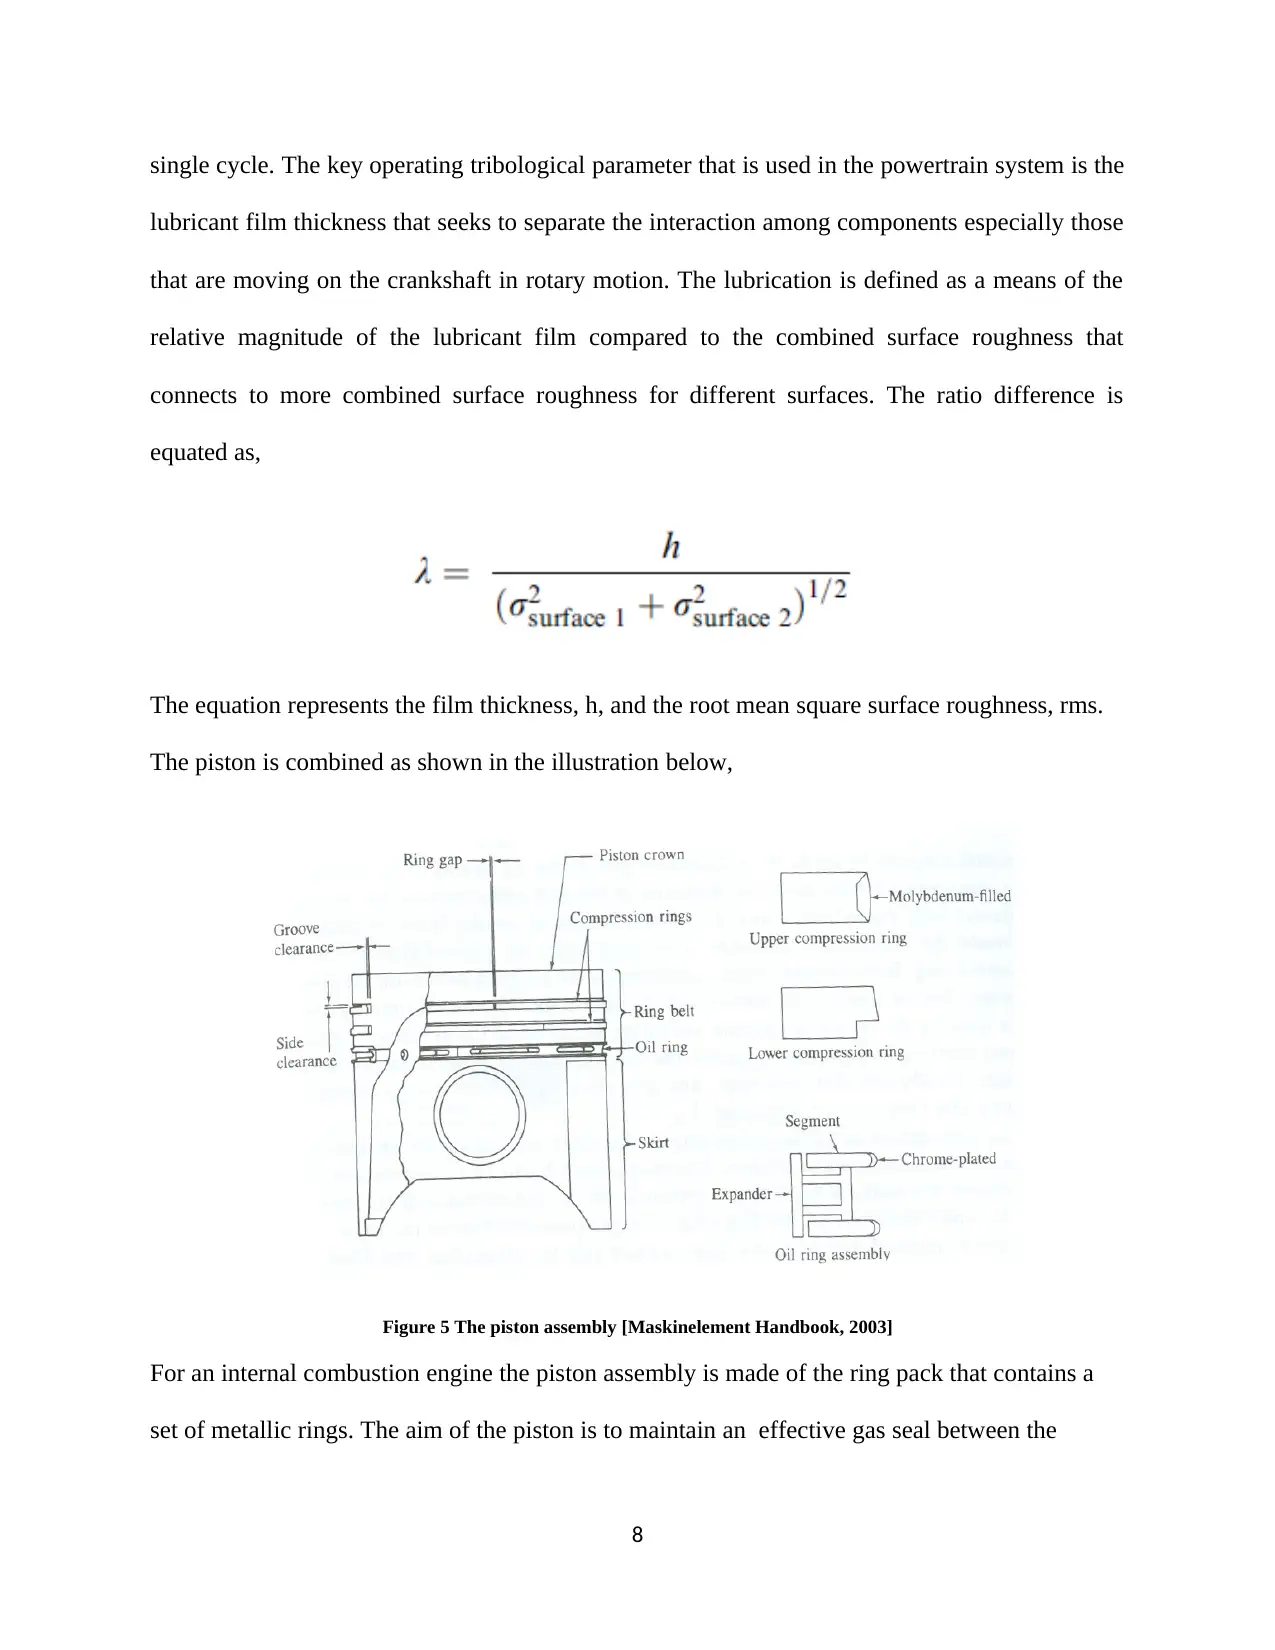
The equation represents the film thickness, h, and the root mean square surface roughness, rms.
The piston is combined as shown in the illustration below,
Figure 5 The piston assembly [Maskinelement Handbook, 2003]
For an internal combustion engine the piston assembly is made of the ring pack that contains a
set of metallic rings. The aim of the piston is to maintain an effective gas seal between the
8
lubricant film thickness that seeks to separate the interaction among components especially those
that are moving on the crankshaft in rotary motion. The lubrication is defined as a means of the
relative magnitude of the lubricant film compared to the combined surface roughness that
connects to more combined surface roughness for different surfaces. The ratio difference is
equated as,
The equation represents the film thickness, h, and the root mean square surface roughness, rms.
The piston is combined as shown in the illustration below,
Figure 5 The piston assembly [Maskinelement Handbook, 2003]
For an internal combustion engine the piston assembly is made of the ring pack that contains a
set of metallic rings. The aim of the piston is to maintain an effective gas seal between the
8
⊘ This is a preview!⊘
Do you want full access?
Subscribe today to unlock all pages.
Trusted by 1+ million students worldwide
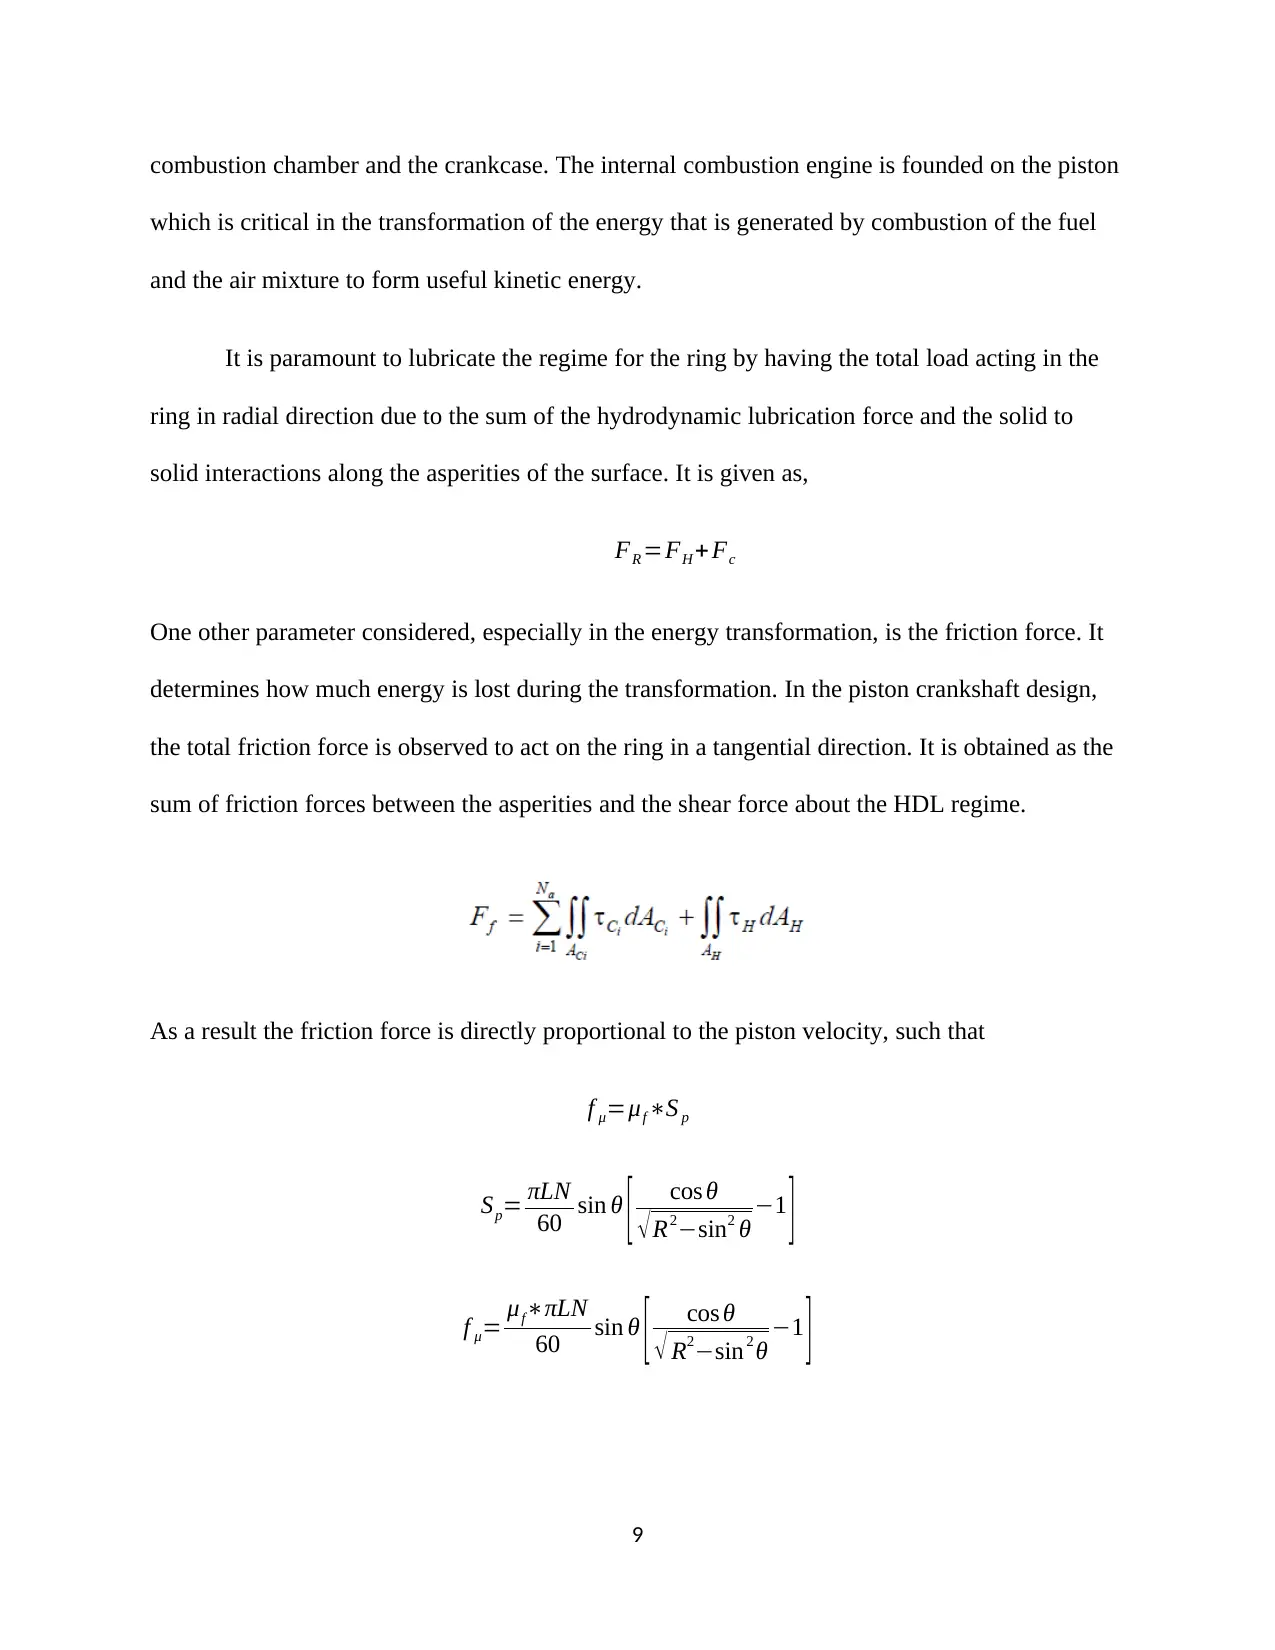
combustion chamber and the crankcase. The internal combustion engine is founded on the piston
which is critical in the transformation of the energy that is generated by combustion of the fuel
and the air mixture to form useful kinetic energy.
It is paramount to lubricate the regime for the ring by having the total load acting in the
ring in radial direction due to the sum of the hydrodynamic lubrication force and the solid to
solid interactions along the asperities of the surface. It is given as,
FR =FH + Fc
One other parameter considered, especially in the energy transformation, is the friction force. It
determines how much energy is lost during the transformation. In the piston crankshaft design,
the total friction force is observed to act on the ring in a tangential direction. It is obtained as the
sum of friction forces between the asperities and the shear force about the HDL regime.
As a result the friction force is directly proportional to the piston velocity, such that
f μ=μf ∗S p
Sp= πLN
60 sin θ [ cos θ
√ R2−sin2 θ −1 ]
f μ= μf∗πLN
60 sin θ [ cos θ
√ R2−sin2 θ −1 ]
9
Paraphrase This Document
Need a fresh take? Get an instant paraphrase of this document with our AI Paraphraser
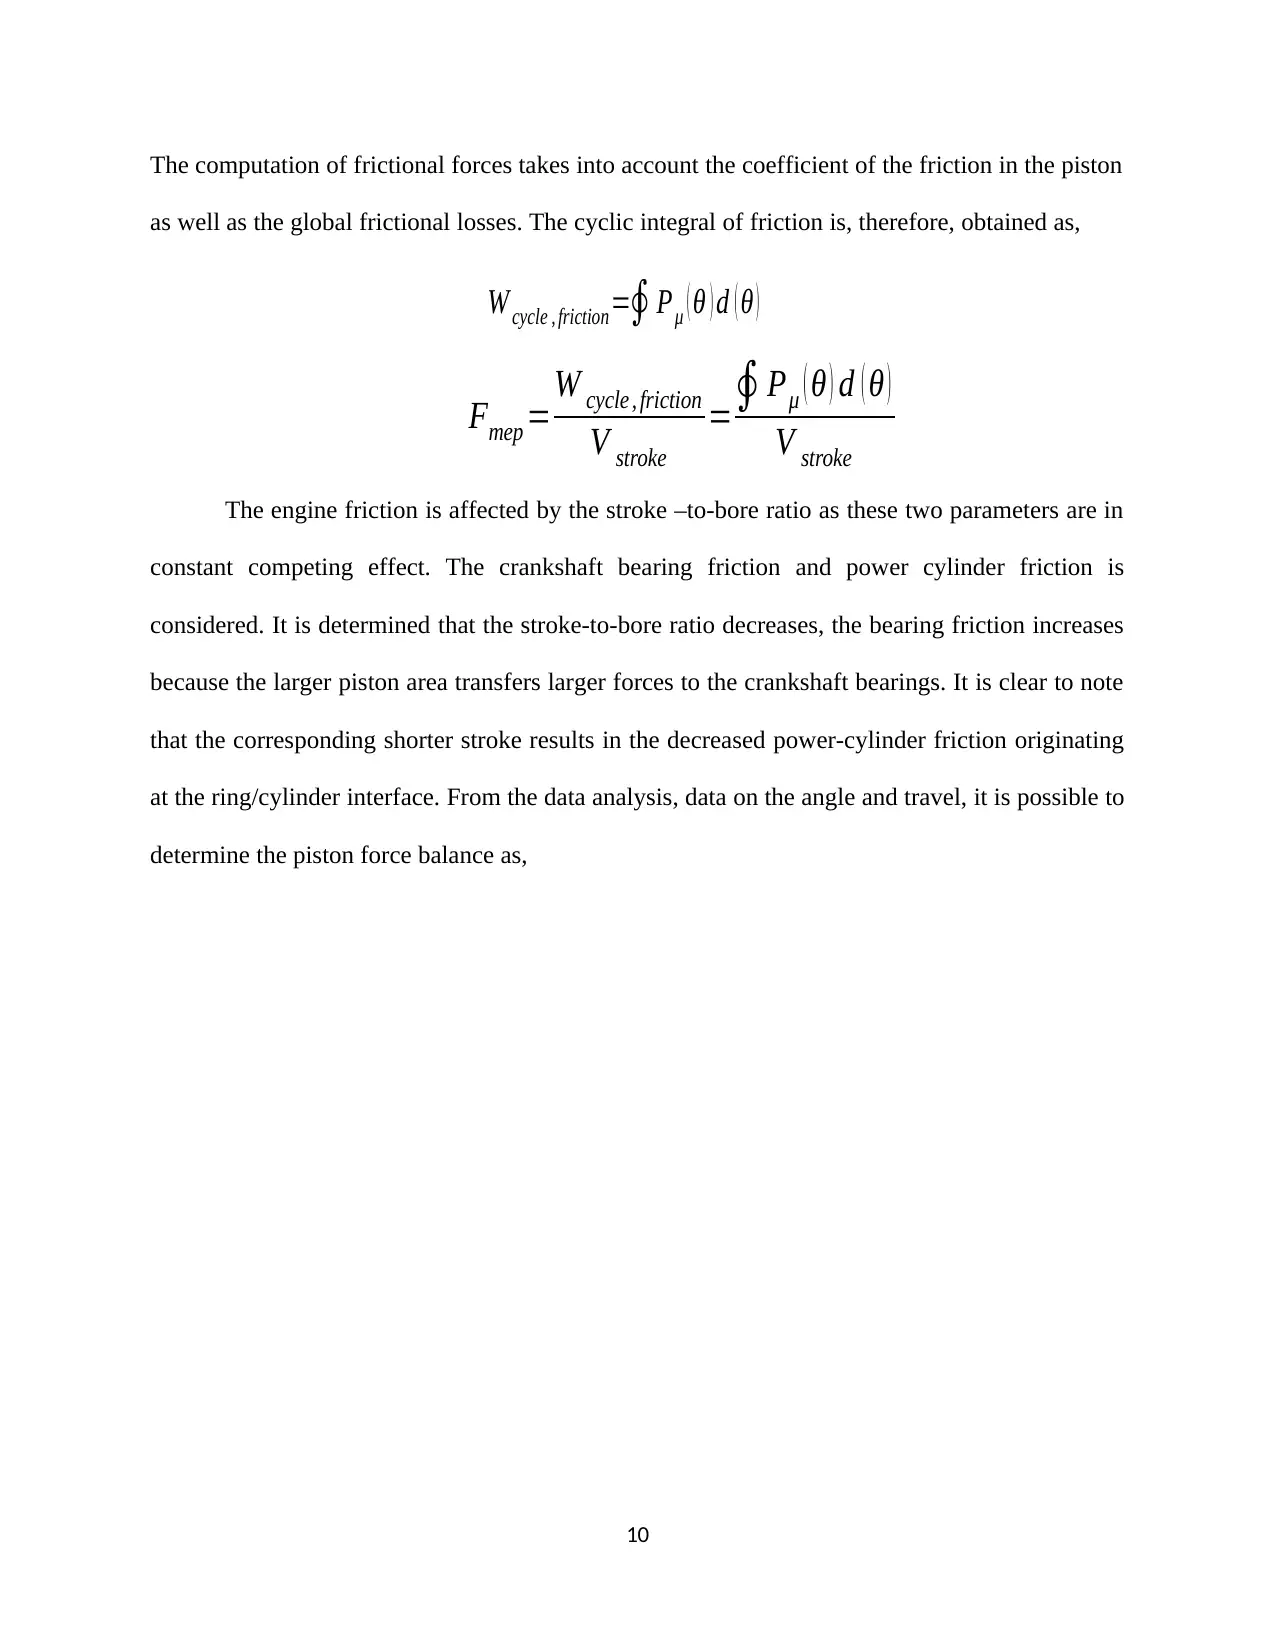
The computation of frictional forces takes into account the coefficient of the friction in the piston
as well as the global frictional losses. The cyclic integral of friction is, therefore, obtained as,
The engine friction is affected by the stroke –to-bore ratio as these two parameters are in
constant competing effect. The crankshaft bearing friction and power cylinder friction is
considered. It is determined that the stroke-to-bore ratio decreases, the bearing friction increases
because the larger piston area transfers larger forces to the crankshaft bearings. It is clear to note
that the corresponding shorter stroke results in the decreased power-cylinder friction originating
at the ring/cylinder interface. From the data analysis, data on the angle and travel, it is possible to
determine the piston force balance as,
10
Fmep =W cycle , friction
V stroke
=∮ Pμ ( θ ) d ( θ )
V stroke
W cycle , friction=∮ Pμ ( θ ) d ( θ )
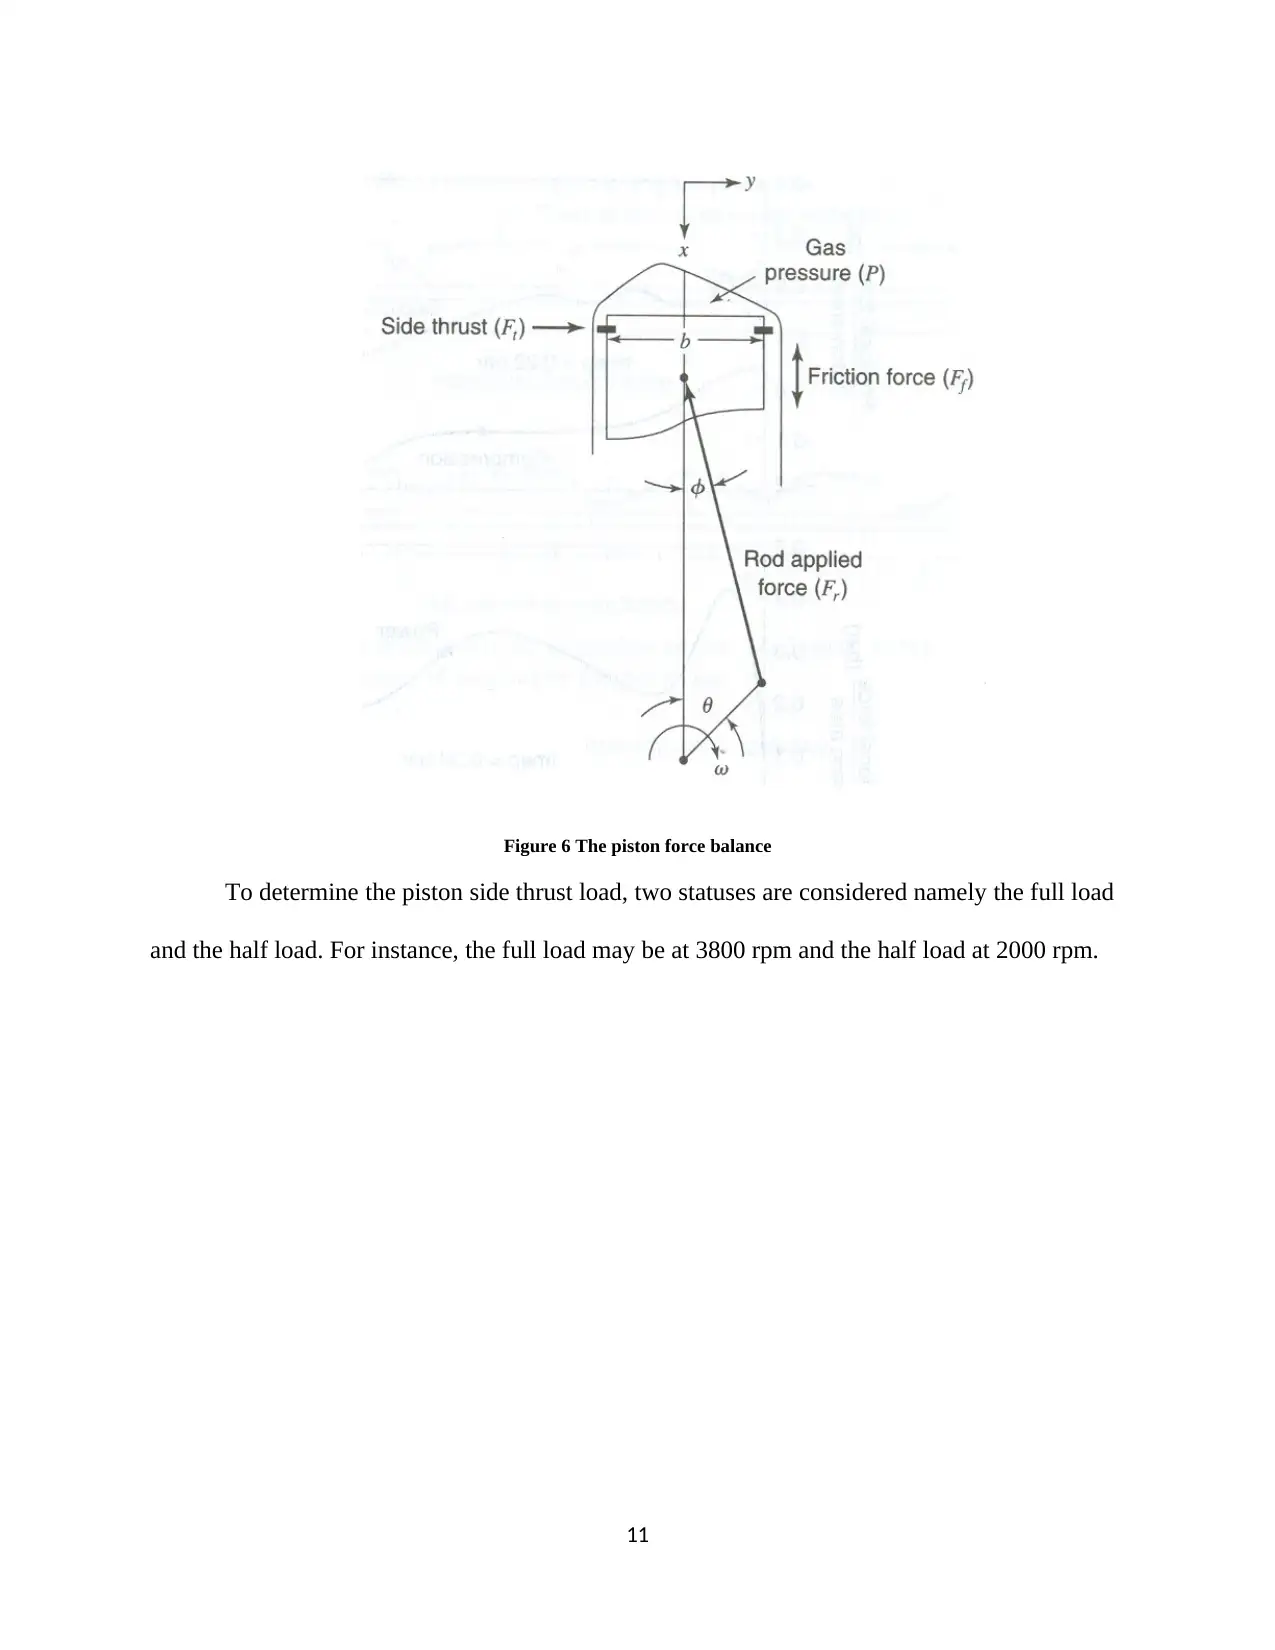
Figure 6 The piston force balance
To determine the piston side thrust load, two statuses are considered namely the full load
and the half load. For instance, the full load may be at 3800 rpm and the half load at 2000 rpm.
11
To determine the piston side thrust load, two statuses are considered namely the full load
and the half load. For instance, the full load may be at 3800 rpm and the half load at 2000 rpm.
11
⊘ This is a preview!⊘
Do you want full access?
Subscribe today to unlock all pages.
Trusted by 1+ million students worldwide
1 out of 31


Your All-in-One AI-Powered Toolkit for Academic Success.
+13062052269
info@desklib.com
Available 24*7 on WhatsApp / Email
![[object Object]](/_next/static/media/star-bottom.7253800d.svg)
Unlock your academic potential
Copyright © 2020–2026 A2Z Services. All Rights Reserved. Developed and managed by ZUCOL.