7702AFE Accounting & Reporting: Detailed Financial Statement Analysis
VerifiedAdded on 2023/06/10
|10
|1872
|283
Report
AI Summary
This report provides a comprehensive financial statement analysis, focusing on the accounting and reporting aspects of Vulcan Energy Resources Ltd and A2 Milk. It includes a ratio analysis, trend analysis, and synthesis of income statements, balance sheets, and cash flow statements. The analysis identifies key differences in net profit and cash flow, reasons for performance decline, and the reliability of cash flow statements versus income statements for strategic decision-making. The report also reflects on the learning experience, emphasizing data analysis, time management, and the application of financial evaluation techniques.
7702AFE Accounting and
Reporting
Reporting
Paraphrase This Document
Need a fresh take? Get an instant paraphrase of this document with our AI Paraphraser
TABLE OF CONTENTS
PART A..........................................................................................................................................3
1...................................................................................................................................................3
2...................................................................................................................................................3
3...................................................................................................................................................3
4...................................................................................................................................................3
PART B FINANCIAL STATEMENT ANALYSIS ......................................................................4
1) ratio analysis...........................................................................................................................4
2. Trend analysis.........................................................................................................................6
C) Synthesis-income statement, balance sheet and cash flows statement..................................8
Part D Profit or cash flows..........................................................................................................8
Part E...........................................................................................................................................9
REFERENCES..............................................................................................................................10
PART A
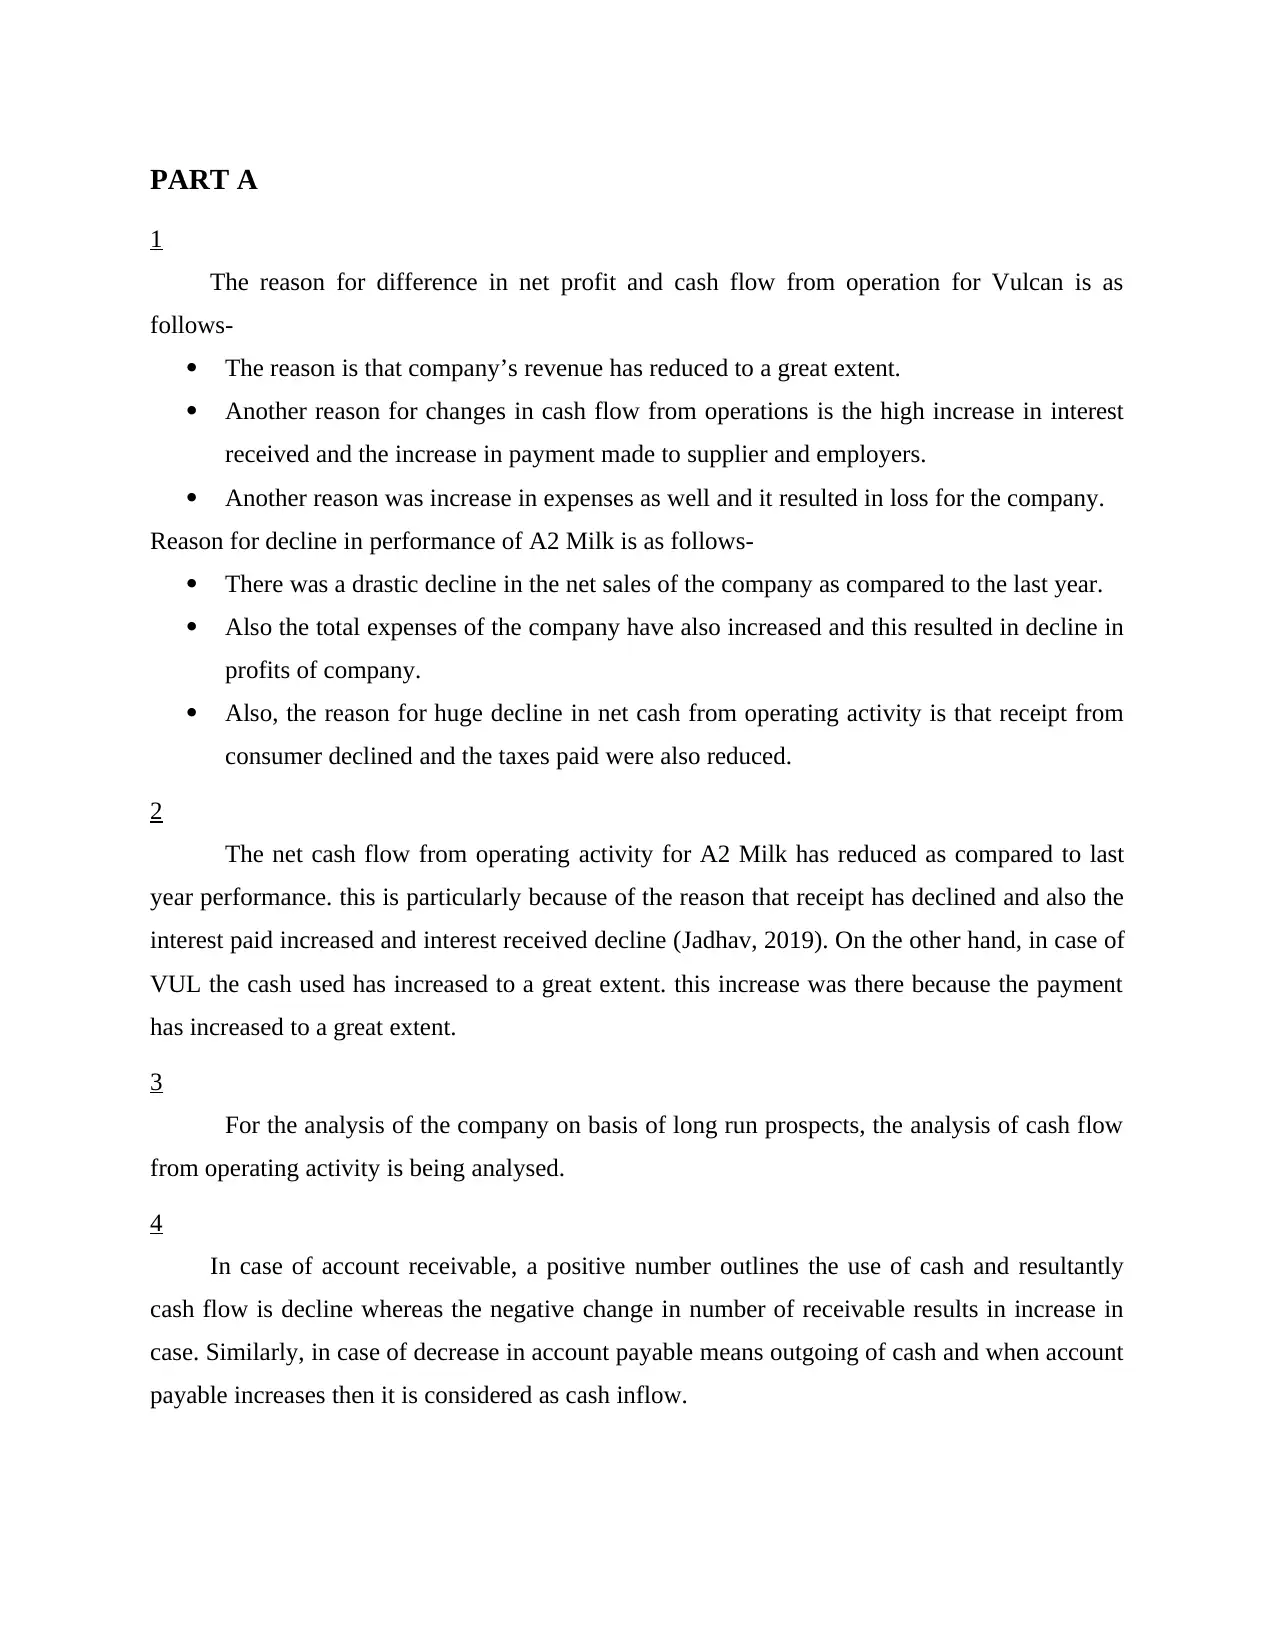
1
The reason for difference in net profit and cash flow from operation for Vulcan is as
follows-
The reason is that company’s revenue has reduced to a great extent.
Another reason for changes in cash flow from operations is the high increase in interest
received and the increase in payment made to supplier and employers.
Another reason was increase in expenses as well and it resulted in loss for the company.
Reason for decline in performance of A2 Milk is as follows-
There was a drastic decline in the net sales of the company as compared to the last year.
Also the total expenses of the company have also increased and this resulted in decline in
profits of company.
Also, the reason for huge decline in net cash from operating activity is that receipt from
consumer declined and the taxes paid were also reduced.
2
The net cash flow from operating activity for A2 Milk has reduced as compared to last
year performance. this is particularly because of the reason that receipt has declined and also the
interest paid increased and interest received decline (Jadhav, 2019). On the other hand, in case of
VUL the cash used has increased to a great extent. this increase was there because the payment
has increased to a great extent.
3
For the analysis of the company on basis of long run prospects, the analysis of cash flow
from operating activity is being analysed.
4
In case of account receivable, a positive number outlines the use of cash and resultantly
cash flow is decline whereas the negative change in number of receivable results in increase in
case. Similarly, in case of decrease in account payable means outgoing of cash and when account
payable increases then it is considered as cash inflow.
⊘ This is a preview!⊘
Do you want full access?
Subscribe today to unlock all pages.
Trusted by 1+ million students worldwide
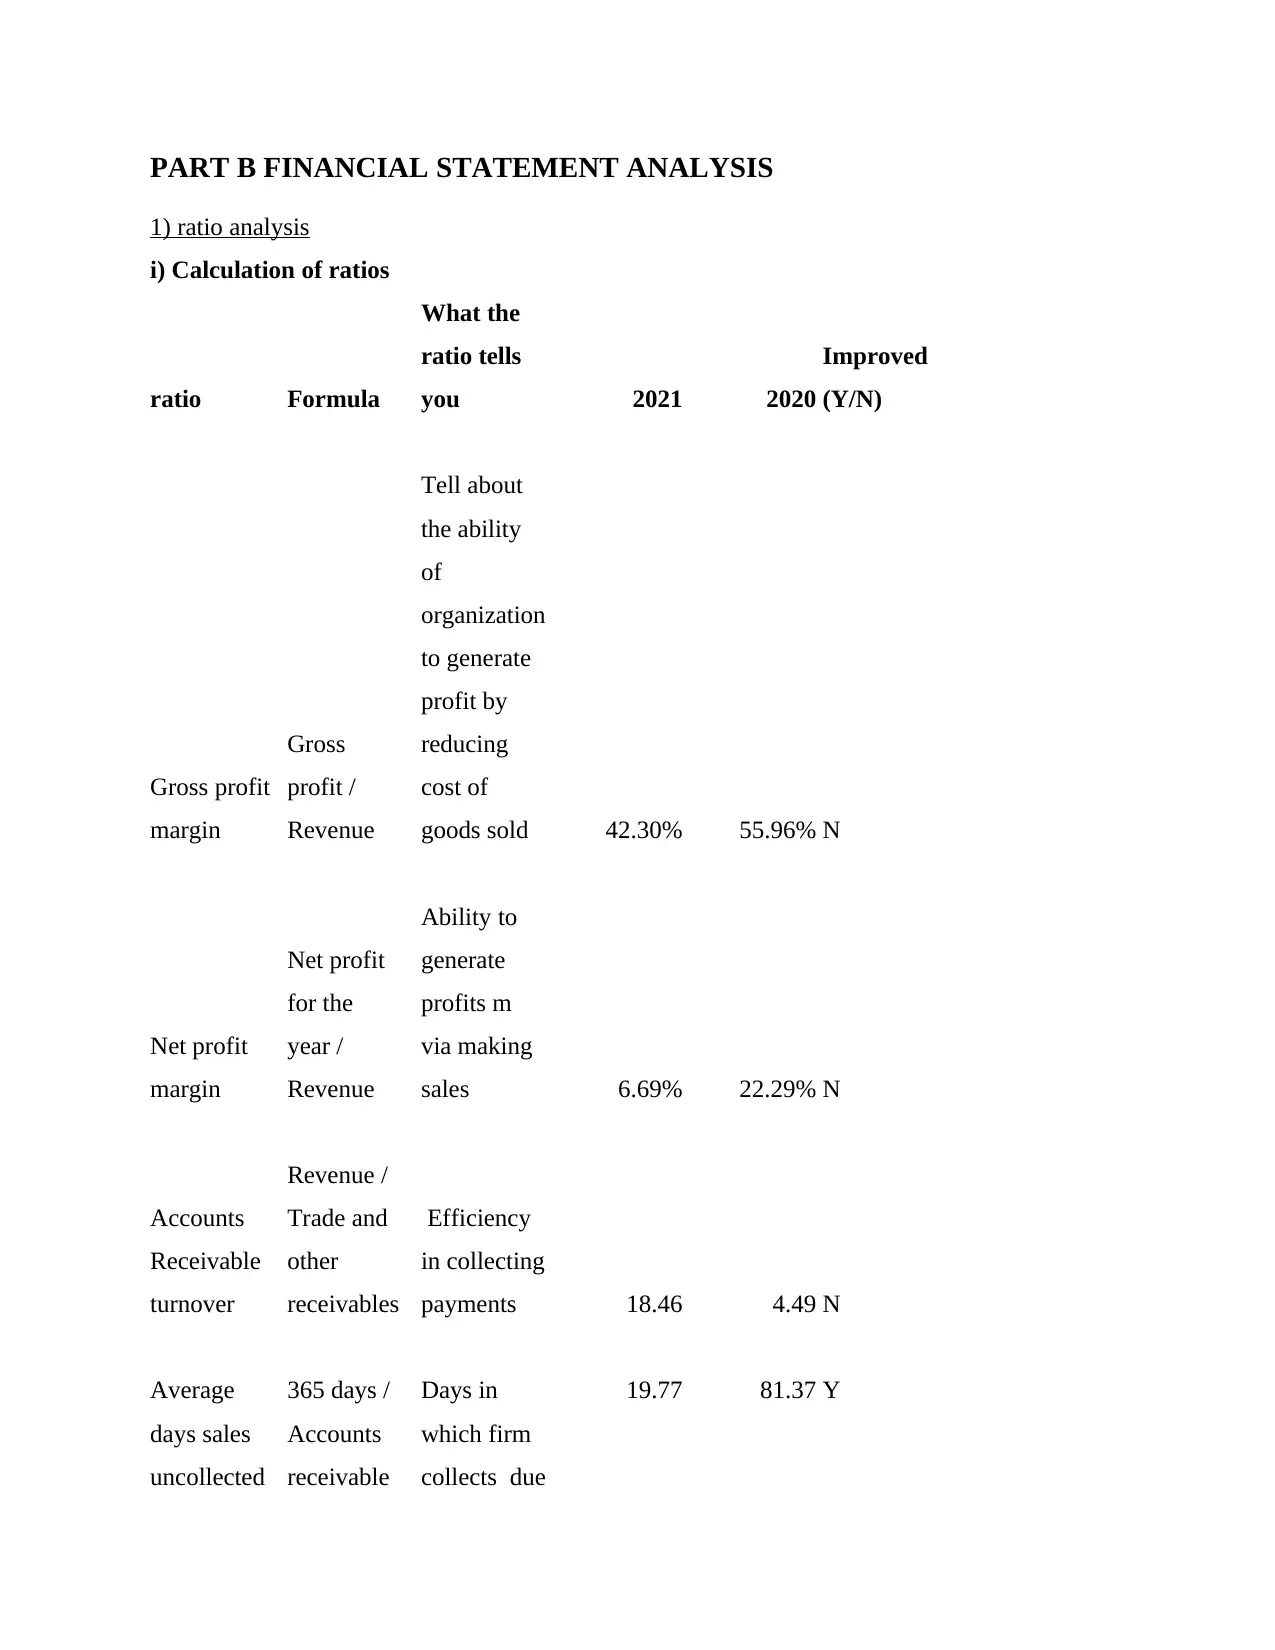
PART B FINANCIAL STATEMENT ANALYSIS
1) ratio analysis
i) Calculation of ratios
ratio Formula
What the
ratio tells
you 2021 2020
Improved
(Y/N)
Gross profit
margin
Gross
profit /
Revenue
Tell about
the ability
of
organization
to generate
profit by
reducing
cost of
goods sold 42.30% 55.96% N
Net profit
margin
Net profit
for the
year /
Revenue
Ability to
generate
profits m
via making
sales 6.69% 22.29% N
Accounts
Receivable
turnover
Revenue /
Trade and
other
receivables
Efficiency
in collecting
payments 18.46 4.49 N
Average
days sales
uncollected
365 days /
Accounts
receivable
Days in
which firm
collects due
19.77 81.37 Y
Paraphrase This Document
Need a fresh take? Get an instant paraphrase of this document with our AI Paraphraser
turnover payments
Inventory
turnover
Cost of
sales /
Average
inventory
Number of
times stock
is replaced
by making
sales 6.20 5.17 Y
Inventory
turnover in
days
365 days /
Inventory
turnover
Days taken
for sold h
and replaced
inventory
during given
period 58.90 70.56 Y
Current
Current
assets /
Current
liabilities
Ability to
overcome
short term
liabilities
with help of
current
assets 3.99 3.69 N
Quick (Current
assets –
inventory) /
current
liabilities
Efficiency
in
overcoming
current
liabilities
with help of
cash &
3.58 3.71 N
Inventory
turnover
Cost of
sales /
Average
inventory
Number of
times stock
is replaced
by making
sales 6.20 5.17 Y
Inventory
turnover in
days
365 days /
Inventory
turnover
Days taken
for sold h
and replaced
inventory
during given
period 58.90 70.56 Y
Current
Current
assets /
Current
liabilities
Ability to
overcome
short term
liabilities
with help of
current
assets 3.99 3.69 N
Quick (Current
assets –
inventory) /
current
liabilities
Efficiency
in
overcoming
current
liabilities
with help of
cash &
3.58 3.71 N
equivalent
assets
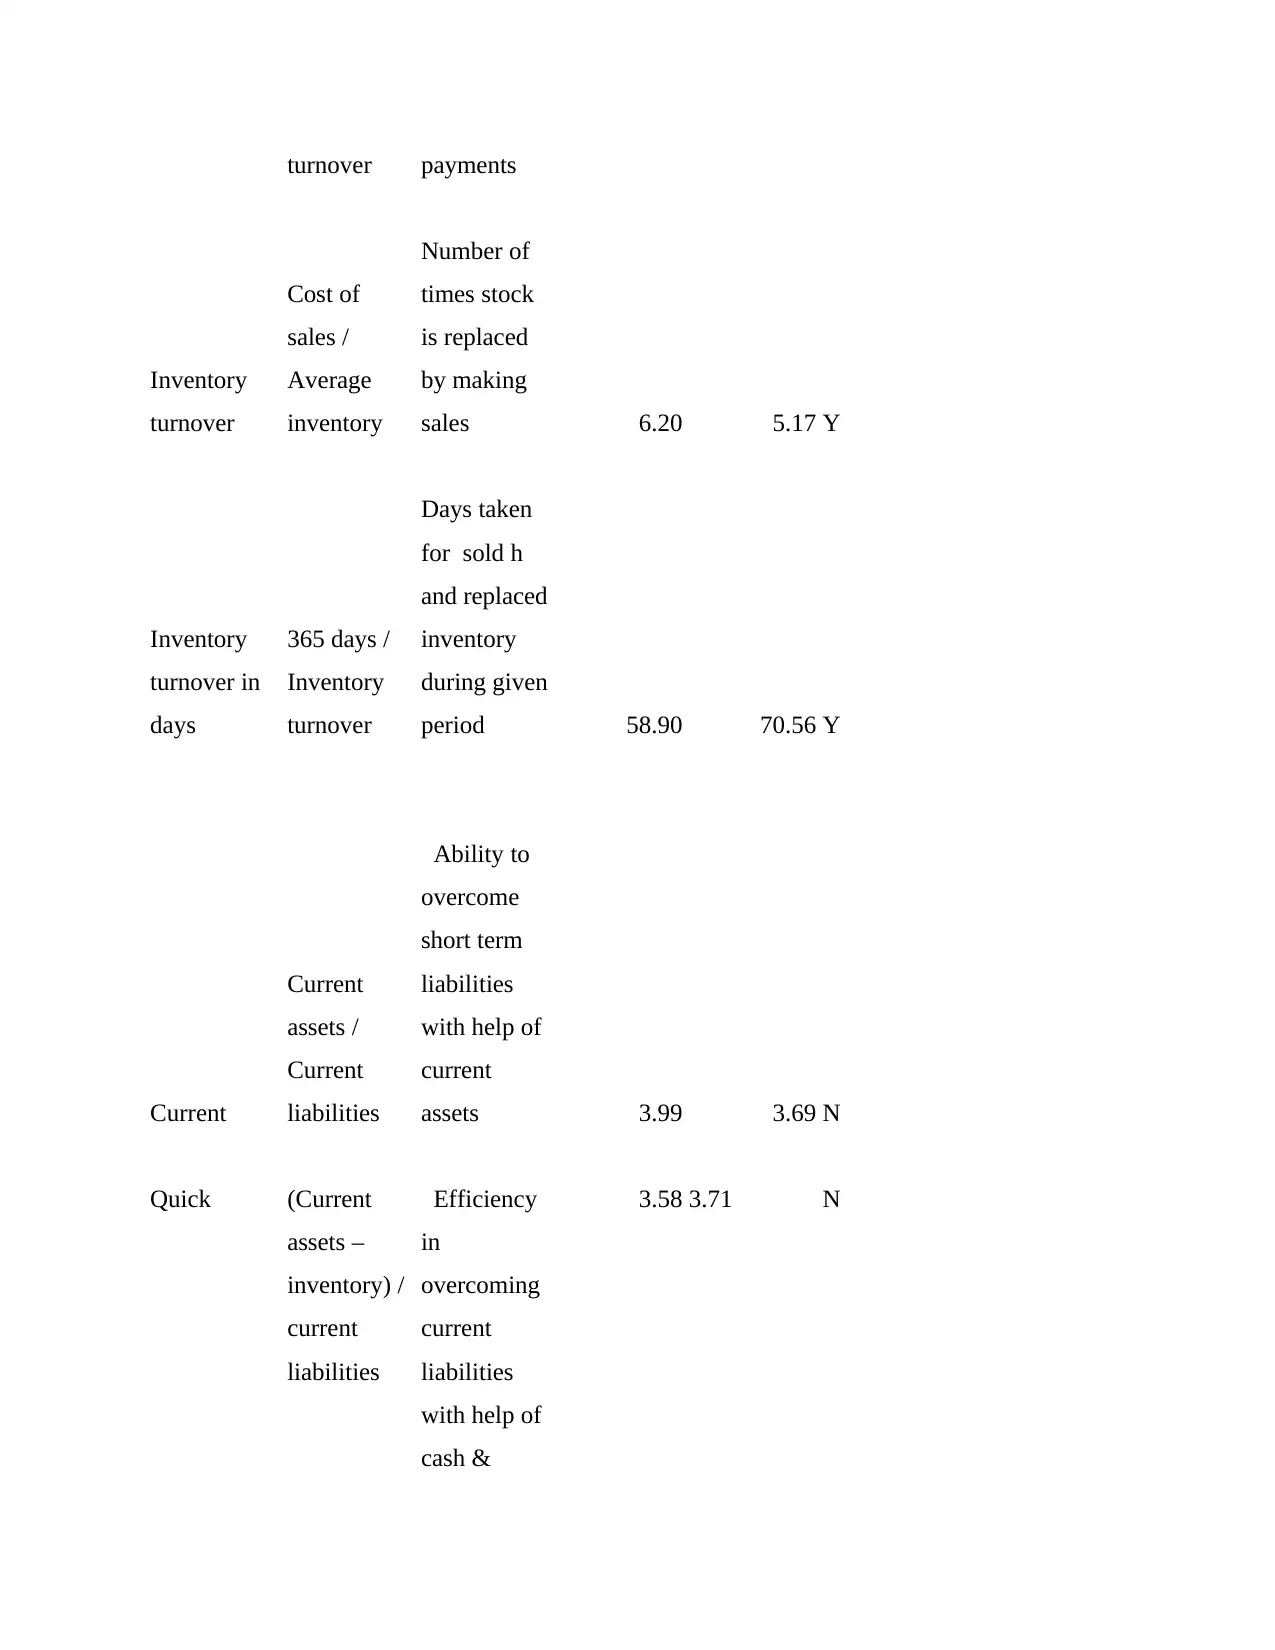
ii) Interpretation of financial performance
From the evaluation of the profitability ratio it can be specified that in the current year
firm is performing ineffectively as compared to the previous year. This provides red flag that
investor and other stakeholders can get negatively affected due to the prevailing declination
which is required to be improved in order to retain curial parties. The action to improve gross
profit includes reducing COGS, having reliable pricing strategies, etc (Pelekh and et.al., 2020).
In order to uplift the net prior margin increasing margin of profitability, inclining customer
conversion & retention rate, enhancing sales revenue, etc.
Solvency ratios allows to assess the credibility of firm by evaluating its ability to
overcome short liabilities with help of current and cash & equivalent assets (What is a Solvency
Ratio? 2022). It should pay attention on having compliance with ideal ratio as there is higher
than expected results for current and quick ratio. Current ratio is indicating improper investment
activities which is showing higher liquidity and required to be reduced. Quick ratio can be
improved to eliminate red flags by reducing current liabilities and having proper planning of cash
management. On the basis of this it can be specified that credibility is good but require certain
changes.
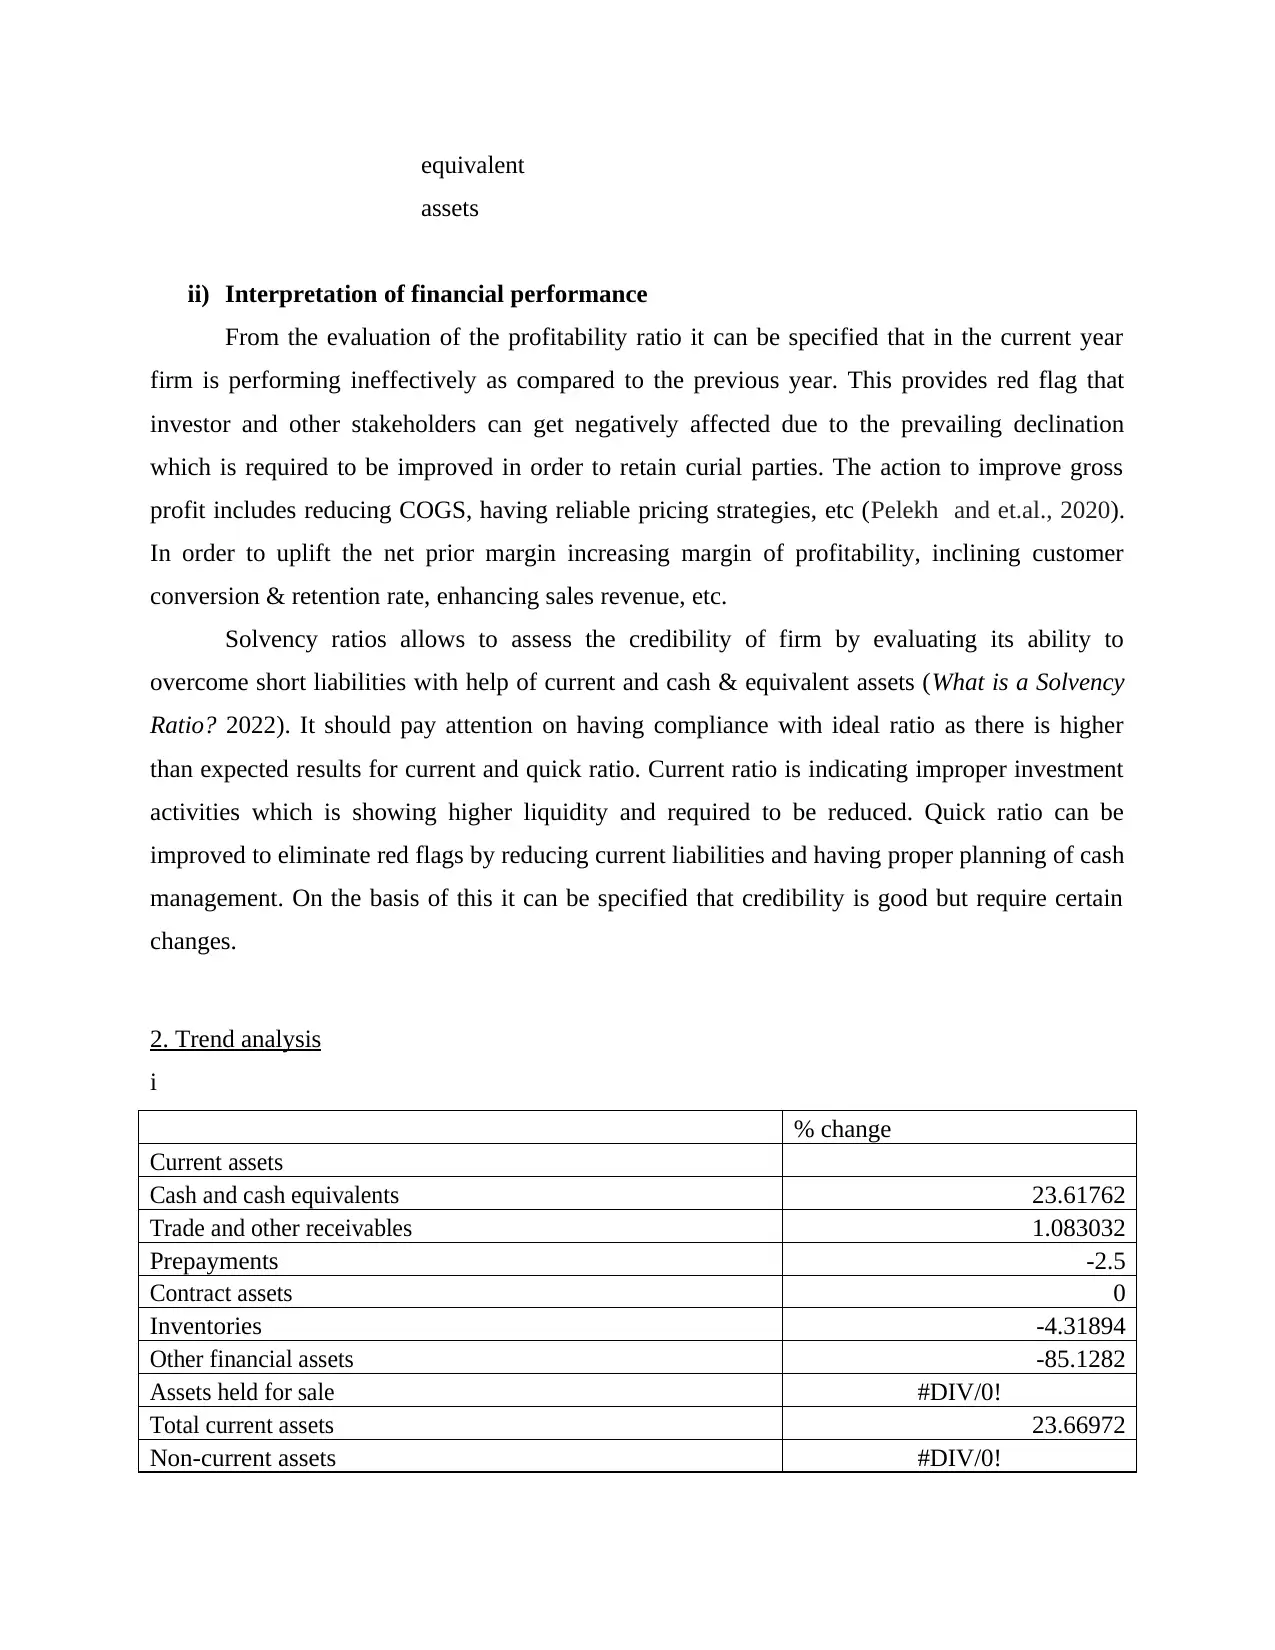
2. Trend analysis
i
% change
Current assets
Cash and cash equivalents 23.61762
Trade and other receivables 1.083032
Prepayments -2.5
Contract assets 0
Inventories -4.31894
Other financial assets -85.1282
Assets held for sale #DIV/0!
Total current assets 23.66972
Non-current assets #DIV/0!
assets
ii) Interpretation of financial performance
From the evaluation of the profitability ratio it can be specified that in the current year
firm is performing ineffectively as compared to the previous year. This provides red flag that
investor and other stakeholders can get negatively affected due to the prevailing declination
which is required to be improved in order to retain curial parties. The action to improve gross
profit includes reducing COGS, having reliable pricing strategies, etc (Pelekh and et.al., 2020).
In order to uplift the net prior margin increasing margin of profitability, inclining customer
conversion & retention rate, enhancing sales revenue, etc.
Solvency ratios allows to assess the credibility of firm by evaluating its ability to
overcome short liabilities with help of current and cash & equivalent assets (What is a Solvency
Ratio? 2022). It should pay attention on having compliance with ideal ratio as there is higher
than expected results for current and quick ratio. Current ratio is indicating improper investment
activities which is showing higher liquidity and required to be reduced. Quick ratio can be
improved to eliminate red flags by reducing current liabilities and having proper planning of cash
management. On the basis of this it can be specified that credibility is good but require certain
changes.
2. Trend analysis
i
% change
Current assets
Cash and cash equivalents 23.61762
Trade and other receivables 1.083032
Prepayments -2.5
Contract assets 0
Inventories -4.31894
Other financial assets -85.1282
Assets held for sale #DIV/0!
Total current assets 23.66972
Non-current assets #DIV/0!
⊘ This is a preview!⊘
Do you want full access?
Subscribe today to unlock all pages.
Trusted by 1+ million students worldwide
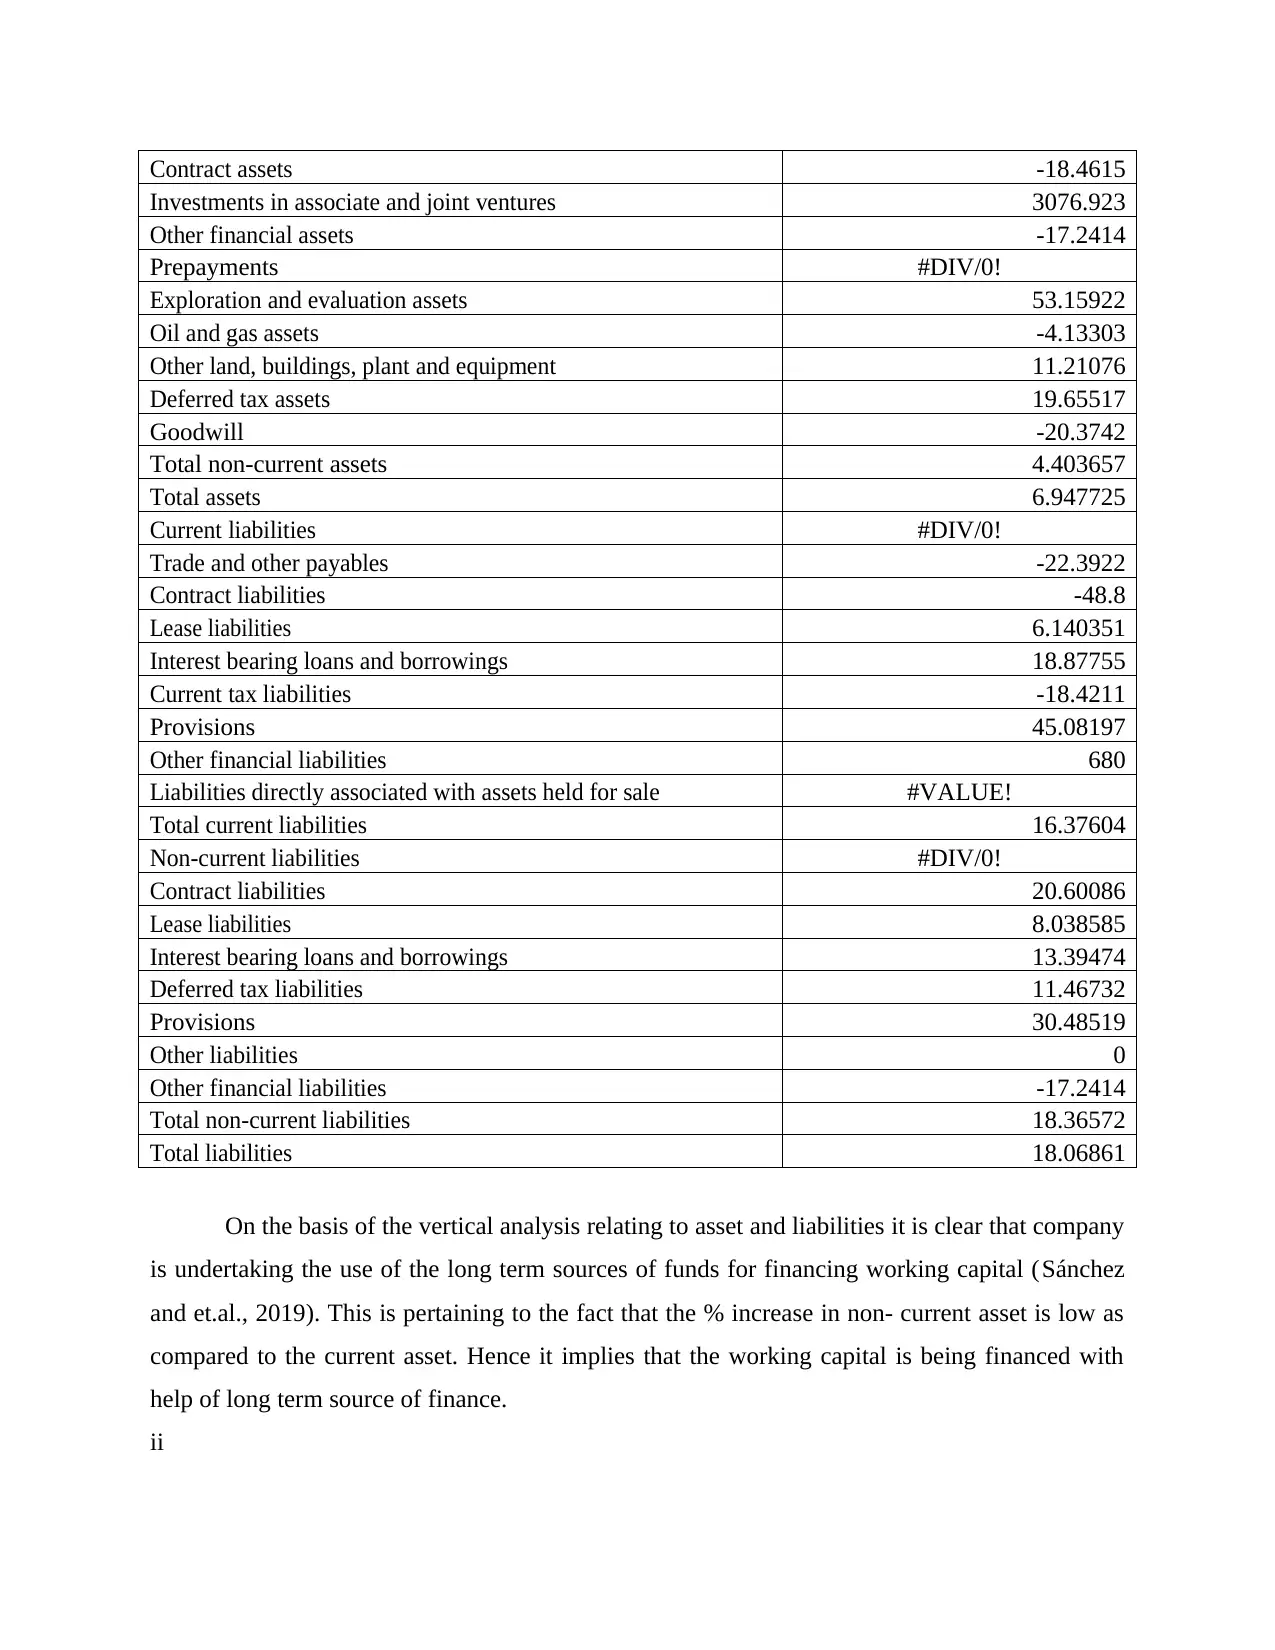
Contract assets -18.4615
Investments in associate and joint ventures 3076.923
Other financial assets -17.2414
Prepayments #DIV/0!
Exploration and evaluation assets 53.15922
Oil and gas assets -4.13303
Other land, buildings, plant and equipment 11.21076
Deferred tax assets 19.65517
Goodwill -20.3742
Total non-current assets 4.403657
Total assets 6.947725
Current liabilities #DIV/0!
Trade and other payables -22.3922
Contract liabilities -48.8
Lease liabilities 6.140351
Interest bearing loans and borrowings 18.87755
Current tax liabilities -18.4211
Provisions 45.08197
Other financial liabilities 680
Liabilities directly associated with assets held for sale #VALUE!
Total current liabilities 16.37604
Non-current liabilities #DIV/0!
Contract liabilities 20.60086
Lease liabilities 8.038585
Interest bearing loans and borrowings 13.39474
Deferred tax liabilities 11.46732
Provisions 30.48519
Other liabilities 0
Other financial liabilities -17.2414
Total non-current liabilities 18.36572
Total liabilities 18.06861
On the basis of the vertical analysis relating to asset and liabilities it is clear that company
is undertaking the use of the long term sources of funds for financing working capital (Sánchez
and et.al., 2019). This is pertaining to the fact that the % increase in non- current asset is low as
compared to the current asset. Hence it implies that the working capital is being financed with
help of long term source of finance.
ii
Paraphrase This Document
Need a fresh take? Get an instant paraphrase of this document with our AI Paraphraser
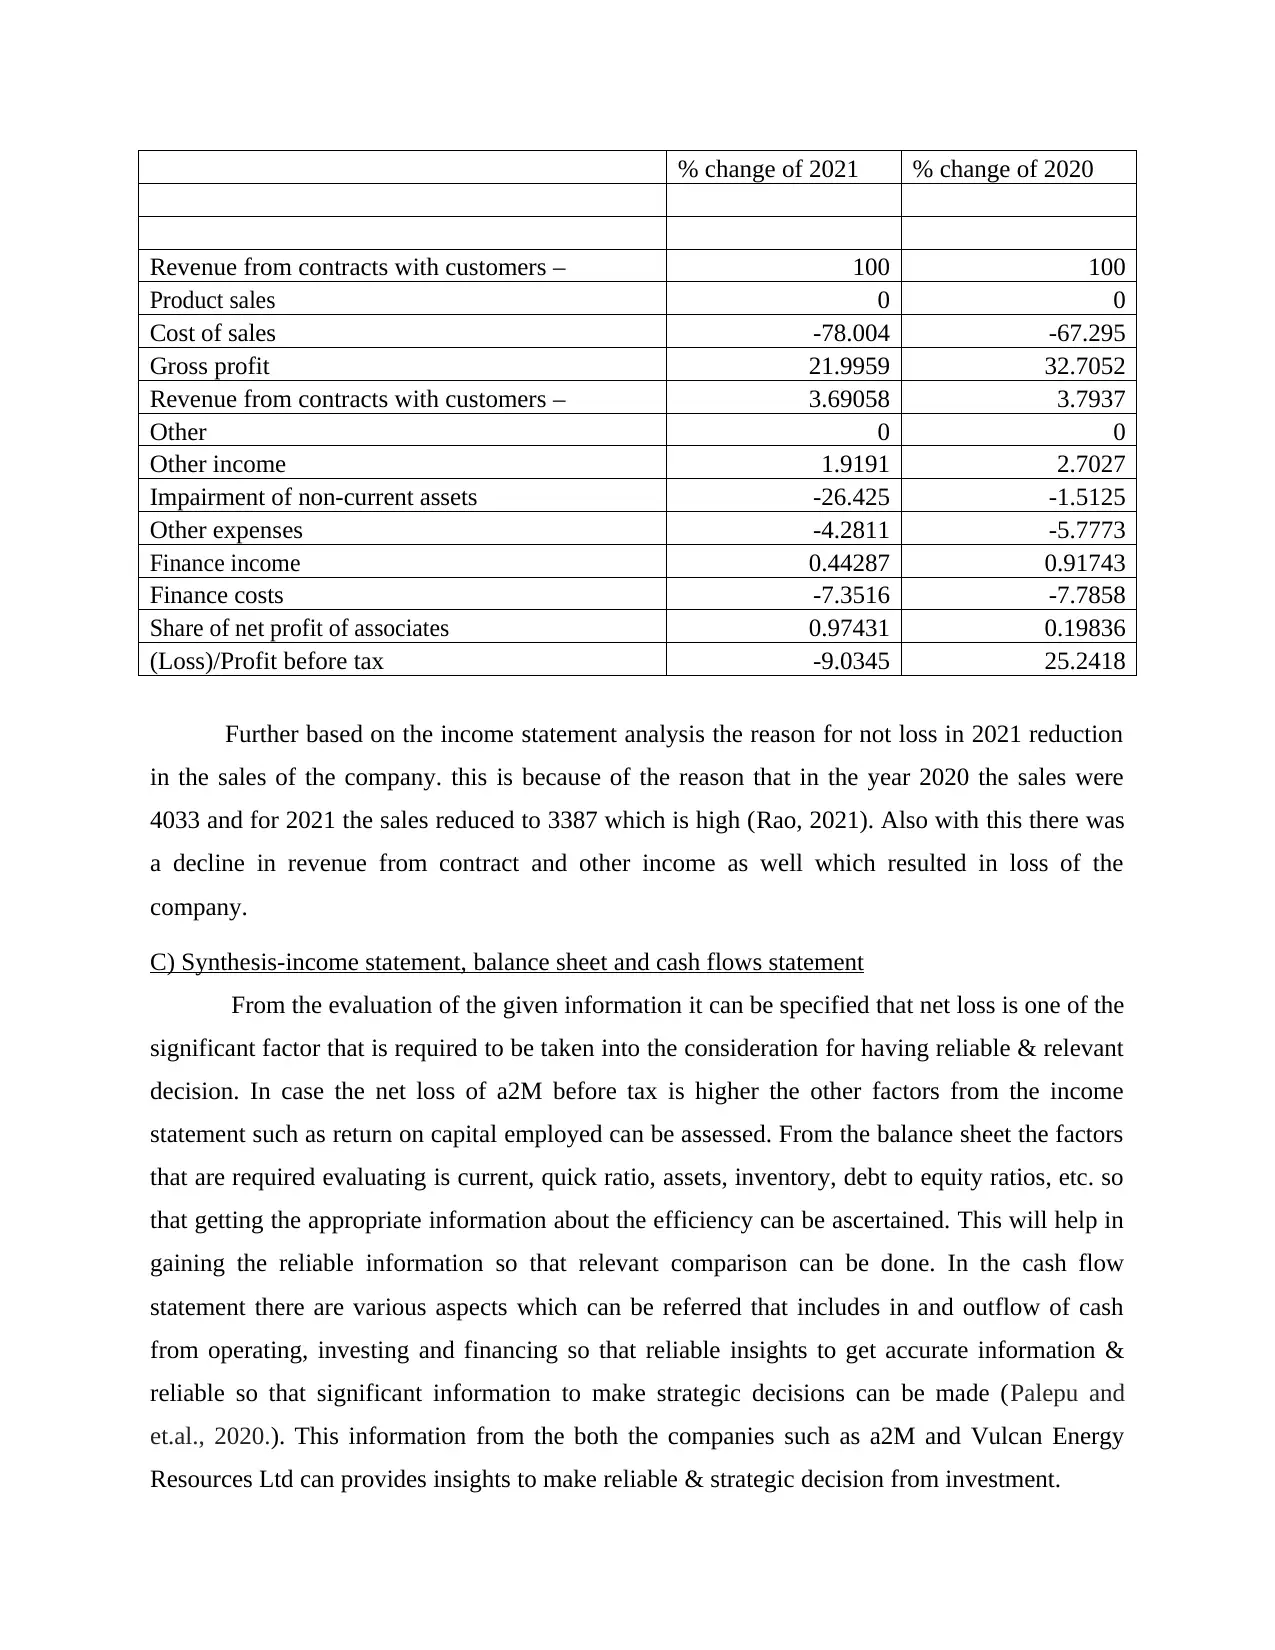
% change of 2021 % change of 2020
Revenue from contracts with customers – 100 100
Product sales 0 0
Cost of sales -78.004 -67.295
Gross profit 21.9959 32.7052
Revenue from contracts with customers – 3.69058 3.7937
Other 0 0
Other income 1.9191 2.7027
Impairment of non-current assets -26.425 -1.5125
Other expenses -4.2811 -5.7773
Finance income 0.44287 0.91743
Finance costs -7.3516 -7.7858
Share of net profit of associates 0.97431 0.19836
(Loss)/Profit before tax -9.0345 25.2418
Further based on the income statement analysis the reason for not loss in 2021 reduction
in the sales of the company. this is because of the reason that in the year 2020 the sales were
4033 and for 2021 the sales reduced to 3387 which is high (Rao, 2021). Also with this there was
a decline in revenue from contract and other income as well which resulted in loss of the
company.
C) Synthesis-income statement, balance sheet and cash flows statement
From the evaluation of the given information it can be specified that net loss is one of the
significant factor that is required to be taken into the consideration for having reliable & relevant
decision. In case the net loss of a2M before tax is higher the other factors from the income
statement such as return on capital employed can be assessed. From the balance sheet the factors
that are required evaluating is current, quick ratio, assets, inventory, debt to equity ratios, etc. so
that getting the appropriate information about the efficiency can be ascertained. This will help in
gaining the reliable information so that relevant comparison can be done. In the cash flow
statement there are various aspects which can be referred that includes in and outflow of cash
from operating, investing and financing so that reliable insights to get accurate information &
reliable so that significant information to make strategic decisions can be made (Palepu and
et.al., 2020.). This information from the both the companies such as a2M and Vulcan Energy
Resources Ltd can provides insights to make reliable & strategic decision from investment.
Part D Profit or cash flows
From the assessment it can be specified that the cash flow statements is highly reliable
in order to get the appropriate information so that strategic decision can be formulated (Easton
and et.al., 2018). This statement as compared to the income pay attention on reflecting the
changes prevailing in the cash inflows and outflows that provides the reliable insights from the
realistic perspective. This tends to offer higher realistic insights for decision-making. On the
other side, income statement is related with gaining the information about the profitability which
has nothing to do with cash so taking into consideration as compared to cash flow might not
offer the relevant information to investors to make decisions.
Part E
From the evaluation of the obtained information it can be specified that there are different
kinds of the learning that has been developed in me. This learning comprises having data
analysis by computing the figures, significant concentration on each detail in turn reliable
information to get make strategic decision. Time management via ensuring the completion of
project through meeting deadlines. The insights about the various technique of evaluating
financial of firm such as ratio & technical to obtain relevant information for decision-making
procedure. This learning is helpful in effective insights through data analysts, etc so that
investment & long term decision can be made,
⊘ This is a preview!⊘
Do you want full access?
Subscribe today to unlock all pages.
Trusted by 1+ million students worldwide
REFERENCES
Books and Journals
Easton, P.D. And et.al., 2018. Financial statement analysis & valuation. Boston, MA:
Cambridge Business Publishers.
Jadhav, M. S. V., 2019. Cash Flow Statement Analysis. Think India Journal. 22(4). pp.8418-
8427.
Palepu, K.G. and et.al., 2020. Business analysis and valuation: Using financial statements.
Cengage AU.
Pelekh, U and et.al., 2020. Financial statements as a management tool. Management Science
Letters. 10(1). pp.197-208.
Rao, P. M., 2021. Financial statement analysis and reporting. PHI Learning Pvt. Ltd..
Sánchez, M. N. and et.al., 2019. Experimental validation of a numerical model of a ventilated
façade with horizontal and vertical open joints. Energies. 13(1). p.146.
Online
What is a Solvency Ratio? 2022. [Online]. Available through:
<https://corporatefinanceinstitute.com/resources/knowledge/finance/solvency-ratio/>
1 out of 10
Related Documents


Your All-in-One AI-Powered Toolkit for Academic Success.
+13062052269
info@desklib.com
Available 24*7 on WhatsApp / Email
![[object Object]](/_next/static/media/star-bottom.7253800d.svg)
Unlock your academic potential
Copyright © 2020–2026 A2Z Services. All Rights Reserved. Developed and managed by ZUCOL.