Sales Forecasting and Inventory Management for A-CAT Corporation
VerifiedAdded on 2019/09/13
|6
|959
|53
Report
AI Summary
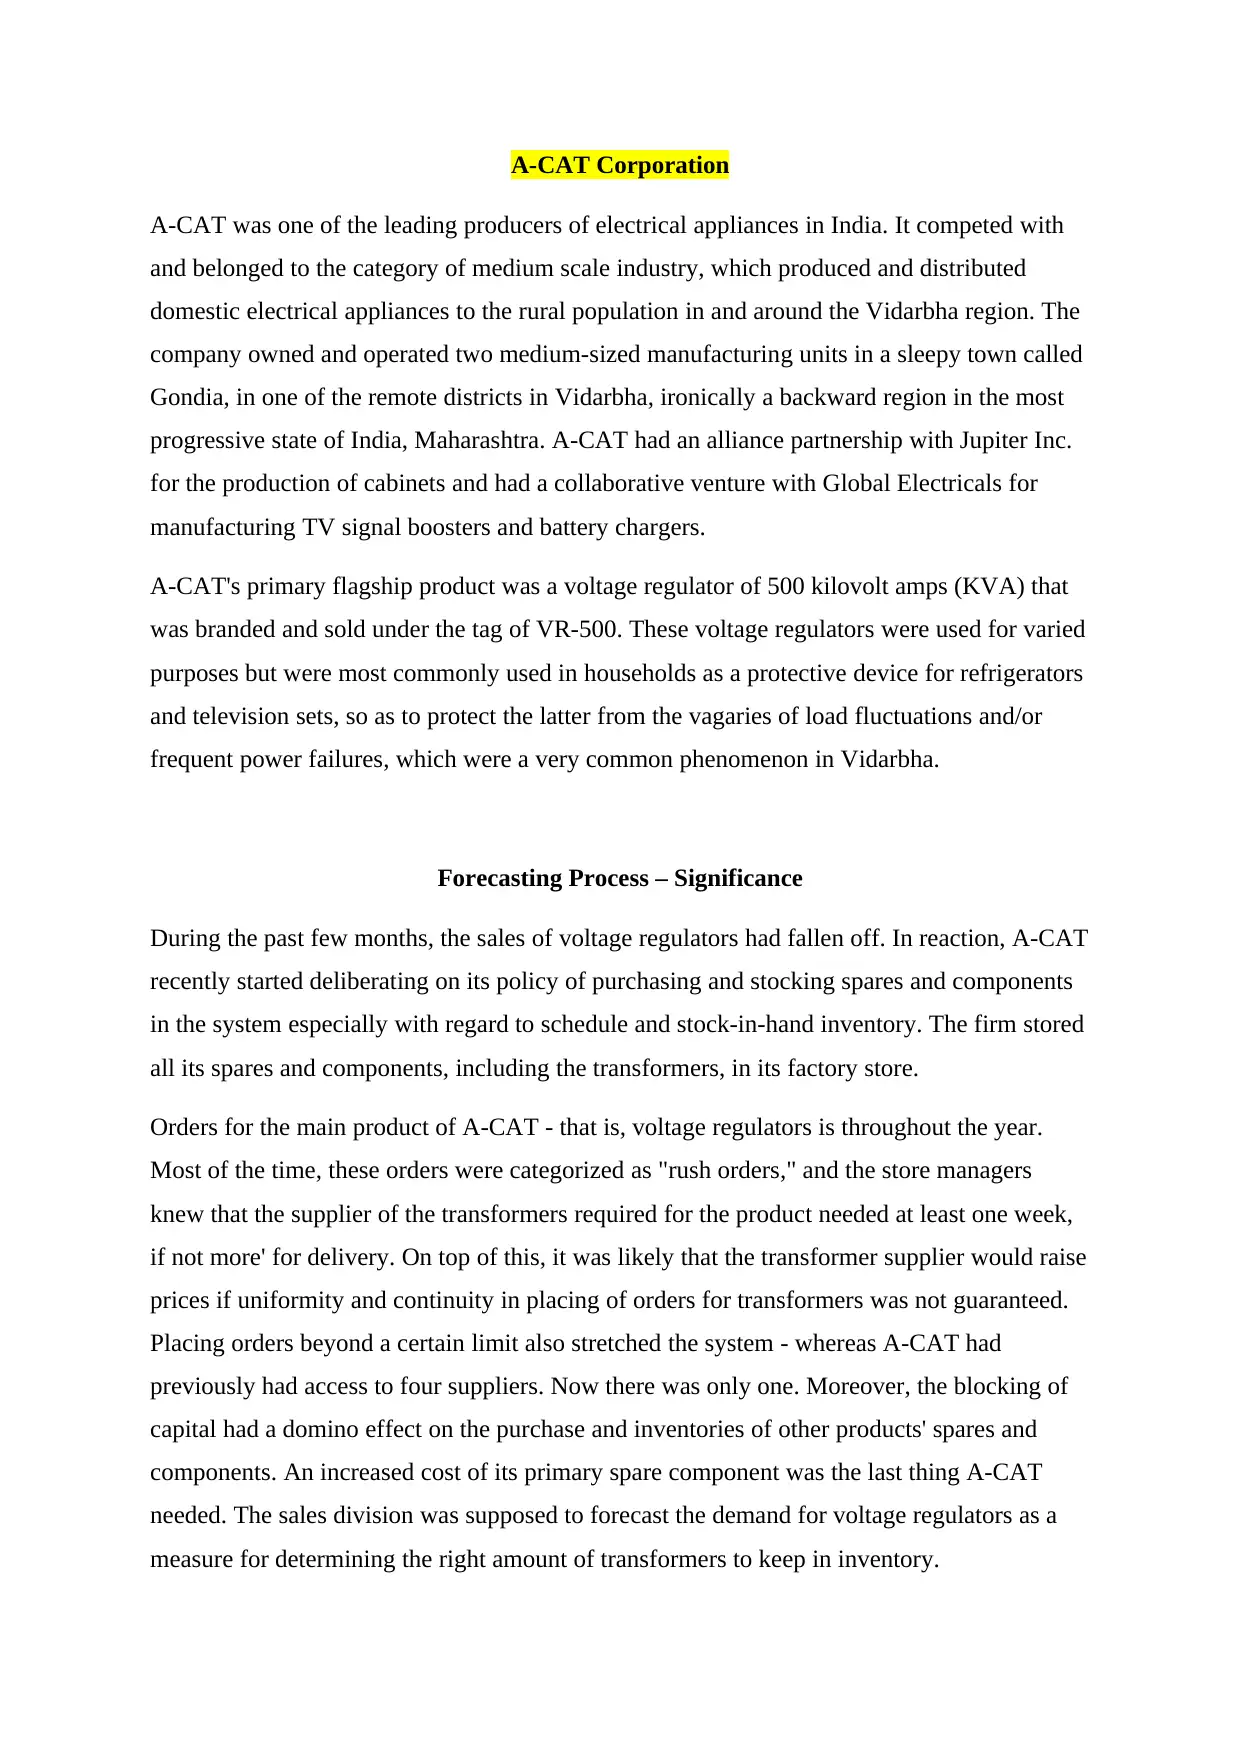
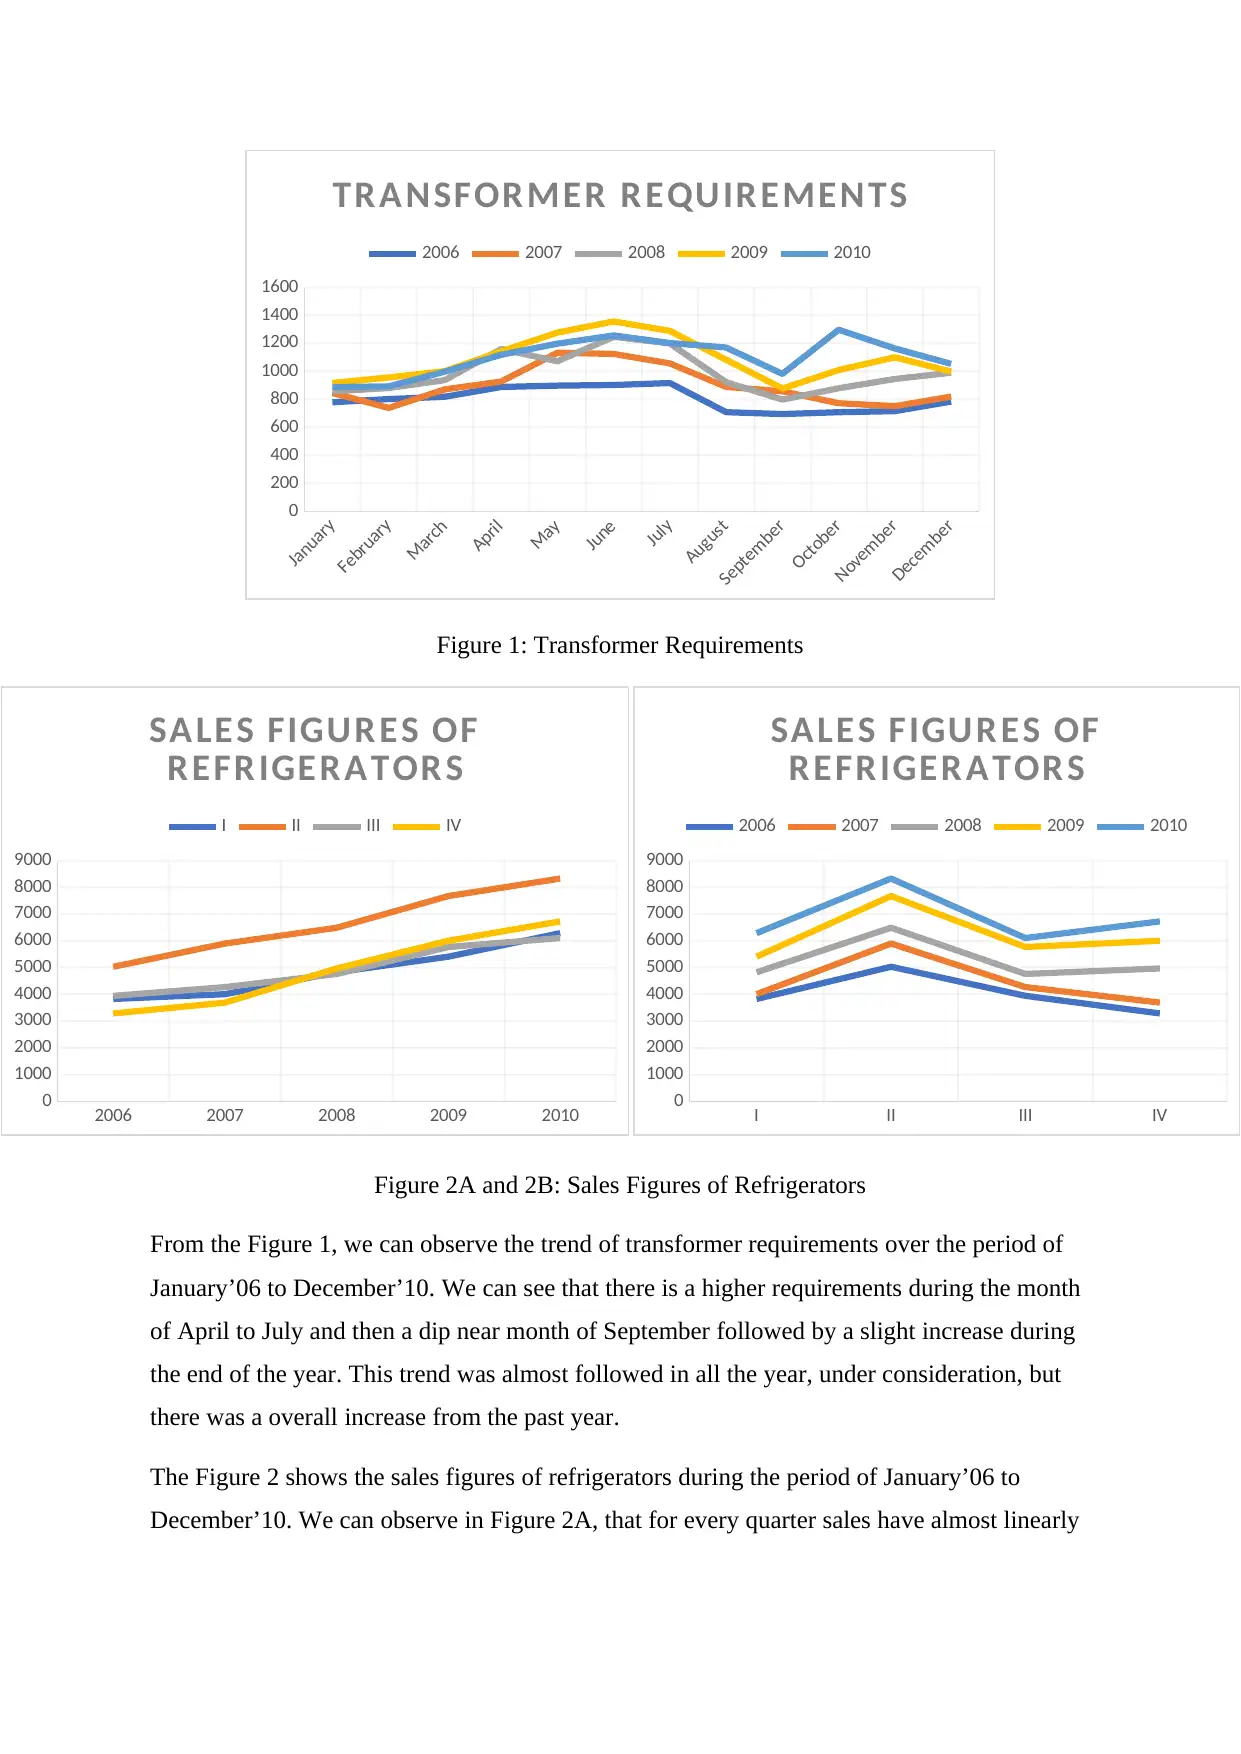
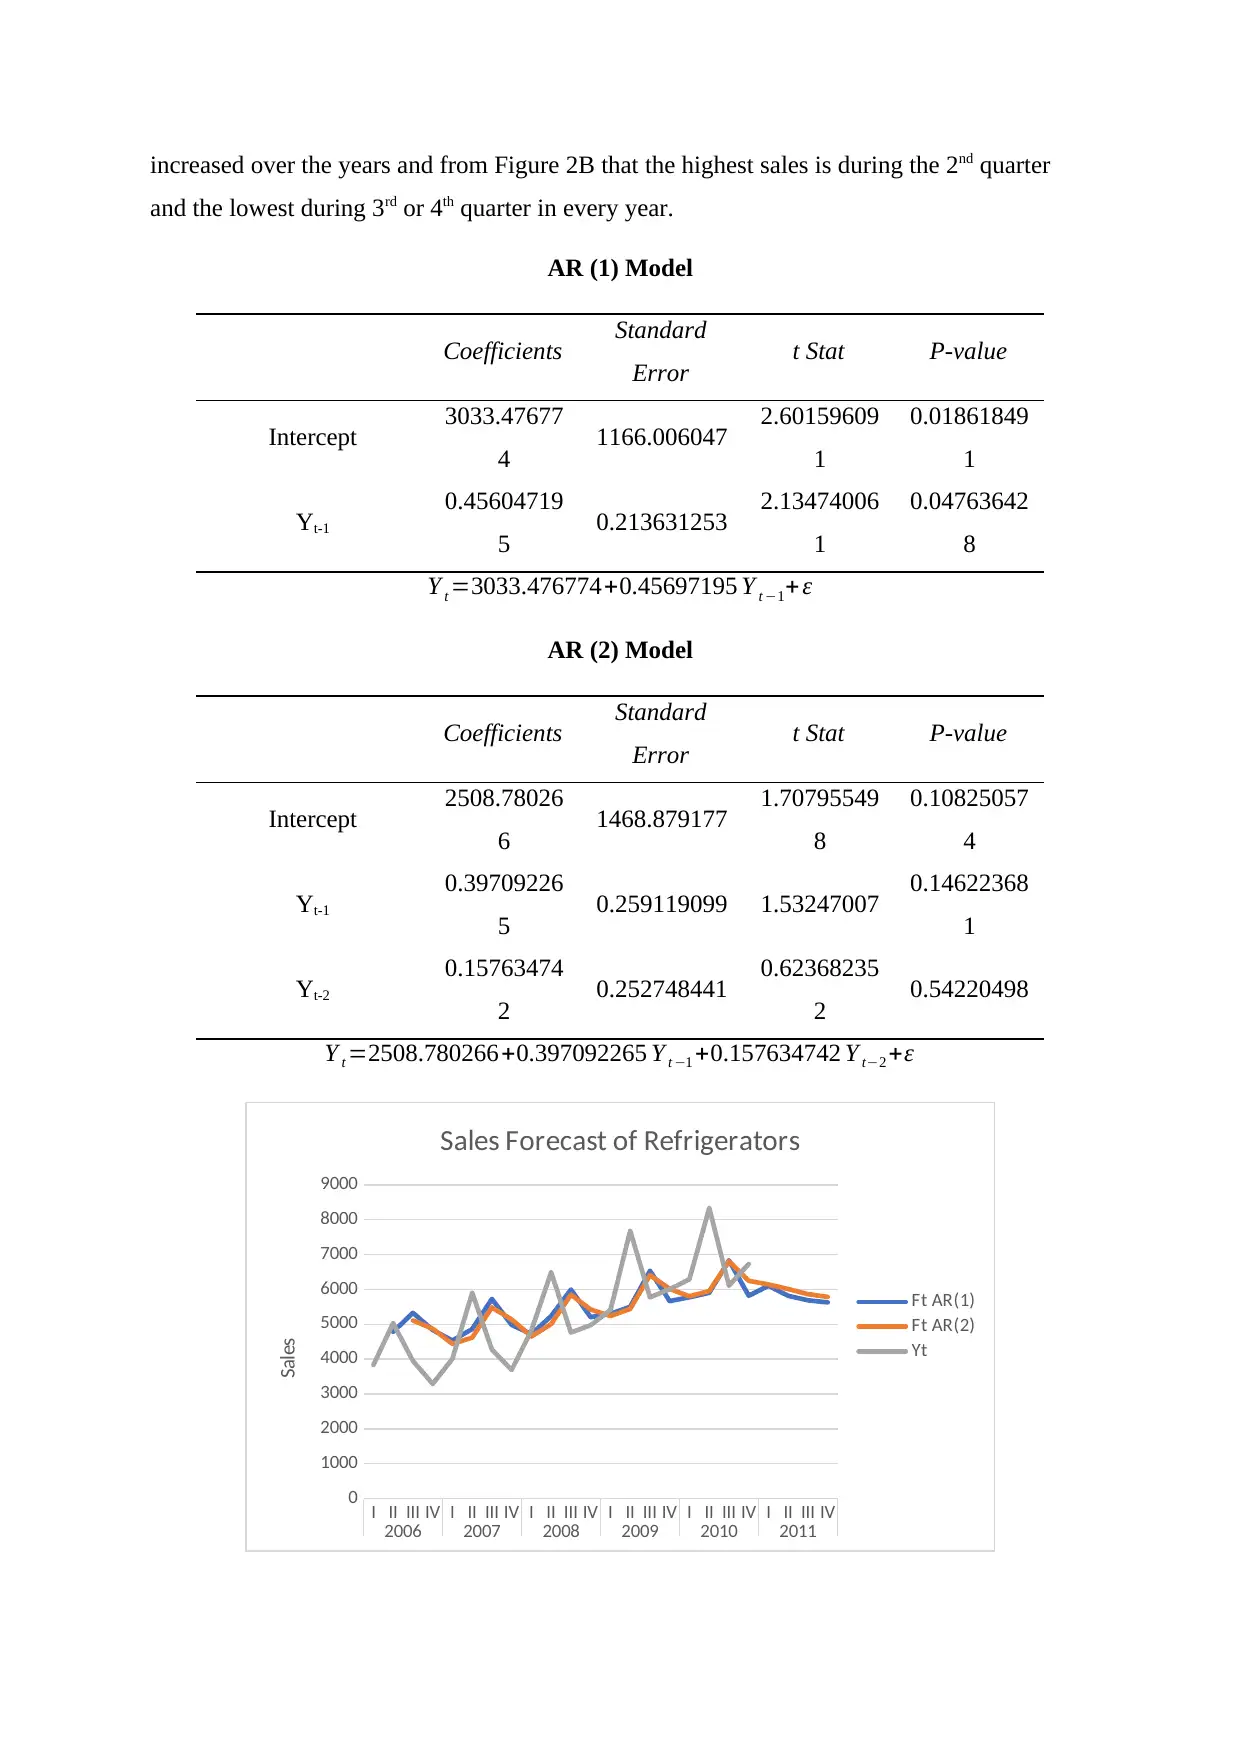
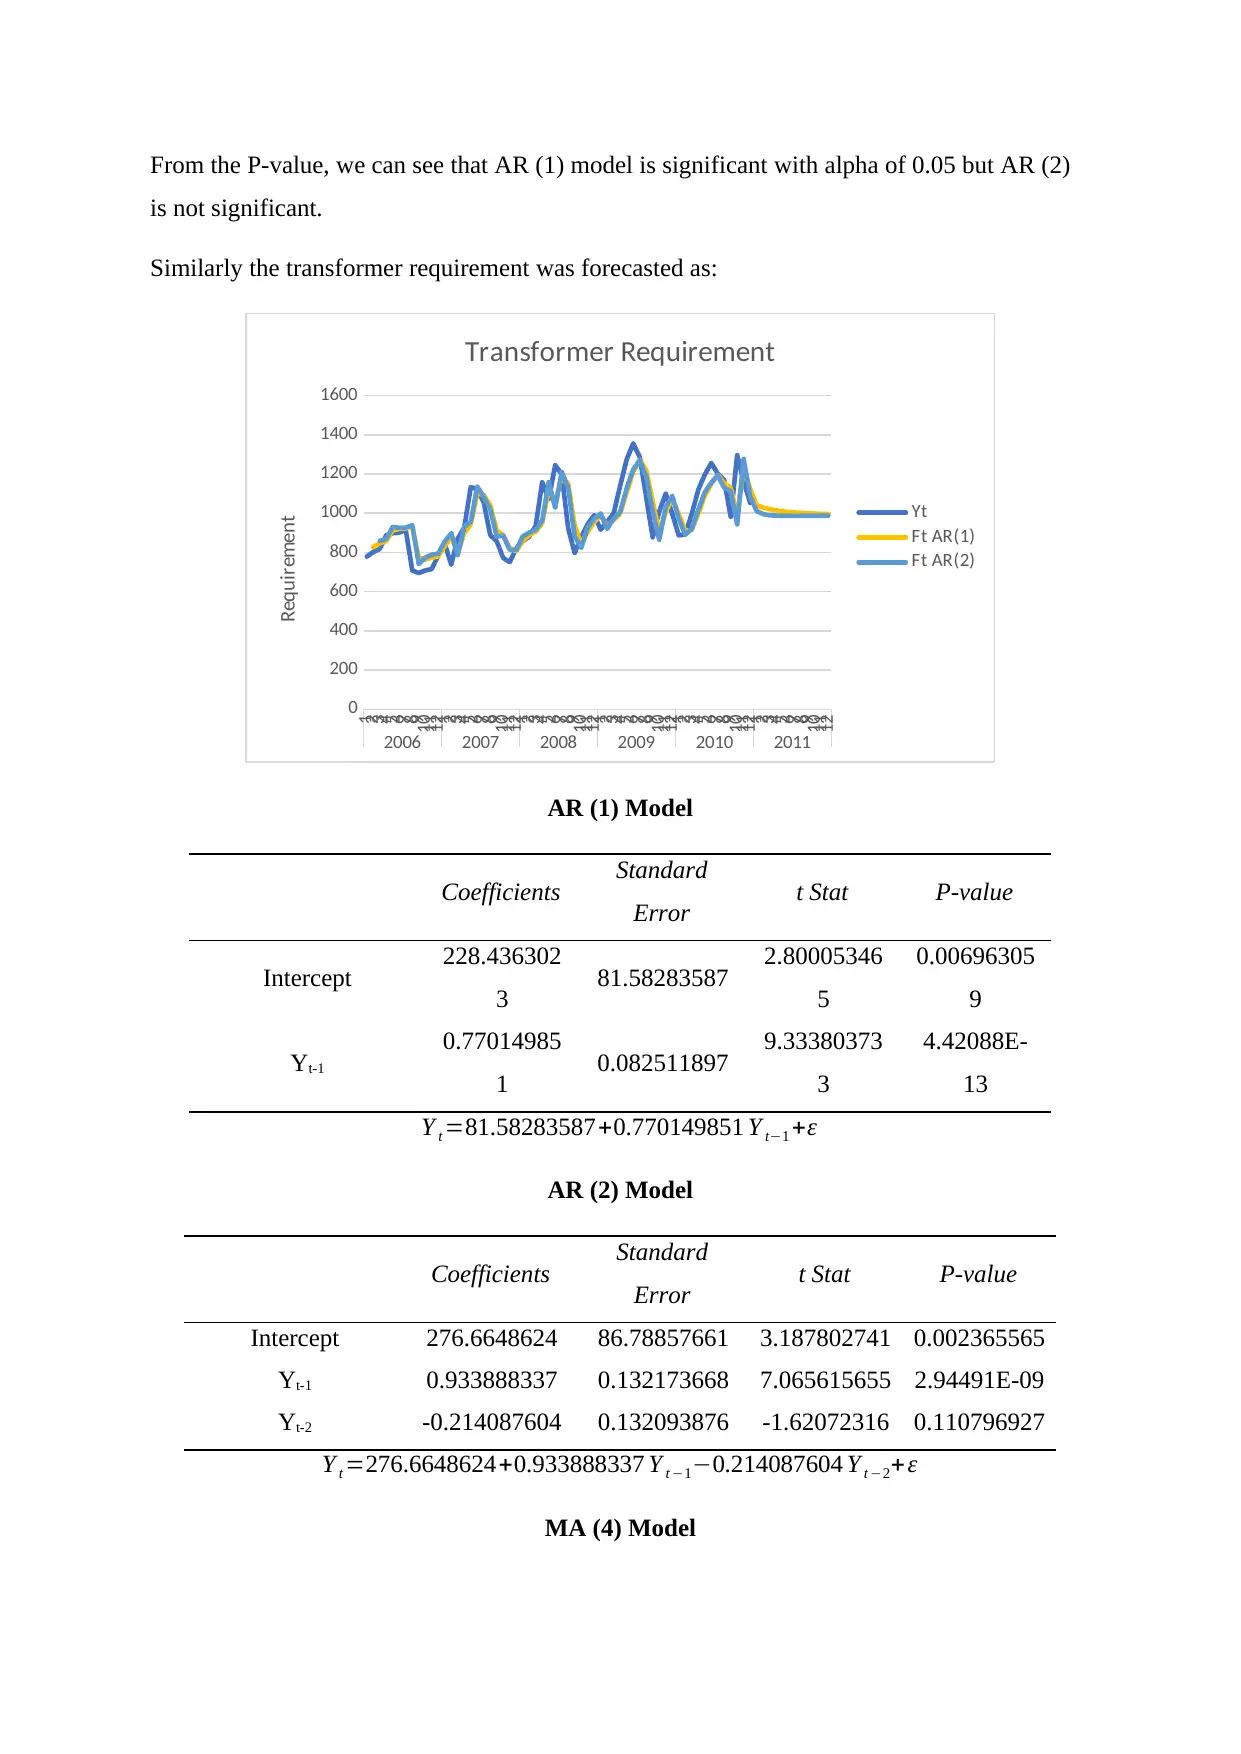
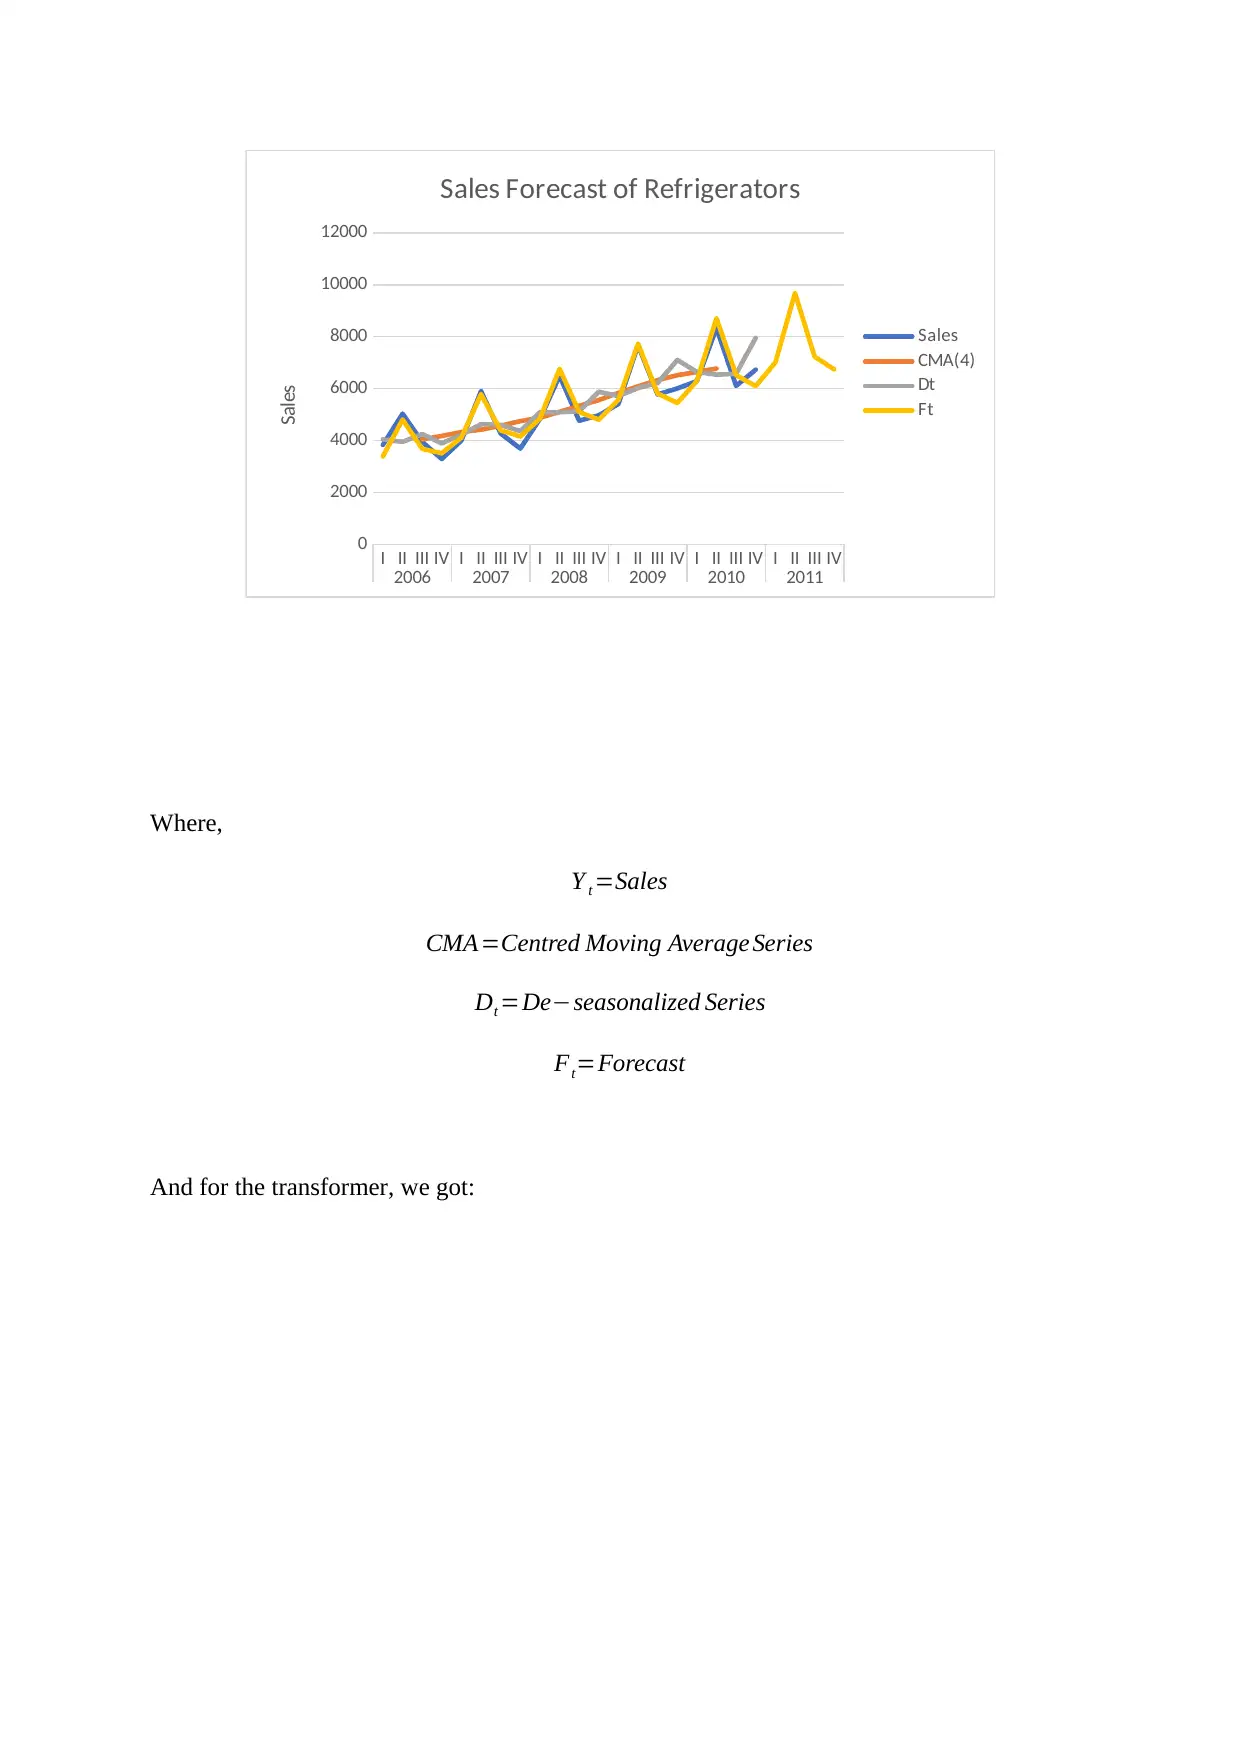
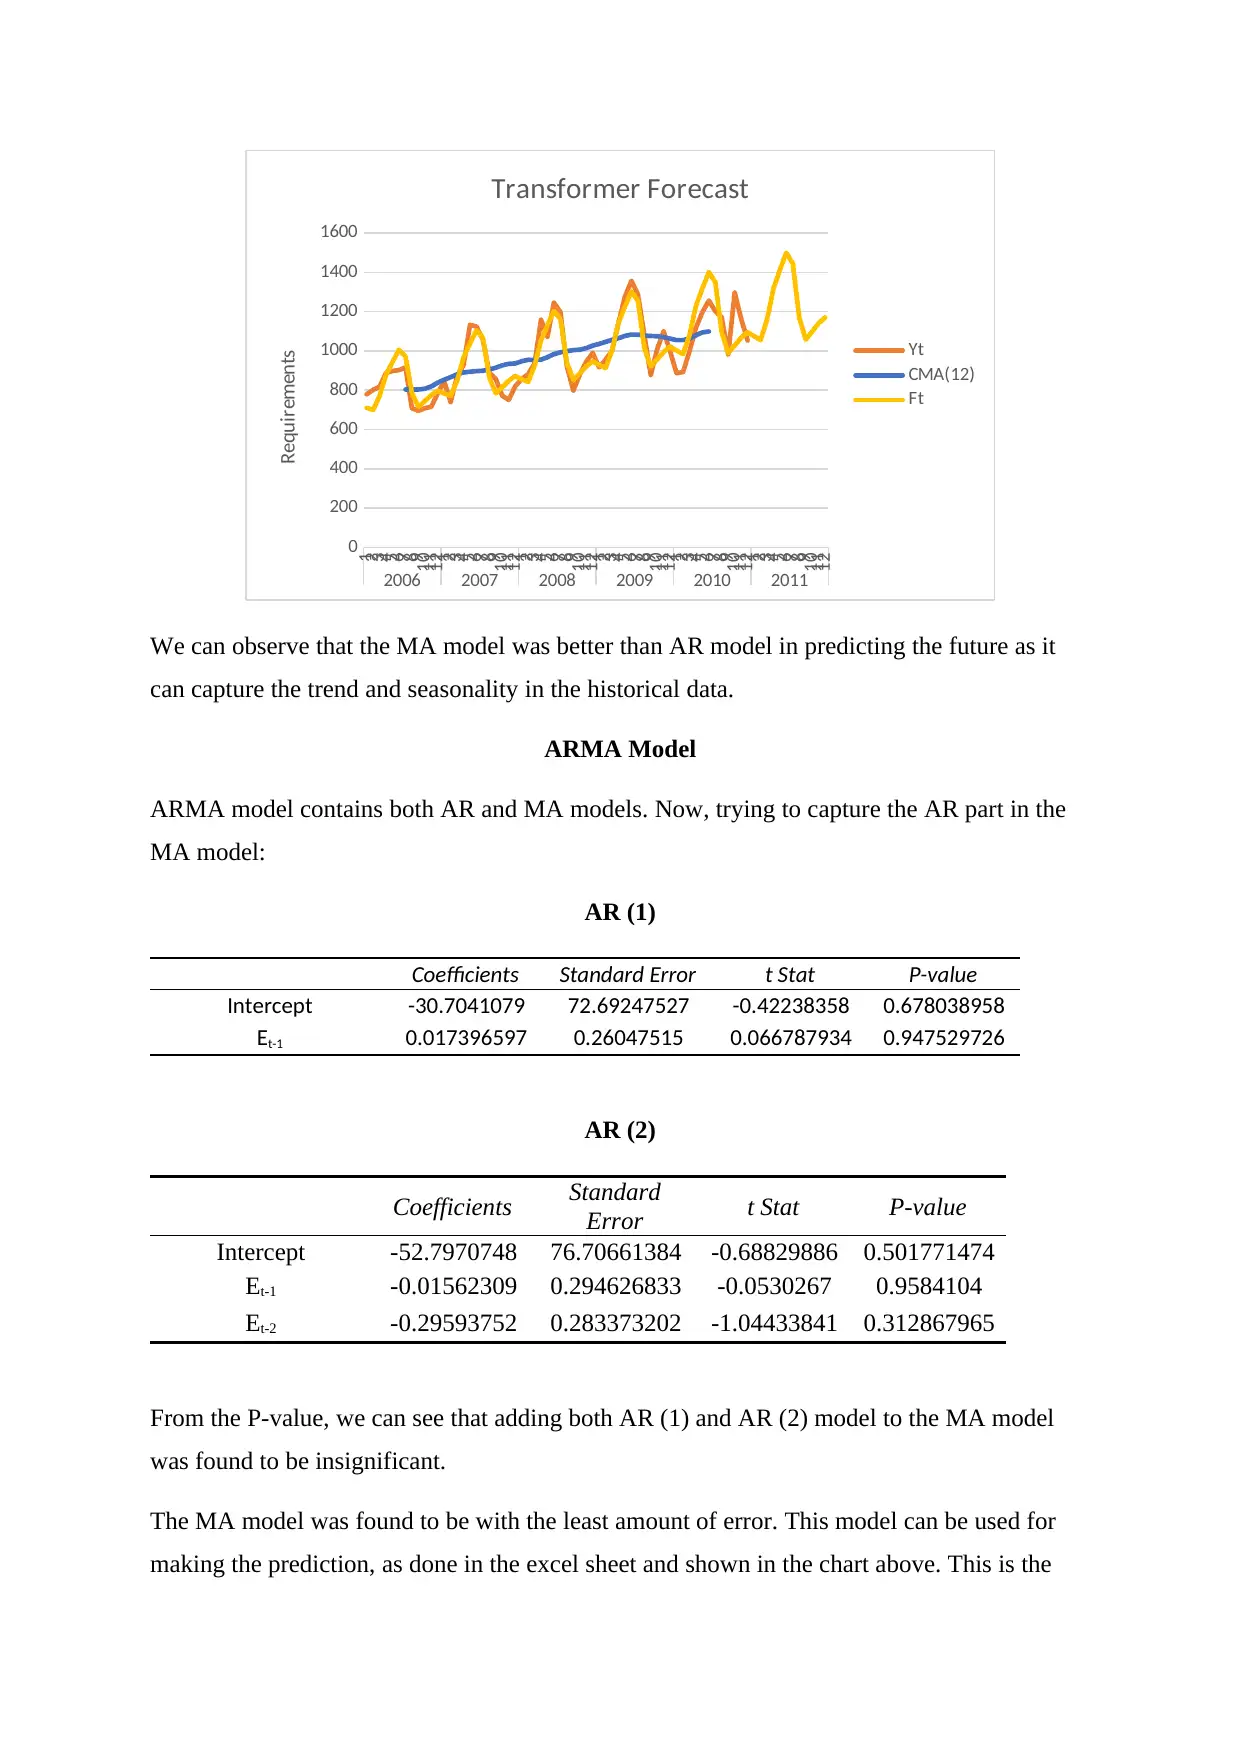
This report analyzes the sales forecasting and inventory management challenges faced by A-CAT Corporation, a leading electrical appliance producer in India. The company experienced declining sales of its primary product, voltage regulators (VR-500), prompting an investigation into its inventory practices, particularly the procurement of transformers. The report examines historical sales data and transformer requirements from January 2006 to December 2010, revealing seasonal trends. It applies various time series models, including Autoregressive (AR), Moving Average (MA), and Autoregressive Moving Average (ARMA) models, to forecast future demand. The analysis indicates that the MA model performed best, capturing the trend and seasonality in the historical data. The report concludes that while the MA model provides the best fit within the discussed models, the search for an optimal forecasting model is an ongoing process. The report provides insights into the significance of forecasting in determining the correct amount of transformers to keep in inventory. The analysis includes the impact of supplier relationships and potential price fluctuations. The report also includes the analysis of sales figures of refrigerators during the period of January’06 to December’10 and their relation with the transformer requirements.
1 out of 6


Your All-in-One AI-Powered Toolkit for Academic Success.
+13062052269
info@desklib.com
Available 24*7 on WhatsApp / Email
![[object Object]](/_next/static/media/star-bottom.7253800d.svg)
Copyright © 2020–2026 A2Z Services. All Rights Reserved. Developed and managed by ZUCOL.