MBS539 Major Assignment: Financial Analysis of a2 Milk Company
VerifiedAdded on 2022/11/14
|7
|773
|358
Report
AI Summary
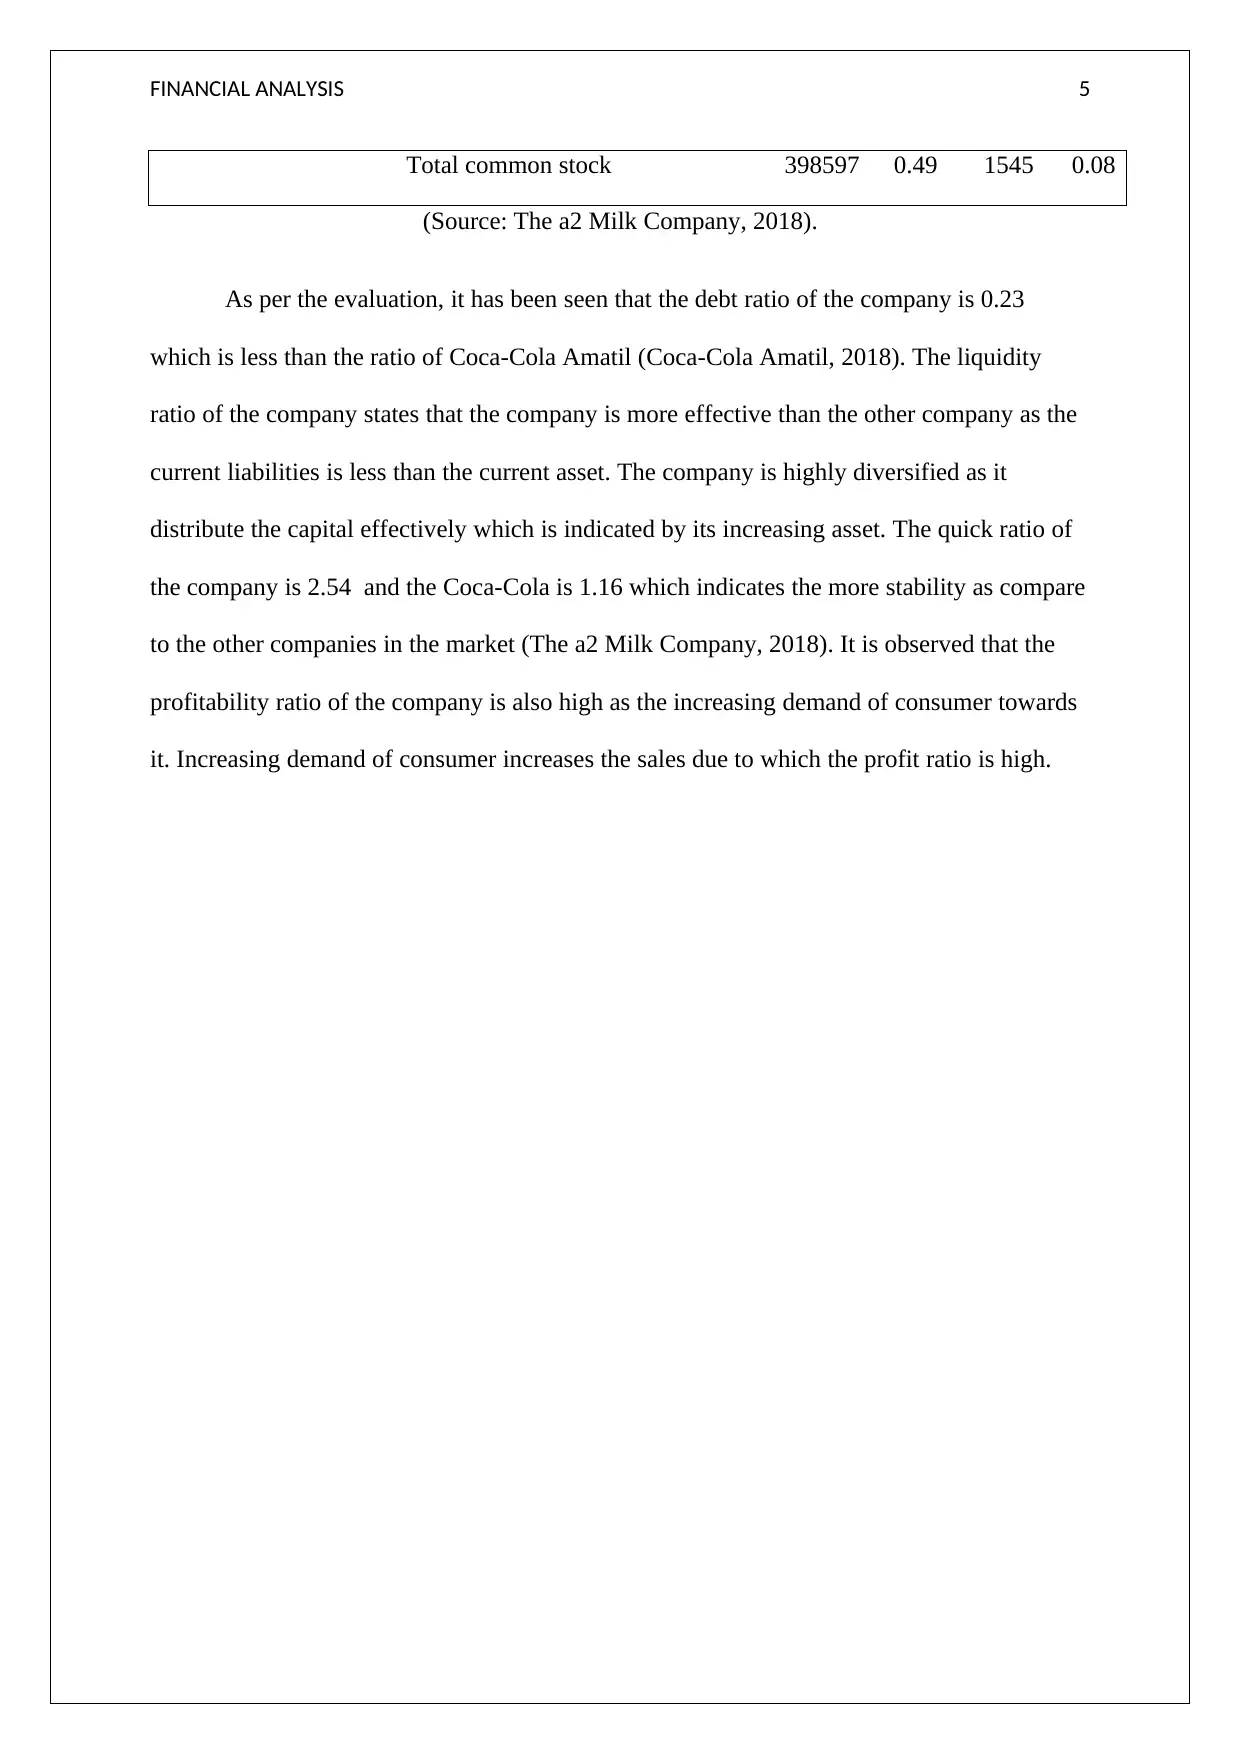
This report provides a financial analysis of the a2 Milk Company, comparing its performance with Coca-Cola Amatil. The analysis focuses on key financial statements, including the income statement and balance sheet, and employs horizontal and vertical analysis to assess trends. Ratio analysis is used to evaluate profitability, liquidity, and debt, revealing the company's financial strengths and weaknesses. The report highlights the a2 Milk Company's strong performance in terms of sales growth, profitability ratios, and liquidity, while also considering its debt levels. The analysis draws on the company's annual reports and provides insights into its financial position and future growth prospects within the food and beverage industry. The report concludes with a summary of the company's financial health and its position relative to a competitor.

Financial Analysis
Paraphrase This Document
Need a fresh take? Get an instant paraphrase of this document with our AI Paraphraser

FINANCIAL ANALYSIS 1
Overview of the company
In this report, The a2 milk company has been taken into consideration in order to
analyse the financial situation of the company. The evaluation of financial situation of Coca-
Cola Amatil will also be evaluated to analyse the position of the a2 milk company. Both the
companies are operating under the same industry of Food and beverage industry. The a2 milk
company is a public listed company that offers the A1 protein-free milk with the name of a2
milk brands (The a2 Milk Company, 2018). The Chairman of the company shared the
information with the statements and information about the company financial situation. As
per the Chairman, the company achieved annual growth of three years period 81% in revenue
and 349% in EBITDA. The statement of the Chairman “three dynamics not only create a
strong base for the company but also a bigger opportunity for growth in the future” states
that the Chairman tone is optimistic towards the future.
Income statement
As per the horizontal analysis, the a2 milk company sales is increases as the demand
of consumers is increases. It increases with the amount of 373107 (549247 to 922354) (The
a2 Milk Company, 2018). The increasing sales affect the net profit which is a major part
while evaluating the financial position of the company that is why; the sales account is
selected for the horizontal analysis. According to vertical analysis, distribution expenses of
the company is less as compare to sales due to which net profit is increases.

FINANCIAL ANALYSIS 2
Balance Sheet
The plant and equipment account in the balance sheet of the company is increases
with the 8358 to 9701. The company invest in the fixed asset due to which the total asset is
also increases and that enhance the capability of pay off the debts. Debts ratio is the major
part while evaluating the financial situation of the company. As per the vertical analysis, it
has been evaluated that the trade payable account is also increases due to which the debt ratio
of the company will be affected in the near future. The increasing amount of total asset helps
to recover the debts but as per increases trade payable decreases the capability to pay debts.
⊘ This is a preview!⊘
Do you want full access?
Subscribe today to unlock all pages.

Trusted by 1+ million students worldwide

FINANCIAL ANALYSIS 3
Ratio Analysis
Financial Ratio Analysis
A2milk
company Coca Cola
2018 2018
Profitability Ratio
Gross Profit Margin Gross Profit 464349 2013
Net Sales 922354 0.50 4764 0.42
Profit Margin Net Profit 195684 279
Net Sales 922354 0.21 4764 0.06
Ratio Analysis
Financial Ratio Analysis
A2milk
company Coca Cola
2018 2018
Profitability Ratio
Gross Profit Margin Gross Profit 464349 2013
Net Sales 922354 0.50 4764 0.42
Profit Margin Net Profit 195684 279
Net Sales 922354 0.21 4764 0.06
Paraphrase This Document
Need a fresh take? Get an instant paraphrase of this document with our AI Paraphraser

FINANCIAL ANALYSIS 4
Return on Assets Net income 195684 279
Total assets 722578 0.27 4627 0.06
Return on Equity
Net income after preference
dividends 195684 123
Average common stock holder's
equity 398597 0.49 19075 0.01
Liquidity Ratio
Current Ratio Current assets 506062 2815
Current liabilities 166749 3.03 1644 1.71
Quick Ratio Quick assets 441961 1909
Current liabilities 166749 2.65 1644 1.16
Average Receivable
days Receivables 65491 855
sales /365 922354
25.9
2 4764 65.51
Financial Ratio
Debt Ratio Total Liabilities 166869 6172
Total Assets 722578 0.23 4627 1.33
Market Performance Ratio
Earnings Per share
Net income after preference
dividends 195684 123

FINANCIAL ANALYSIS 5
Total common stock 398597 0.49 1545 0.08
(Source: The a2 Milk Company, 2018).
As per the evaluation, it has been seen that the debt ratio of the company is 0.23
which is less than the ratio of Coca-Cola Amatil (Coca-Cola Amatil, 2018). The liquidity
ratio of the company states that the company is more effective than the other company as the
current liabilities is less than the current asset. The company is highly diversified as it
distribute the capital effectively which is indicated by its increasing asset. The quick ratio of
the company is 2.54 and the Coca-Cola is 1.16 which indicates the more stability as compare
to the other companies in the market (The a2 Milk Company, 2018). It is observed that the
profitability ratio of the company is also high as the increasing demand of consumer towards
it. Increasing demand of consumer increases the sales due to which the profit ratio is high.
⊘ This is a preview!⊘
Do you want full access?
Subscribe today to unlock all pages.

Trusted by 1+ million students worldwide

FINANCIAL ANALYSIS 6
References
Coca-Cola Amatil. (2018). Annual Report 2018. Retrieved from:
https://www.ccamatil.com/-/media/Cca/Corporate/Files/ASX-Announcements/
2019/2018-Annual-Report.ashx
The a2 Milk Company. (2018). About Us. Retrieved from:
https://thea2milkcompany.com/about-us/
The a2 Milk Company. (2018). Annual Report. Retrieved from:
https://thea2milkcompany.com/wp-content/uploads/A2M-Annual-Report-FY18.pdf
1 out of 7
Related Documents

Your All-in-One AI-Powered Toolkit for Academic Success.
+13062052269
info@desklib.com
Available 24*7 on WhatsApp / Email
Unlock your academic potential
Copyright © 2020–2025 A2Z Services. All Rights Reserved. Developed and managed by ZUCOL.