Finance Report: a2 Milk Company Financial Analysis and Recommendations
VerifiedAdded on 2021/06/15
|15
|3525
|53
Report
AI Summary
This report provides a comprehensive financial analysis of the a2 Milk Company, a public company listed on the ASX 200, focusing on its commercialization of a2 milk and related products. The report begins with a description of the company, its segments, and its historical performance. It then details the structure of ownership and governance, including substantial shareholders and key personnel. Fundamental financial ratios are calculated and analyzed, followed by an examination of stock movement data from the ASX website and recent company announcements, including agreements, director's interests, and business expansions. The report calculates the company's beta and required rate of return, classifying the company as a conservative investment. It then computes the Weighted Average Cost of Capital (WACC) and discusses its implications for management evaluation. The report concludes with a recommendation based on the financial analysis.

Running head: FINANCE
Finance
Name of the student
Name of the university
Author note
Finance
Name of the student
Name of the university
Author note
Paraphrase This Document
Need a fresh take? Get an instant paraphrase of this document with our AI Paraphraser
FINANCE 1
Table of Contents
1. Description of the company.......................................................................................2
2. Specification of the structure of ownership governance............................................2
3. Fundamental ratios.....................................................................................................3
4. Information from ASX website..................................................................................4
5. Recent announcement................................................................................................6
6. Stock field..................................................................................................................7
7. WACC (weighted average cost of capital).................................................................9
8. Optimal debt structure..............................................................................................10
9. Dividend policy........................................................................................................11
10. Recommendation..................................................................................................11
Reference.........................................................................................................................13
FINANCE 2
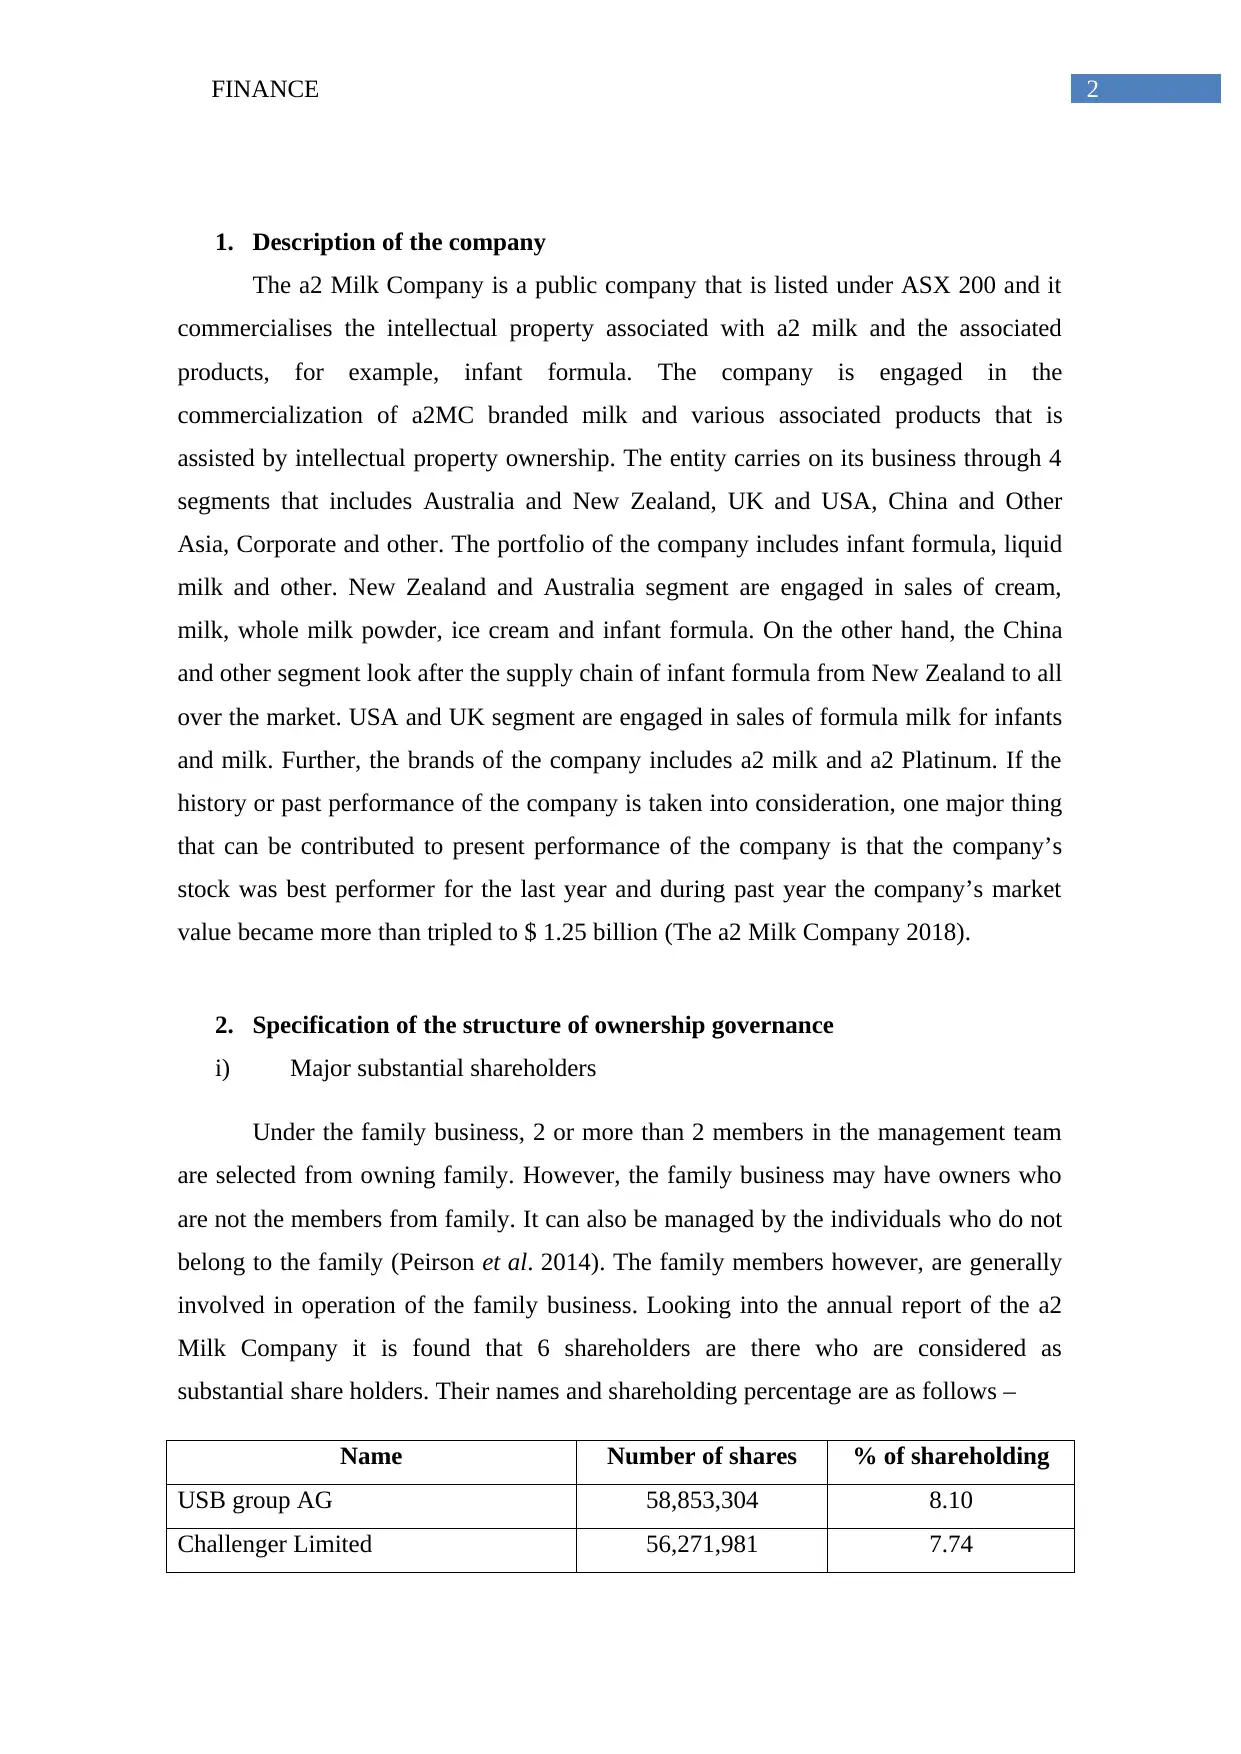
1. Description of the company
The a2 Milk Company is a public company that is listed under ASX 200 and it
commercialises the intellectual property associated with a2 milk and the associated
products, for example, infant formula. The company is engaged in the
commercialization of a2MC branded milk and various associated products that is
assisted by intellectual property ownership. The entity carries on its business through 4
segments that includes Australia and New Zealand, UK and USA, China and Other
Asia, Corporate and other. The portfolio of the company includes infant formula, liquid
milk and other. New Zealand and Australia segment are engaged in sales of cream,
milk, whole milk powder, ice cream and infant formula. On the other hand, the China
and other segment look after the supply chain of infant formula from New Zealand to all
over the market. USA and UK segment are engaged in sales of formula milk for infants
and milk. Further, the brands of the company includes a2 milk and a2 Platinum. If the
history or past performance of the company is taken into consideration, one major thing
that can be contributed to present performance of the company is that the company’s
stock was best performer for the last year and during past year the company’s market
value became more than tripled to $ 1.25 billion (The a2 Milk Company 2018).
2. Specification of the structure of ownership governance
i) Major substantial shareholders
Under the family business, 2 or more than 2 members in the management team
are selected from owning family. However, the family business may have owners who
are not the members from family. It can also be managed by the individuals who do not
belong to the family (Peirson et al. 2014). The family members however, are generally
involved in operation of the family business. Looking into the annual report of the a2
Milk Company it is found that 6 shareholders are there who are considered as
substantial share holders. Their names and shareholding percentage are as follows –
Name Number of shares % of shareholding
USB group AG 58,853,304 8.10
Challenger Limited 56,271,981 7.74
⊘ This is a preview!⊘
Do you want full access?
Subscribe today to unlock all pages.
Trusted by 1+ million students worldwide
FINANCE 3
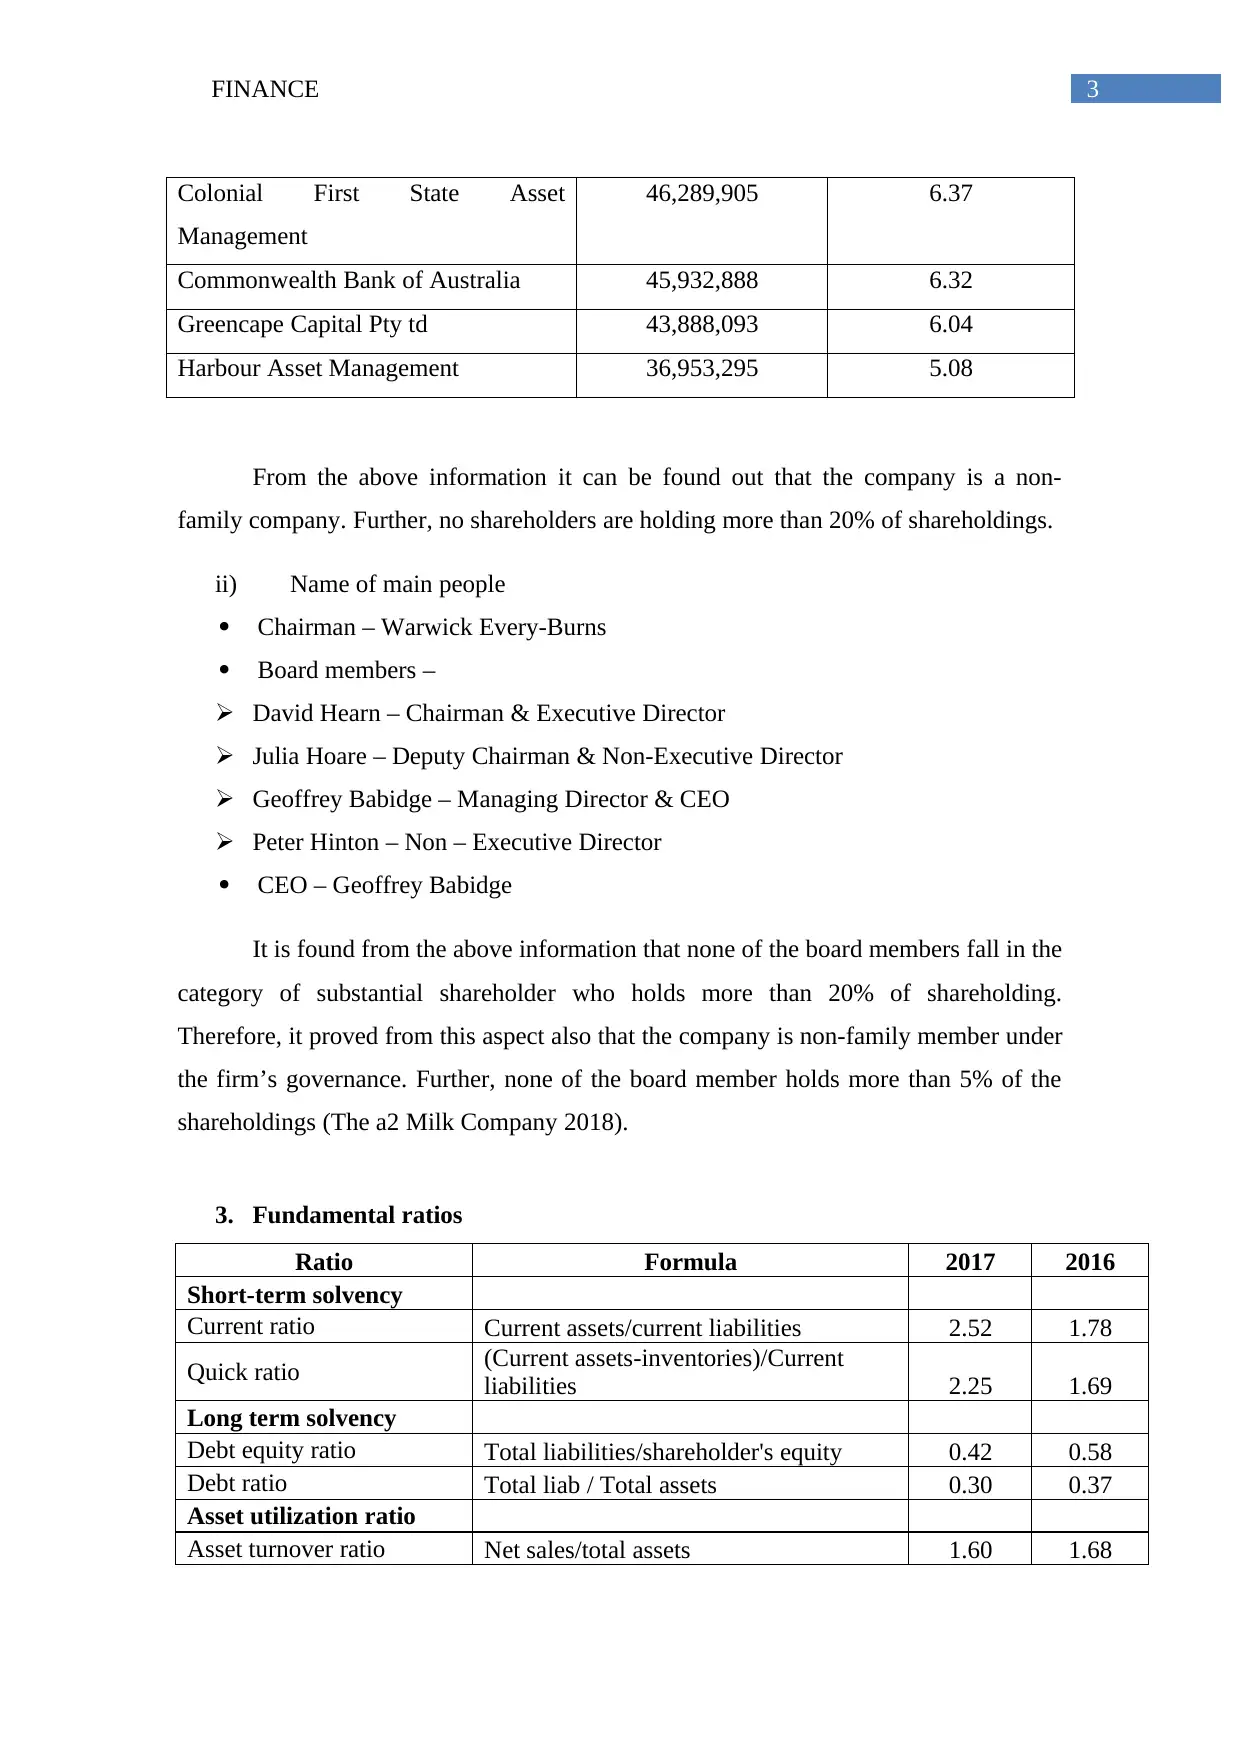
Colonial First State Asset
Management
46,289,905 6.37
Commonwealth Bank of Australia 45,932,888 6.32
Greencape Capital Pty td 43,888,093 6.04
Harbour Asset Management 36,953,295 5.08
From the above information it can be found out that the company is a non-
family company. Further, no shareholders are holding more than 20% of shareholdings.
ii) Name of main people
Chairman – Warwick Every-Burns
Board members –
David Hearn – Chairman & Executive Director
Julia Hoare – Deputy Chairman & Non-Executive Director
Geoffrey Babidge – Managing Director & CEO
Peter Hinton – Non – Executive Director
CEO – Geoffrey Babidge
It is found from the above information that none of the board members fall in the
category of substantial shareholder who holds more than 20% of shareholding.
Therefore, it proved from this aspect also that the company is non-family member under
the firm’s governance. Further, none of the board member holds more than 5% of the
shareholdings (The a2 Milk Company 2018).
3. Fundamental ratios
Ratio Formula 2017 2016
Short-term solvency
Current ratio Current assets/current liabilities 2.52 1.78
Quick ratio (Current assets-inventories)/Current
liabilities 2.25 1.69
Long term solvency
Debt equity ratio Total liabilities/shareholder's equity 0.42 0.58
Debt ratio Total liab / Total assets 0.30 0.37
Asset utilization ratio
Asset turnover ratio Net sales/total assets 1.60 1.68
Paraphrase This Document
Need a fresh take? Get an instant paraphrase of this document with our AI Paraphraser
FINANCE 4
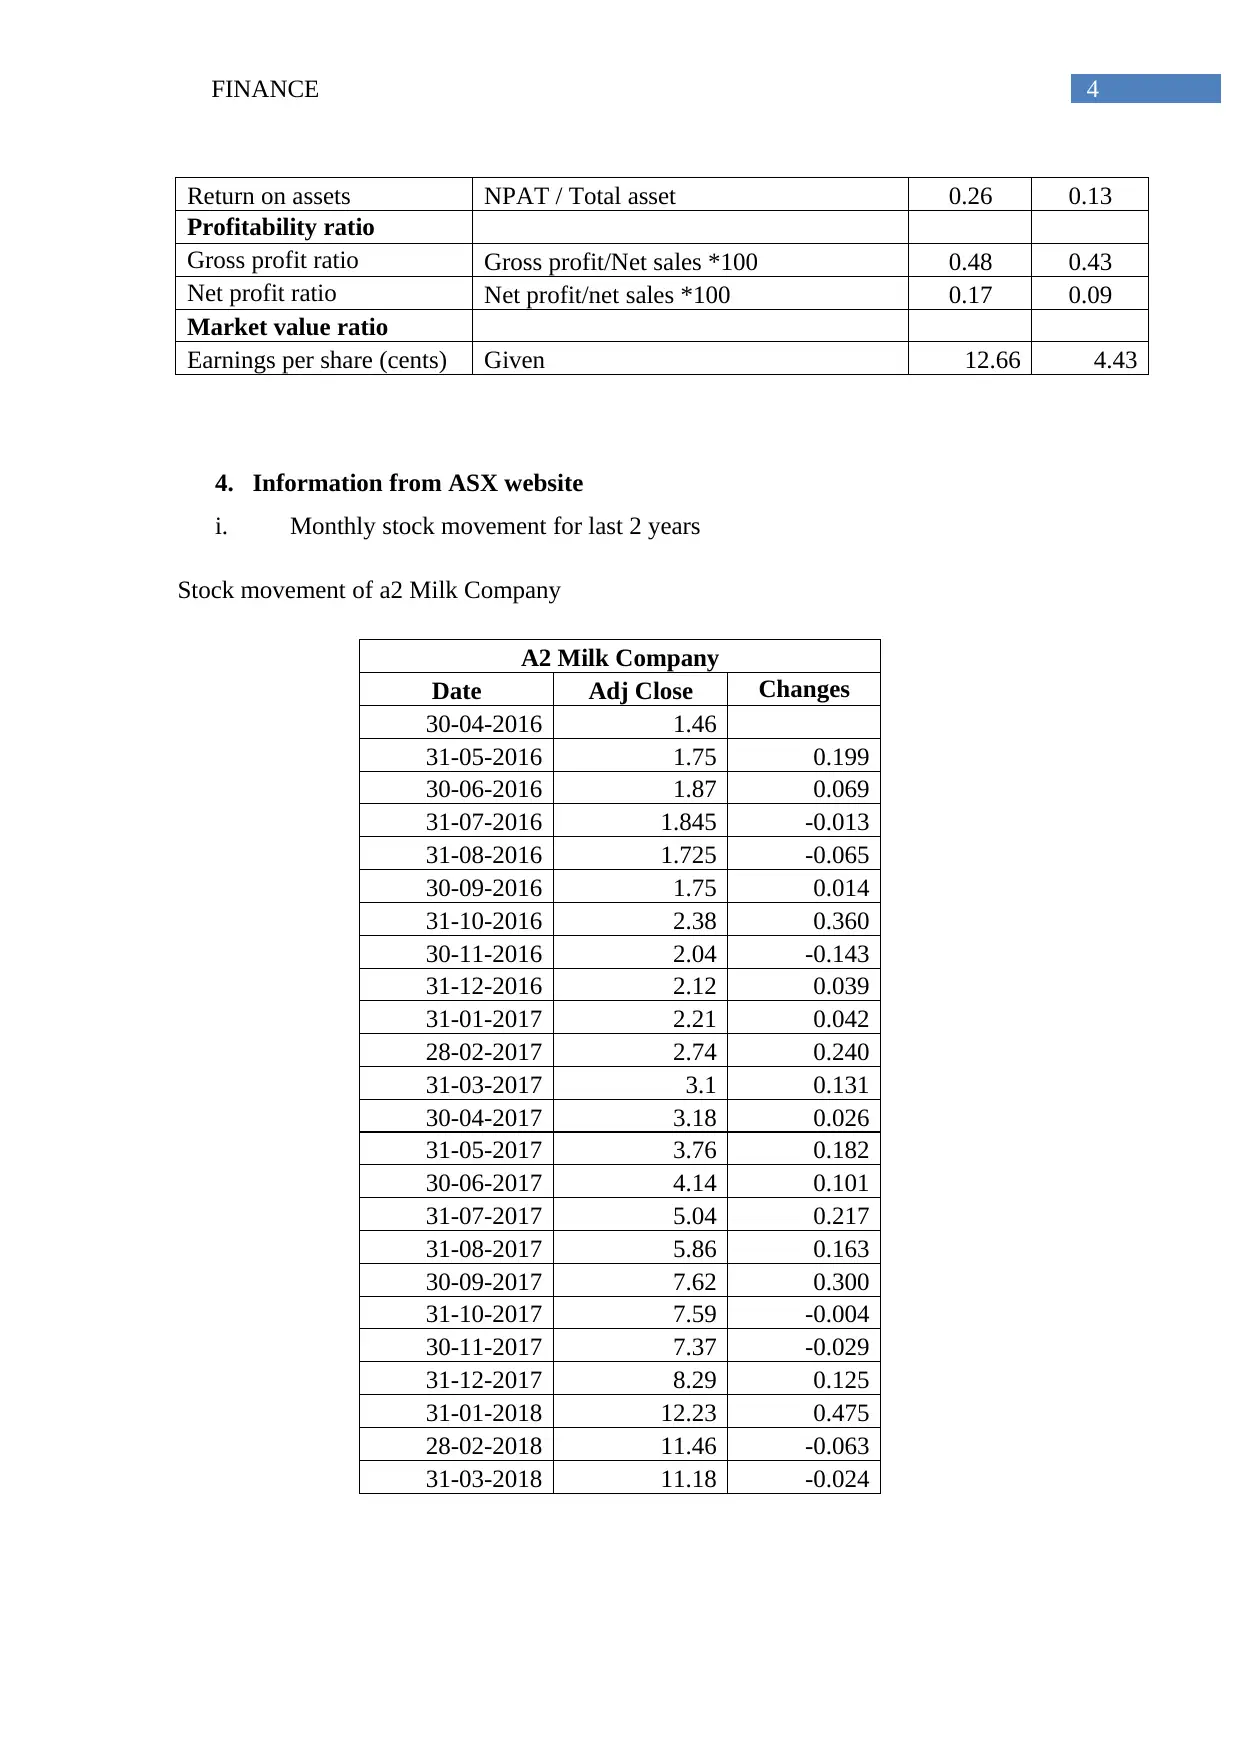
Return on assets NPAT / Total asset 0.26 0.13
Profitability ratio
Gross profit ratio Gross profit/Net sales *100 0.48 0.43
Net profit ratio Net profit/net sales *100 0.17 0.09
Market value ratio
Earnings per share (cents) Given 12.66 4.43
4. Information from ASX website
i. Monthly stock movement for last 2 years
Stock movement of a2 Milk Company
A2 Milk Company
Date Adj Close Changes
30-04-2016 1.46
31-05-2016 1.75 0.199
30-06-2016 1.87 0.069
31-07-2016 1.845 -0.013
31-08-2016 1.725 -0.065
30-09-2016 1.75 0.014
31-10-2016 2.38 0.360
30-11-2016 2.04 -0.143
31-12-2016 2.12 0.039
31-01-2017 2.21 0.042
28-02-2017 2.74 0.240
31-03-2017 3.1 0.131
30-04-2017 3.18 0.026
31-05-2017 3.76 0.182
30-06-2017 4.14 0.101
31-07-2017 5.04 0.217
31-08-2017 5.86 0.163
30-09-2017 7.62 0.300
31-10-2017 7.59 -0.004
30-11-2017 7.37 -0.029
31-12-2017 8.29 0.125
31-01-2018 12.23 0.475
28-02-2018 11.46 -0.063
31-03-2018 11.18 -0.024
FINANCE 5
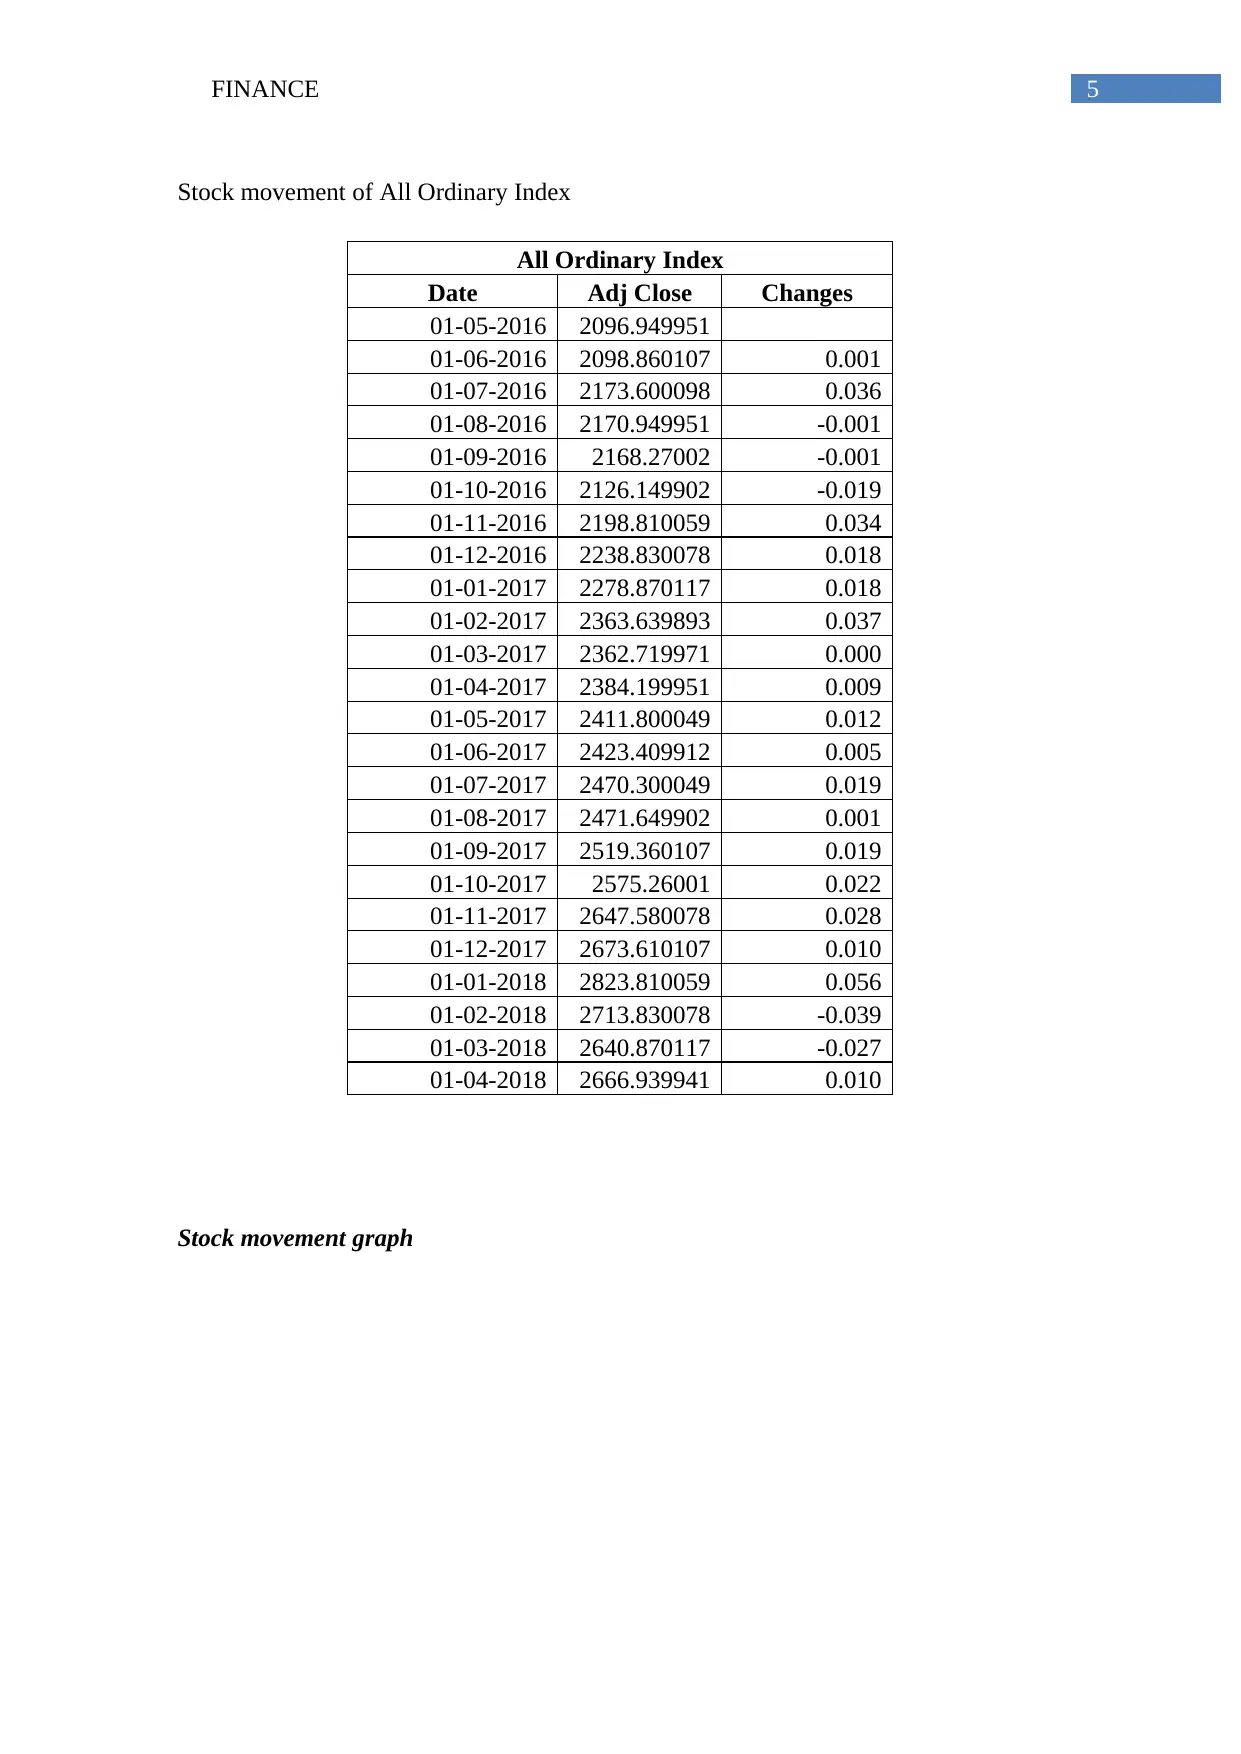
Stock movement of All Ordinary Index
All Ordinary Index
Date Adj Close Changes
01-05-2016 2096.949951
01-06-2016 2098.860107 0.001
01-07-2016 2173.600098 0.036
01-08-2016 2170.949951 -0.001
01-09-2016 2168.27002 -0.001
01-10-2016 2126.149902 -0.019
01-11-2016 2198.810059 0.034
01-12-2016 2238.830078 0.018
01-01-2017 2278.870117 0.018
01-02-2017 2363.639893 0.037
01-03-2017 2362.719971 0.000
01-04-2017 2384.199951 0.009
01-05-2017 2411.800049 0.012
01-06-2017 2423.409912 0.005
01-07-2017 2470.300049 0.019
01-08-2017 2471.649902 0.001
01-09-2017 2519.360107 0.019
01-10-2017 2575.26001 0.022
01-11-2017 2647.580078 0.028
01-12-2017 2673.610107 0.010
01-01-2018 2823.810059 0.056
01-02-2018 2713.830078 -0.039
01-03-2018 2640.870117 -0.027
01-04-2018 2666.939941 0.010
Stock movement graph
⊘ This is a preview!⊘
Do you want full access?
Subscribe today to unlock all pages.
Trusted by 1+ million students worldwide
FINANCE 6
5/1/2016
8/1/2016
11/1/2016
2/1/2017
5/1/2017
8/1/2017
11/1/2017
2/1/2018
-0.200
-0.100
0.000
0.100
0.200
0.300
0.400
0.500
0.600
Stock Movement
A2 Milk Compnay
All Ordinary Index
Date
Stock price
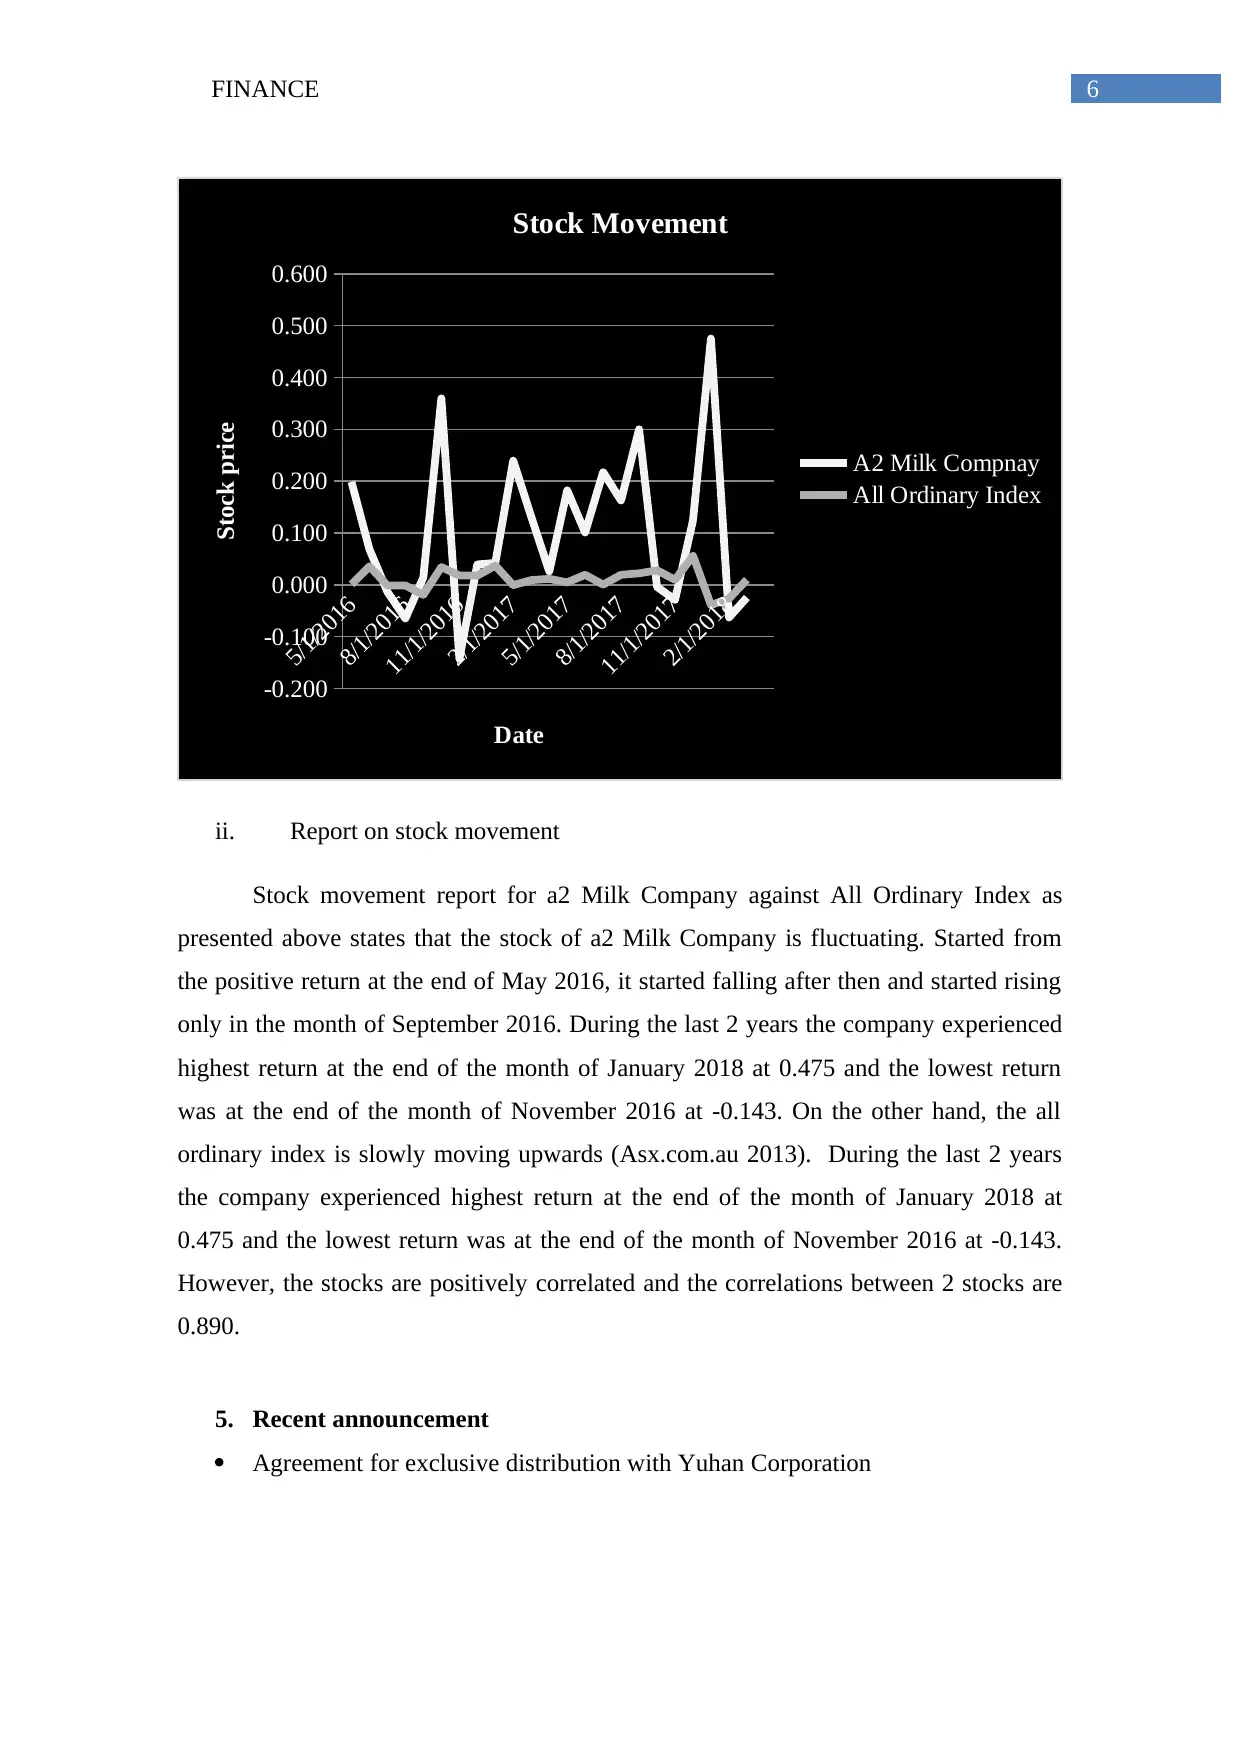
ii. Report on stock movement
Stock movement report for a2 Milk Company against All Ordinary Index as
presented above states that the stock of a2 Milk Company is fluctuating. Started from
the positive return at the end of May 2016, it started falling after then and started rising
only in the month of September 2016. During the last 2 years the company experienced
highest return at the end of the month of January 2018 at 0.475 and the lowest return
was at the end of the month of November 2016 at -0.143. On the other hand, the all
ordinary index is slowly moving upwards (Asx.com.au 2013). During the last 2 years
the company experienced highest return at the end of the month of January 2018 at
0.475 and the lowest return was at the end of the month of November 2016 at -0.143.
However, the stocks are positively correlated and the correlations between 2 stocks are
0.890.
5. Recent announcement
Agreement for exclusive distribution with Yuhan Corporation
5/1/2016
8/1/2016
11/1/2016
2/1/2017
5/1/2017
8/1/2017
11/1/2017
2/1/2018
-0.200
-0.100
0.000
0.100
0.200
0.300
0.400
0.500
0.600
Stock Movement
A2 Milk Compnay
All Ordinary Index
Date
Stock price
ii. Report on stock movement
Stock movement report for a2 Milk Company against All Ordinary Index as
presented above states that the stock of a2 Milk Company is fluctuating. Started from
the positive return at the end of May 2016, it started falling after then and started rising
only in the month of September 2016. During the last 2 years the company experienced
highest return at the end of the month of January 2018 at 0.475 and the lowest return
was at the end of the month of November 2016 at -0.143. On the other hand, the all
ordinary index is slowly moving upwards (Asx.com.au 2013). During the last 2 years
the company experienced highest return at the end of the month of January 2018 at
0.475 and the lowest return was at the end of the month of November 2016 at -0.143.
However, the stocks are positively correlated and the correlations between 2 stocks are
0.890.
5. Recent announcement
Agreement for exclusive distribution with Yuhan Corporation
Paraphrase This Document
Need a fresh take? Get an instant paraphrase of this document with our AI Paraphraser
FINANCE 7
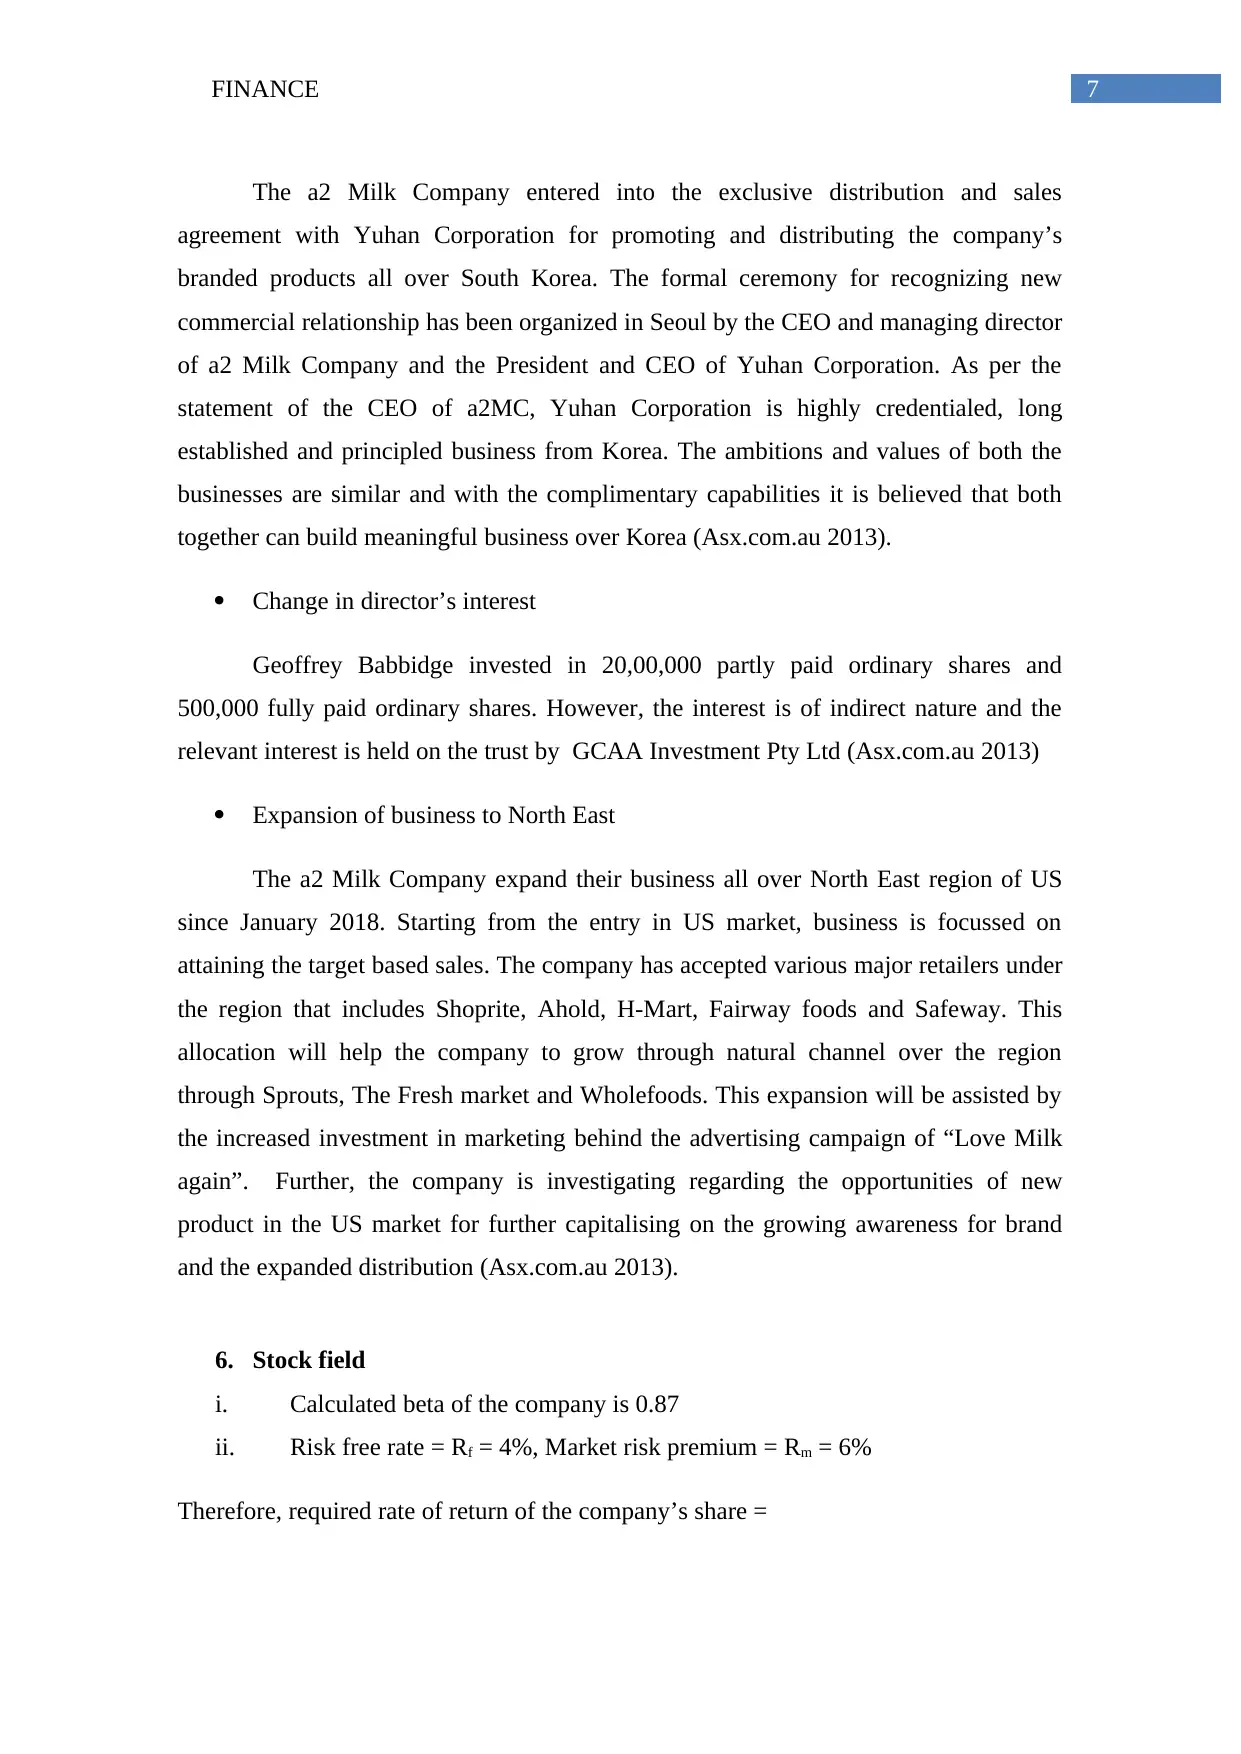
The a2 Milk Company entered into the exclusive distribution and sales
agreement with Yuhan Corporation for promoting and distributing the company’s
branded products all over South Korea. The formal ceremony for recognizing new
commercial relationship has been organized in Seoul by the CEO and managing director
of a2 Milk Company and the President and CEO of Yuhan Corporation. As per the
statement of the CEO of a2MC, Yuhan Corporation is highly credentialed, long
established and principled business from Korea. The ambitions and values of both the
businesses are similar and with the complimentary capabilities it is believed that both
together can build meaningful business over Korea (Asx.com.au 2013).
Change in director’s interest
Geoffrey Babbidge invested in 20,00,000 partly paid ordinary shares and
500,000 fully paid ordinary shares. However, the interest is of indirect nature and the
relevant interest is held on the trust by GCAA Investment Pty Ltd (Asx.com.au 2013)
Expansion of business to North East
The a2 Milk Company expand their business all over North East region of US
since January 2018. Starting from the entry in US market, business is focussed on
attaining the target based sales. The company has accepted various major retailers under
the region that includes Shoprite, Ahold, H-Mart, Fairway foods and Safeway. This
allocation will help the company to grow through natural channel over the region
through Sprouts, The Fresh market and Wholefoods. This expansion will be assisted by
the increased investment in marketing behind the advertising campaign of “Love Milk
again”. Further, the company is investigating regarding the opportunities of new
product in the US market for further capitalising on the growing awareness for brand
and the expanded distribution (Asx.com.au 2013).
6. Stock field
i. Calculated beta of the company is 0.87
ii. Risk free rate = Rf = 4%, Market risk premium = Rm = 6%
Therefore, required rate of return of the company’s share =
FINANCE 8
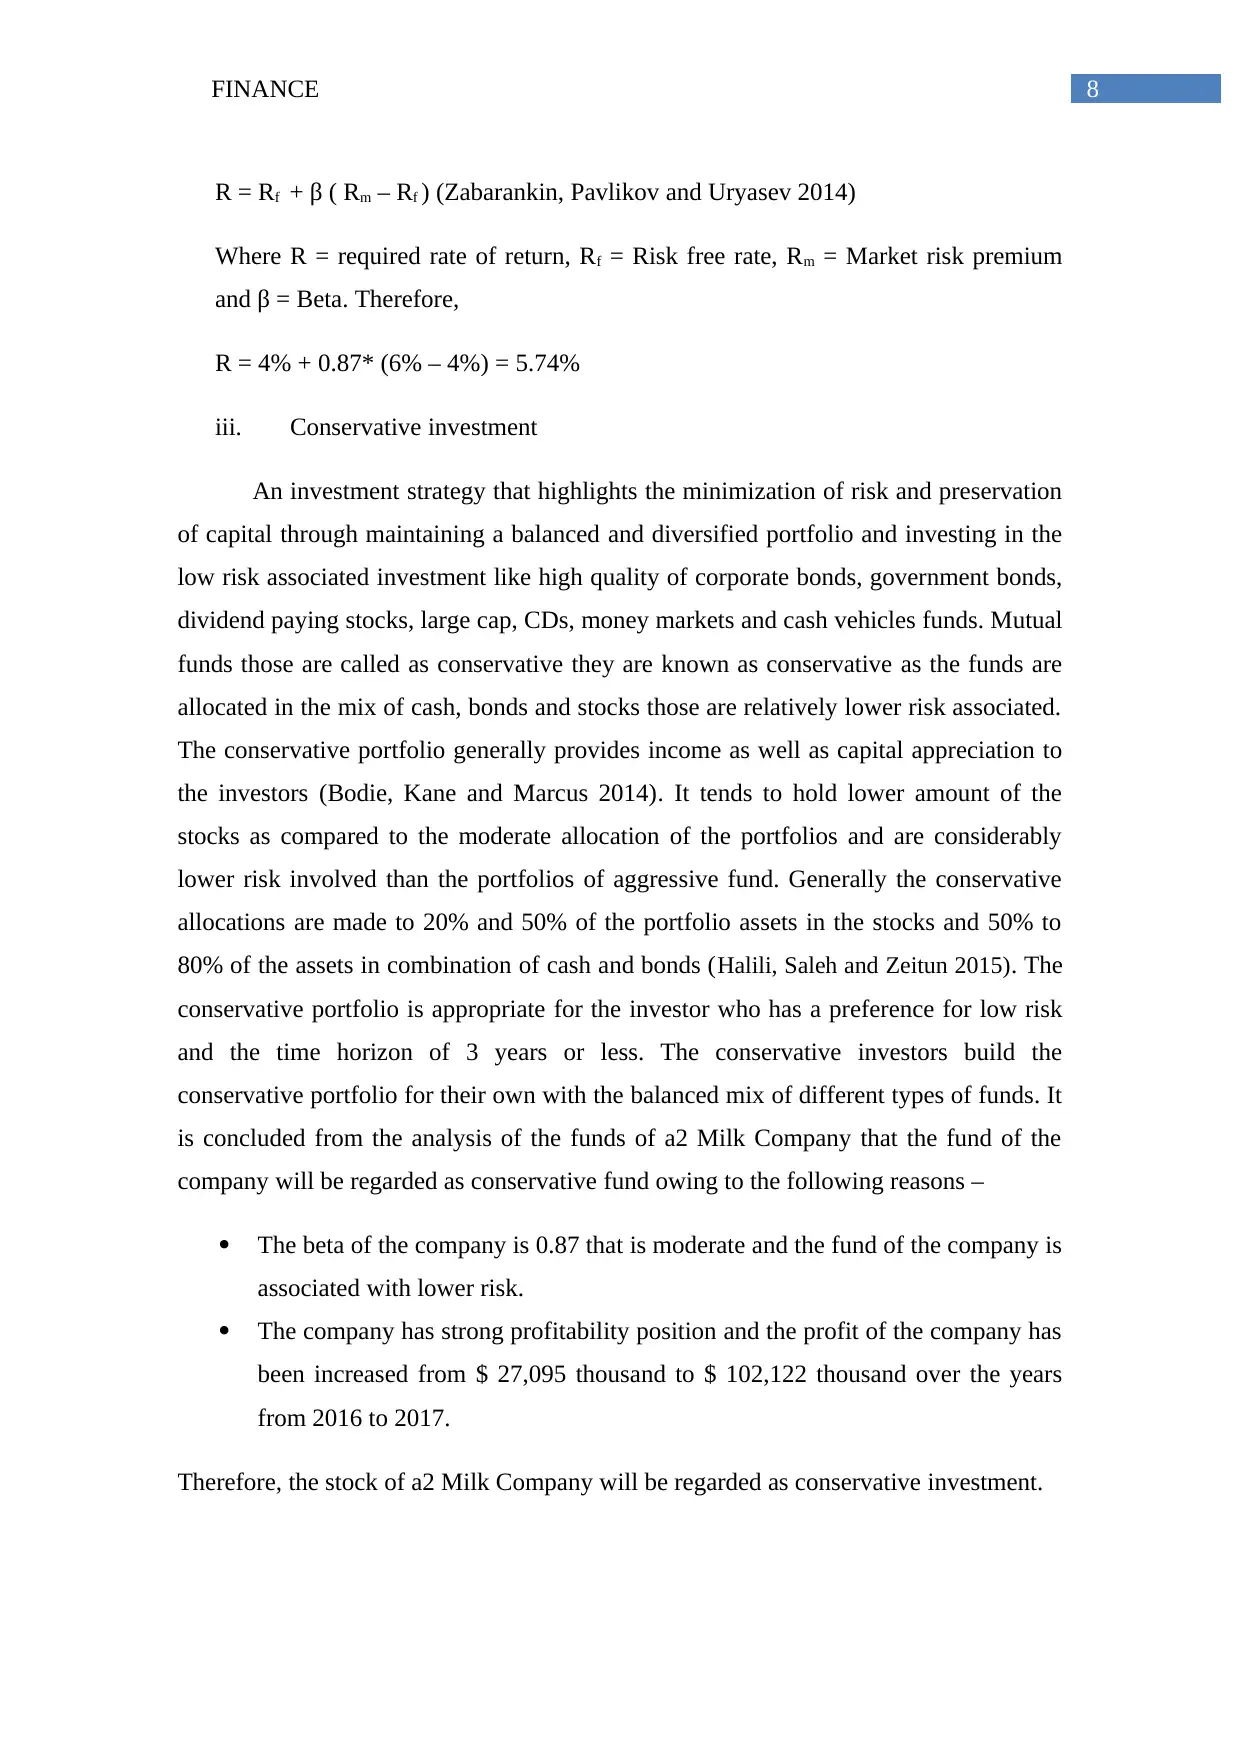
R = Rf + β ( Rm – Rf ) (Zabarankin, Pavlikov and Uryasev 2014)
Where R = required rate of return, Rf = Risk free rate, Rm = Market risk premium
and β = Beta. Therefore,
R = 4% + 0.87* (6% – 4%) = 5.74%
iii. Conservative investment
An investment strategy that highlights the minimization of risk and preservation
of capital through maintaining a balanced and diversified portfolio and investing in the
low risk associated investment like high quality of corporate bonds, government bonds,
dividend paying stocks, large cap, CDs, money markets and cash vehicles funds. Mutual
funds those are called as conservative they are known as conservative as the funds are
allocated in the mix of cash, bonds and stocks those are relatively lower risk associated.
The conservative portfolio generally provides income as well as capital appreciation to
the investors (Bodie, Kane and Marcus 2014). It tends to hold lower amount of the
stocks as compared to the moderate allocation of the portfolios and are considerably
lower risk involved than the portfolios of aggressive fund. Generally the conservative
allocations are made to 20% and 50% of the portfolio assets in the stocks and 50% to
80% of the assets in combination of cash and bonds (Halili, Saleh and Zeitun 2015). The
conservative portfolio is appropriate for the investor who has a preference for low risk
and the time horizon of 3 years or less. The conservative investors build the
conservative portfolio for their own with the balanced mix of different types of funds. It
is concluded from the analysis of the funds of a2 Milk Company that the fund of the
company will be regarded as conservative fund owing to the following reasons –
The beta of the company is 0.87 that is moderate and the fund of the company is
associated with lower risk.
The company has strong profitability position and the profit of the company has
been increased from $ 27,095 thousand to $ 102,122 thousand over the years
from 2016 to 2017.
Therefore, the stock of a2 Milk Company will be regarded as conservative investment.
⊘ This is a preview!⊘
Do you want full access?
Subscribe today to unlock all pages.
Trusted by 1+ million students worldwide
FINANCE 9
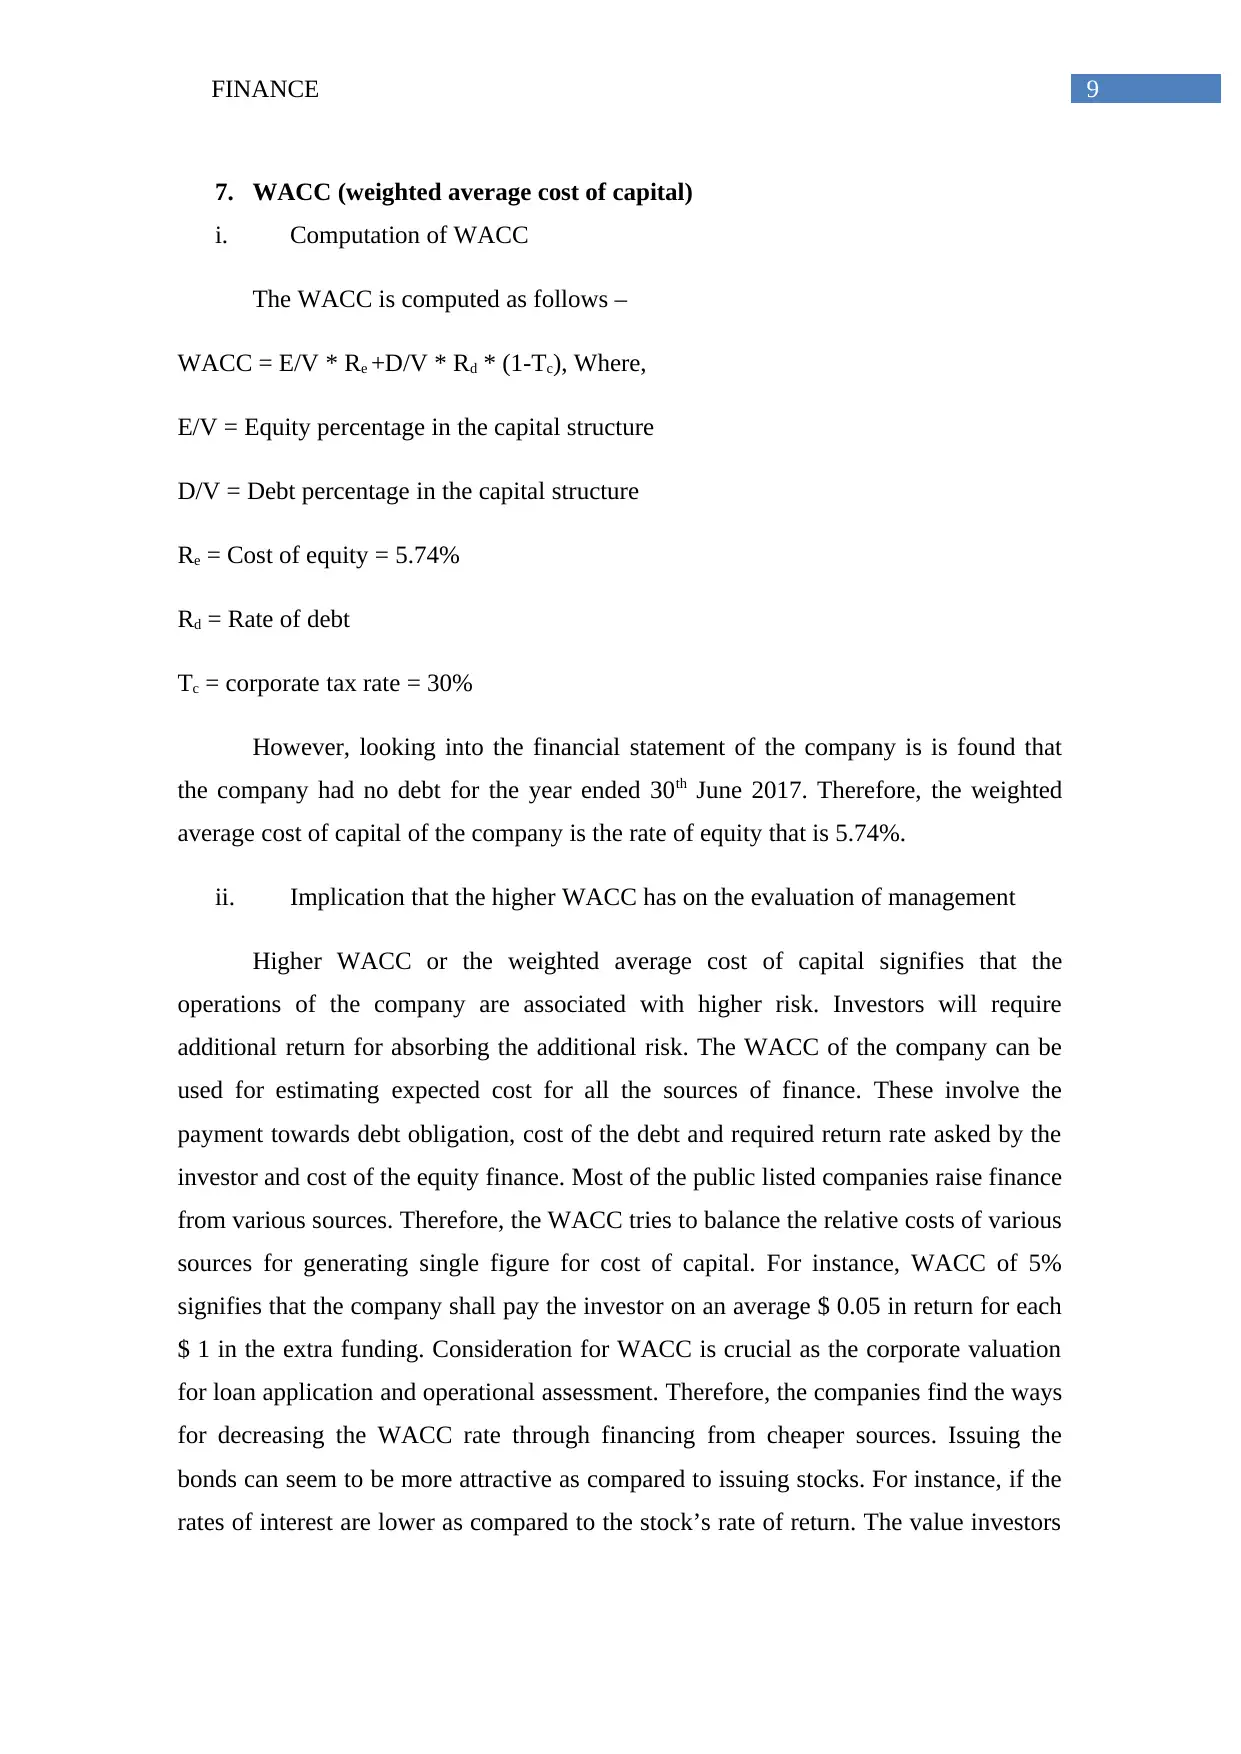
7. WACC (weighted average cost of capital)
i. Computation of WACC
The WACC is computed as follows –
WACC = E/V * Re +D/V * Rd * (1-Tc), Where,
E/V = Equity percentage in the capital structure
D/V = Debt percentage in the capital structure
Re = Cost of equity = 5.74%
Rd = Rate of debt
Tc = corporate tax rate = 30%
However, looking into the financial statement of the company is is found that
the company had no debt for the year ended 30th June 2017. Therefore, the weighted
average cost of capital of the company is the rate of equity that is 5.74%.
ii. Implication that the higher WACC has on the evaluation of management
Higher WACC or the weighted average cost of capital signifies that the
operations of the company are associated with higher risk. Investors will require
additional return for absorbing the additional risk. The WACC of the company can be
used for estimating expected cost for all the sources of finance. These involve the
payment towards debt obligation, cost of the debt and required return rate asked by the
investor and cost of the equity finance. Most of the public listed companies raise finance
from various sources. Therefore, the WACC tries to balance the relative costs of various
sources for generating single figure for cost of capital. For instance, WACC of 5%
signifies that the company shall pay the investor on an average $ 0.05 in return for each
$ 1 in the extra funding. Consideration for WACC is crucial as the corporate valuation
for loan application and operational assessment. Therefore, the companies find the ways
for decreasing the WACC rate through financing from cheaper sources. Issuing the
bonds can seem to be more attractive as compared to issuing stocks. For instance, if the
rates of interest are lower as compared to the stock’s rate of return. The value investors
Paraphrase This Document
Need a fresh take? Get an instant paraphrase of this document with our AI Paraphraser
FINANCE 10
may also become concerned if the WACC of the company is higher than its rate of
return. This indicates that the company actually losing its value and more efficient
return may be available in the market from any other source. Further, the taxes can be
incorporated with the WACC, irrespective of approximating the effect of various tax
level may be tough (Albul, Jaffee and Tchistyi 2015). 1 of the main advantages of
financing through debt is that the payment of interest can be used as deduction from
taxable amount. On the contrary, the returns on the equity investment or the dividends
or the rising prices of stock do not offer any such kind of benefit.
8. Optimal debt structure
i. Optimal structure for capital
Debt ratio Total liabilities / Total assets Year 2017 = 0.30 Year 2016 = 0.37
The company’s capital structure refers to mixture of debt financing and equity
financing that is used by the entity for financing the assets. Some of the companies uses
the entire funds financed through equity and nil debt whereas some of the companies
use a balance of equity and debt. The decision on what mix is to be used depends on the
requirement and preference of the company. The decision of finance has direct impact
on WACC of the company. WACC is the weighted average cost of debt and cost of
equity. The Weightage are decided based on the market values of debt and equity.
Therefore, the WACC of the company varies with the variation in the proportion of debt
and equity. However, the financing decision of the company has direct impact on the
overall objectives of the company to maximise the shareholder’s wealth (He and
Krishnamurthy 2013). As the debt is cheaper and less risky as compared to the equity
the required rate of return for compensating the debt holders is lower as compared to
required rate if return for compensating the equity holders. Generally the debt ratio of
40% or lower is considered as appropriate from pure risk aspect. It is observed from the
above that the debt ratio of a2 Milk Company is reduced to 30% in 2017 as compared to
37% in the year 2016. Therefore, the company is maintaining optimal capital structure
(Heikal, Khaddafi and Ummah 2014).
ii. Gearing ratio
FINANCE 11
It refers to fundamental analysis of the ratio for the company’s long-term debt as
compared to the capital employed or equity capital. Higher gearing ratio indicates that
the company is highly leveraged and not sustainable for long term period. The reason
behind this is that the higher leverage signifies higher amount of debt as compared to
equity. Therefore, the companies with higher gearing ratio have higher amount of debt
to service. However, The a2 Milk Company had no debt for the year ended 2017.
Therefore it can be stated that the company is lower leveraged. However, the company
during the year did not issued or bought back any shares. Further, the director’s report
of the company did not mention anything regarding this policy.
9. Dividend policy
The board of directors of the company reviews the dividend policy of the
company at least 2 times in the in the year before the announcement of the result.
Holders of the fully paid ordinary shares are entitled for receiving dividends that can be
confirmed by the company from time to time (Ajanthan 2013). However, the company
follows the Zero dividend policy and no dividends are paid on the rights and options.
Further, for the year ended 2017 the company did not pay any dividends to its
shareholders. The reason behind this dividend policy may be that the dividends are
double taxed – once when it is paid to the shareholders and again at the corporate level.
Therefore, the company may find other ways of returning capital rather than paying it
through dividends.
10. Recommendation letter
Dear Mr. XYZ,
After analysing various aspects regarding a2 Milk Company, I would like to
recommend you that the stock of the company shall be included in your investment
portfolio. The main reason is that the company’s stock can be considered as the
conservative investment. Further, looking into the ratio analysis it is observed that the
company will be considered as solvent for short time as well as long time period. The
liquidity ratios of the company are stating that is efficient to pay-off the short term
obligations efficiently. Further, the asset utilization ratio is signifying that the company
⊘ This is a preview!⊘
Do you want full access?
Subscribe today to unlock all pages.
Trusted by 1+ million students worldwide
1 out of 15
Related Documents


Your All-in-One AI-Powered Toolkit for Academic Success.
+13062052269
info@desklib.com
Available 24*7 on WhatsApp / Email
![[object Object]](/_next/static/media/star-bottom.7253800d.svg)
Unlock your academic potential
Copyright © 2020–2026 A2Z Services. All Rights Reserved. Developed and managed by ZUCOL.