A2 Milk Company: Investment Analysis & Financial Performance
VerifiedAdded on 2023/06/15
|12
|2615
|489
Report
AI Summary
This assignment provides a comprehensive financial analysis of A2 Milk Company for the year 2017. It begins with a background of the company, outlining its core activities and history. The report details the ownership and governance structure, identifying major shareholders and key roles in corporate governance. Key financial ratios such as Return on Assets (ROA), Return on Equity (ROE), and Debt Ratio are calculated and analyzed, providing insights into the company's financial performance and capital structure. A graphical presentation of stock prices illustrates the company's stock movement relative to the Australian Dairy All Ord Index. Factors influencing share prices are discussed, including competition and product differentiation. The required rate of return and weighted average cost of capital (WACC) are computed, followed by an analysis of the company's debt ratio and dividend policy. The report concludes with a letter of recommendation, advising clients on whether to invest in A2 Milk Company based on its financial performance and growth potential. The company's strong performance and potential for further development make it a favorable investment.

Running head: CORPORATE FINANCE
Corporate Finance
Name of the Student:
Name of the University:
Author’s Note:
Corporate Finance
Name of the Student:
Name of the University:
Author’s Note:
Paraphrase This Document
Need a fresh take? Get an instant paraphrase of this document with our AI Paraphraser
1
CORPORATE FINANCE
Executive Summary
The main purpose of this assignment is to analyze the financial statements of A2 Milk company
for the year 2017. The assignment will be providing a detailed overview of the company
outlining the major shareholders of the company. The assignment will also be calculating
important ratios of the company and analyze the same. The assignment will be also presenting
beta and graph which depicts the share price of the company.
2
CORPORATE FINANCE
Table of Contents
1 Background of A2 Milk Company...........................................................................................3
2 Ownership Governance Structure of the a2 Milk Company....................................................3
I Substantial Shareholders of A2 Milk Company........................................................................3
II Major roles involved in Corporate Governance.......................................................................3
3 Key Ratios of the Company.....................................................................................................4
4 Graphical Presentation of Stock Prices....................................................................................6
5 Factors which influences the Share Prices...............................................................................6
6 Computation of Required Rate of Return.................................................................................7
7 Computation of Weighted Average Cost of Capital................................................................7
8 Debt Ratio and Capital Gearing Ratio of the Company...........................................................8
9 Dividend Policy........................................................................................................................8
10 Letter of Recommendation...................................................................................................9
Reference.......................................................................................................................................10
⊘ This is a preview!⊘
Do you want full access?
Subscribe today to unlock all pages.
Trusted by 1+ million students worldwide
3
CORPORATE FINANCE
1 Background of A2 Milk Company
This company was known previously known as A2 corporation. A2 Milk Company is
engaged in the production of milk and milk related products. A2 milk Company also makes milk
products which are related to infant formula. The company was founded by Dr Corran
McLachlan and it was founded in 2000 in New Zealand. Dr Corran McLachlan was engaged in
the research of health effects of Milk Protein of A1 Beta-casein. The company carried out
genetic test to identify which cows which can produce milk with A1 protein. The company
started its operations on farm breeding programs in order to breed cows which can produce A2
milk. The company has its headquarter in Sydney, Australia and the total revenue of the
company as per 2016 figures is $ 337.3 million (The a2 Milk Company", 2018). The core
activities of A2 Milk Company consist producing A2 Milk, other related dairy products and
infant formula.
2 Ownership Governance Structure of the a2 Milk Company
I Substantial Shareholders of A2 Milk Company
The main shareholders of the company who have a majority shareholding in the total
shares of the A2 Milk Company which is greater than 5% are USB Group AG and its related
parties which has a shareholding of 8.10%. The other shareholders which have a shareholding of
more than 5% are challenger Limited, Colonial First State Asset Management (Australia)
Limited, Commonwealth Bank of Australia, Greencap Capital Pvt Limited, Harbour Asset
Management Limited. There are no shareholders who holds more than 20% shares in the
company. USB Group AB is not in any way related to the A2 Milk Company and thus it is not a
family company.
Paraphrase This Document
Need a fresh take? Get an instant paraphrase of this document with our AI Paraphraser
4
CORPORATE FINANCE
II Major roles involved in Corporate Governance
The corporate governance of the company lies with the board of directors and CEO of the
company (Ahmed & Henry, 2012). David Hearn is the Chairman and Executive Director of the
company and he is responsible for the corporate governance policy of the company along with
the board of directors of the company. The board of director of the company includes Julia
Hoare, Peter Hinton, Warwick Every-Burns and Jesse Wu. The CEO and the Managing Director
of the Company is Geoffrey Babidage.
There are no such shareholders which have a shareholding of more than 20% as per the
shareholder’s Information of the company. The shareholders which hold more than 5% of the
total shareholding of the company are not in any way related to the company and therefore does
not have any role in the corporate governance of the company.
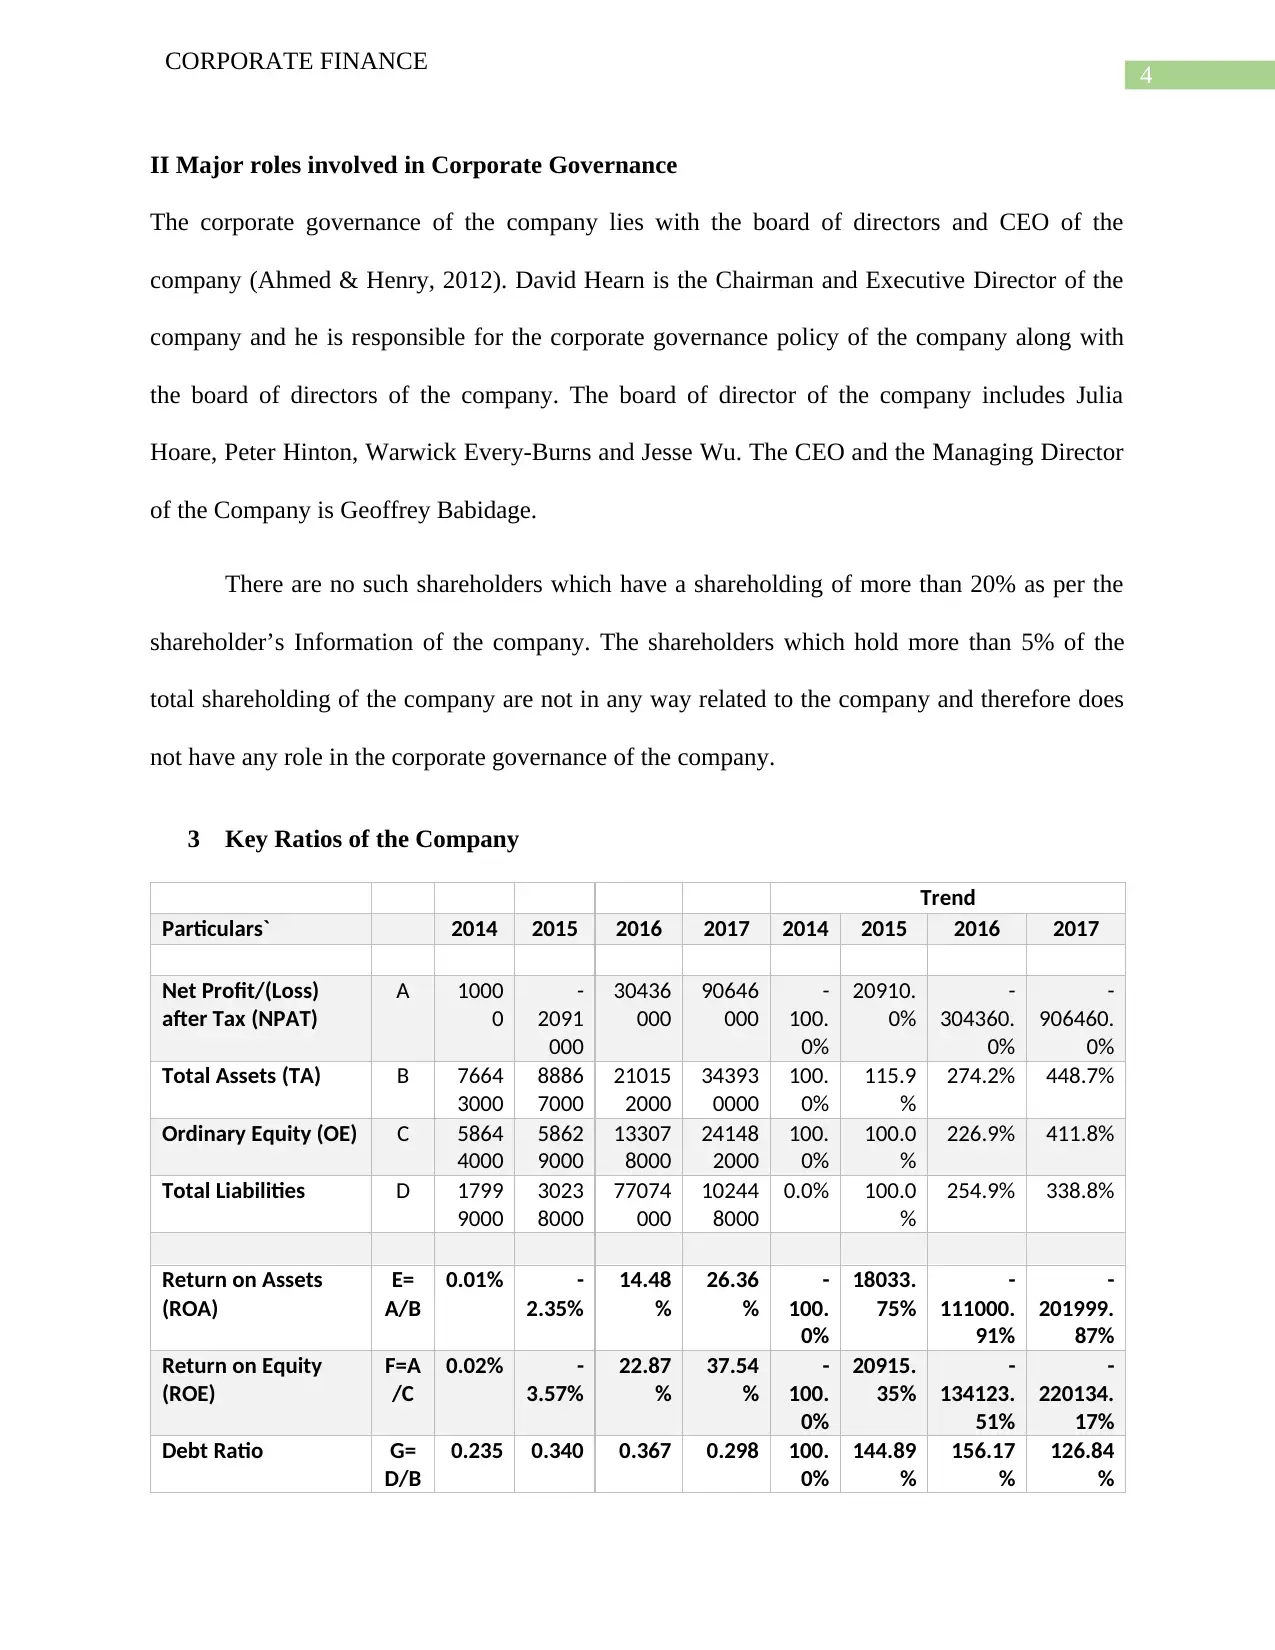
3 Key Ratios of the Company
Trend
Particulars` 2014 2015 2016 2017 2014 2015 2016 2017
Net Profit/(Loss)
after Tax (NPAT)
A 1000
0
-
2091
000
30436
000
90646
000
-
100.
0%
20910.
0%
-
304360.
0%
-
906460.
0%
Total Assets (TA) B 7664
3000
8886
7000
21015
2000
34393
0000
100.
0%
115.9
%
274.2% 448.7%
Ordinary Equity (OE) C 5864
4000
5862
9000
13307
8000
24148
2000
100.
0%
100.0
%
226.9% 411.8%
Total Liabilities D 1799
9000
3023
8000
77074
000
10244
8000
0.0% 100.0
%
254.9% 338.8%
Return on Assets
(ROA)
E=
A/B
0.01% -
2.35%
14.48
%
26.36
%
-
100.
0%
18033.
75%
-
111000.
91%
-
201999.
87%
Return on Equity
(ROE)
F=A
/C
0.02% -
3.57%
22.87
%
37.54
%
-
100.
0%
20915.
35%
-
134123.
51%
-
220134.
17%
Debt Ratio G=
D/B
0.235 0.340 0.367 0.298 100.
0%
144.89
%
156.17
%
126.84
%
CORPORATE FINANCE
II Major roles involved in Corporate Governance
The corporate governance of the company lies with the board of directors and CEO of the
company (Ahmed & Henry, 2012). David Hearn is the Chairman and Executive Director of the
company and he is responsible for the corporate governance policy of the company along with
the board of directors of the company. The board of director of the company includes Julia
Hoare, Peter Hinton, Warwick Every-Burns and Jesse Wu. The CEO and the Managing Director
of the Company is Geoffrey Babidage.
There are no such shareholders which have a shareholding of more than 20% as per the
shareholder’s Information of the company. The shareholders which hold more than 5% of the
total shareholding of the company are not in any way related to the company and therefore does
not have any role in the corporate governance of the company.
3 Key Ratios of the Company
Trend
Particulars` 2014 2015 2016 2017 2014 2015 2016 2017
Net Profit/(Loss)
after Tax (NPAT)
A 1000
0
-
2091
000
30436
000
90646
000
-
100.
0%
20910.
0%
-
304360.
0%
-
906460.
0%
Total Assets (TA) B 7664
3000
8886
7000
21015
2000
34393
0000
100.
0%
115.9
%
274.2% 448.7%
Ordinary Equity (OE) C 5864
4000
5862
9000
13307
8000
24148
2000
100.
0%
100.0
%
226.9% 411.8%
Total Liabilities D 1799
9000
3023
8000
77074
000
10244
8000
0.0% 100.0
%
254.9% 338.8%
Return on Assets
(ROA)
E=
A/B
0.01% -
2.35%
14.48
%
26.36
%
-
100.
0%
18033.
75%
-
111000.
91%
-
201999.
87%
Return on Equity
(ROE)
F=A
/C
0.02% -
3.57%
22.87
%
37.54
%
-
100.
0%
20915.
35%
-
134123.
51%
-
220134.
17%
Debt Ratio G=
D/B
0.235 0.340 0.367 0.298 100.
0%
144.89
%
156.17
%
126.84
%
5
CORPORATE FINANCE
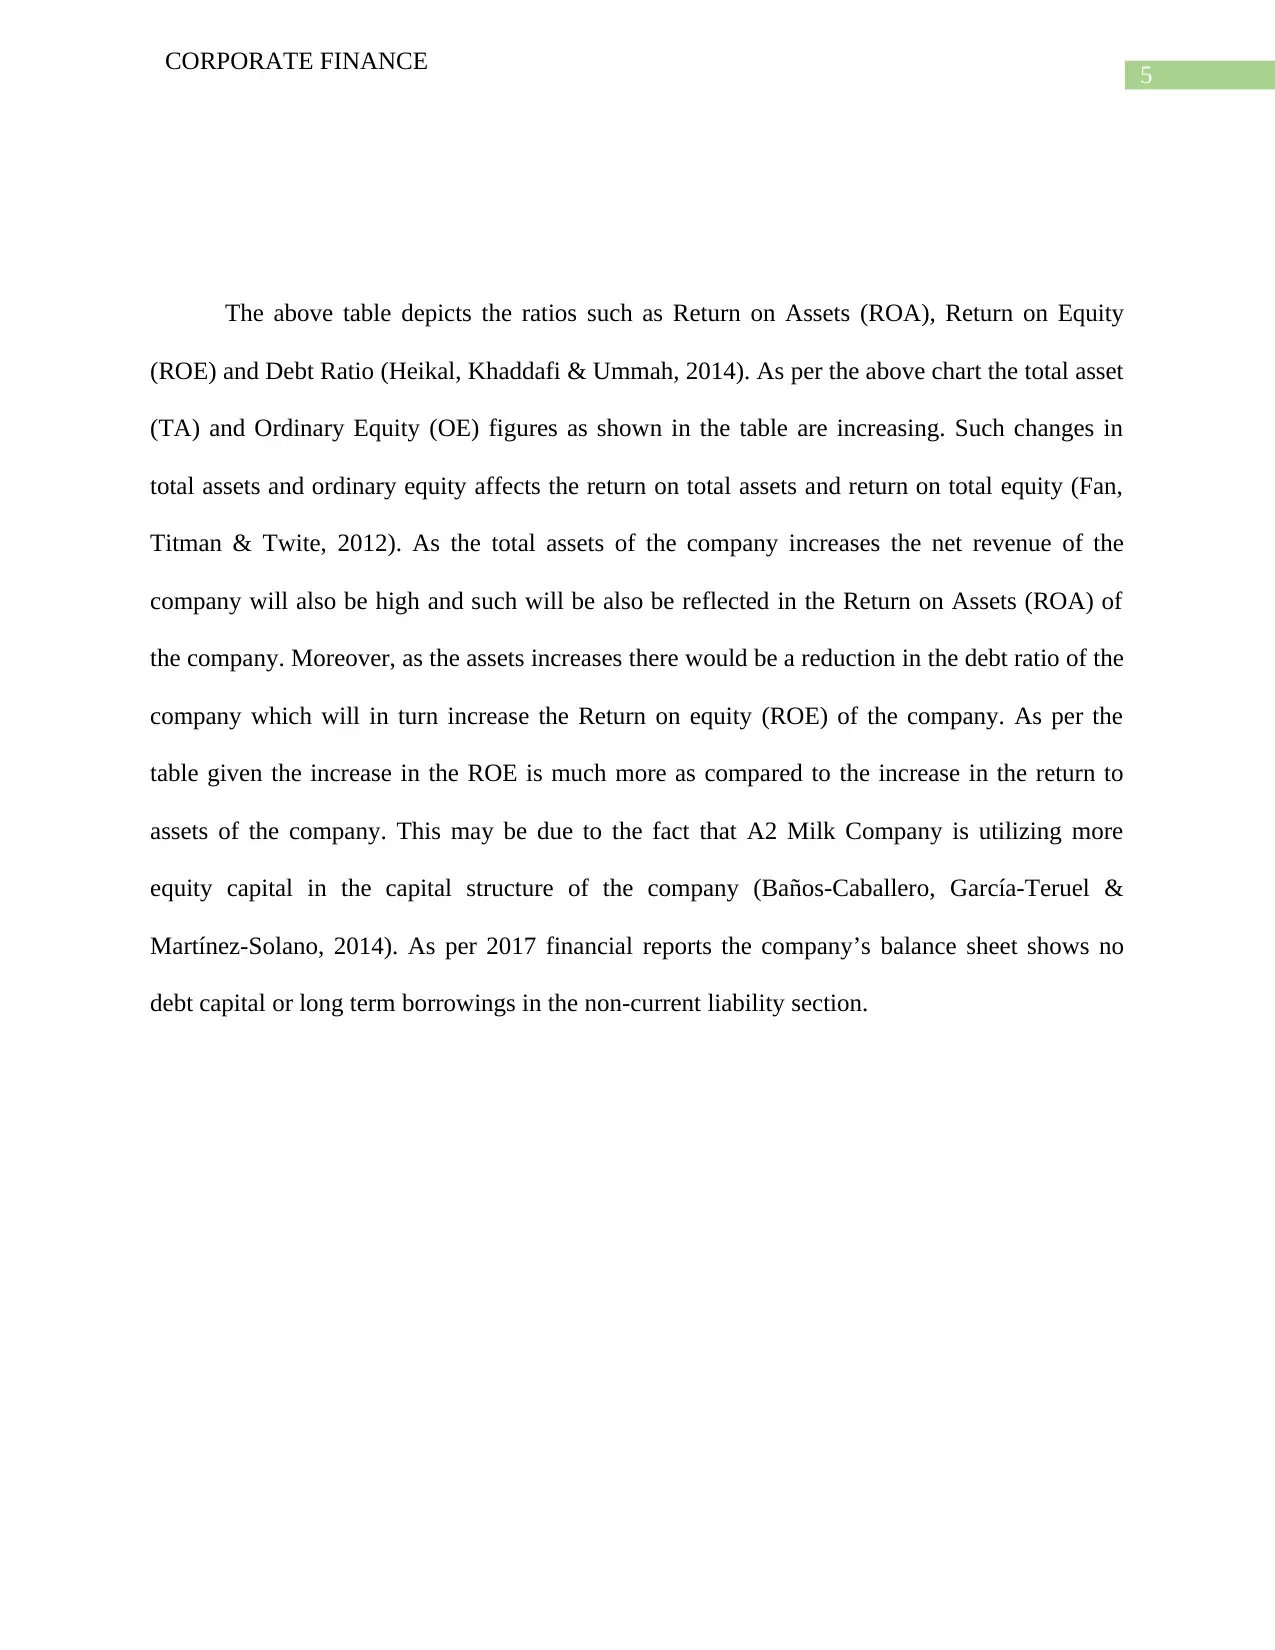
The above table depicts the ratios such as Return on Assets (ROA), Return on Equity
(ROE) and Debt Ratio (Heikal, Khaddafi & Ummah, 2014). As per the above chart the total asset
(TA) and Ordinary Equity (OE) figures as shown in the table are increasing. Such changes in
total assets and ordinary equity affects the return on total assets and return on total equity (Fan,
Titman & Twite, 2012). As the total assets of the company increases the net revenue of the
company will also be high and such will be also be reflected in the Return on Assets (ROA) of
the company. Moreover, as the assets increases there would be a reduction in the debt ratio of the
company which will in turn increase the Return on equity (ROE) of the company. As per the
table given the increase in the ROE is much more as compared to the increase in the return to
assets of the company. This may be due to the fact that A2 Milk Company is utilizing more
equity capital in the capital structure of the company (Baños-Caballero, García-Teruel &
Martínez-Solano, 2014). As per 2017 financial reports the company’s balance sheet shows no
debt capital or long term borrowings in the non-current liability section.
CORPORATE FINANCE
The above table depicts the ratios such as Return on Assets (ROA), Return on Equity
(ROE) and Debt Ratio (Heikal, Khaddafi & Ummah, 2014). As per the above chart the total asset
(TA) and Ordinary Equity (OE) figures as shown in the table are increasing. Such changes in
total assets and ordinary equity affects the return on total assets and return on total equity (Fan,
Titman & Twite, 2012). As the total assets of the company increases the net revenue of the
company will also be high and such will be also be reflected in the Return on Assets (ROA) of
the company. Moreover, as the assets increases there would be a reduction in the debt ratio of the
company which will in turn increase the Return on equity (ROE) of the company. As per the
table given the increase in the ROE is much more as compared to the increase in the return to
assets of the company. This may be due to the fact that A2 Milk Company is utilizing more
equity capital in the capital structure of the company (Baños-Caballero, García-Teruel &
Martínez-Solano, 2014). As per 2017 financial reports the company’s balance sheet shows no
debt capital or long term borrowings in the non-current liability section.
⊘ This is a preview!⊘
Do you want full access?
Subscribe today to unlock all pages.
Trusted by 1+ million students worldwide
6
CORPORATE FINANCE
4 Graphical Presentation of Stock Prices
12/1/2015
1/1/2016
2/1/2016
3/1/2016
4/1/2016
5/1/2016
6/1/2016
7/1/2016
8/1/2016
9/1/2016
10/1/2016
11/1/2016
12/1/2016
1/1/2017
2/1/2017
3/1/2017
4/1/2017
5/1/2017
6/1/2017
7/1/2017
8/1/2017
9/1/2017
10/1/2017
11/1/2017
12/1/2017
-20.00%
-10.00%
0.00%
10.00%
20.00%
30.00%
40.00%
Stock Price Movement
Australian Dairy All Ord Index
Figure1: (Graph showing Stock price Movement)
Source: (Created by the Author)
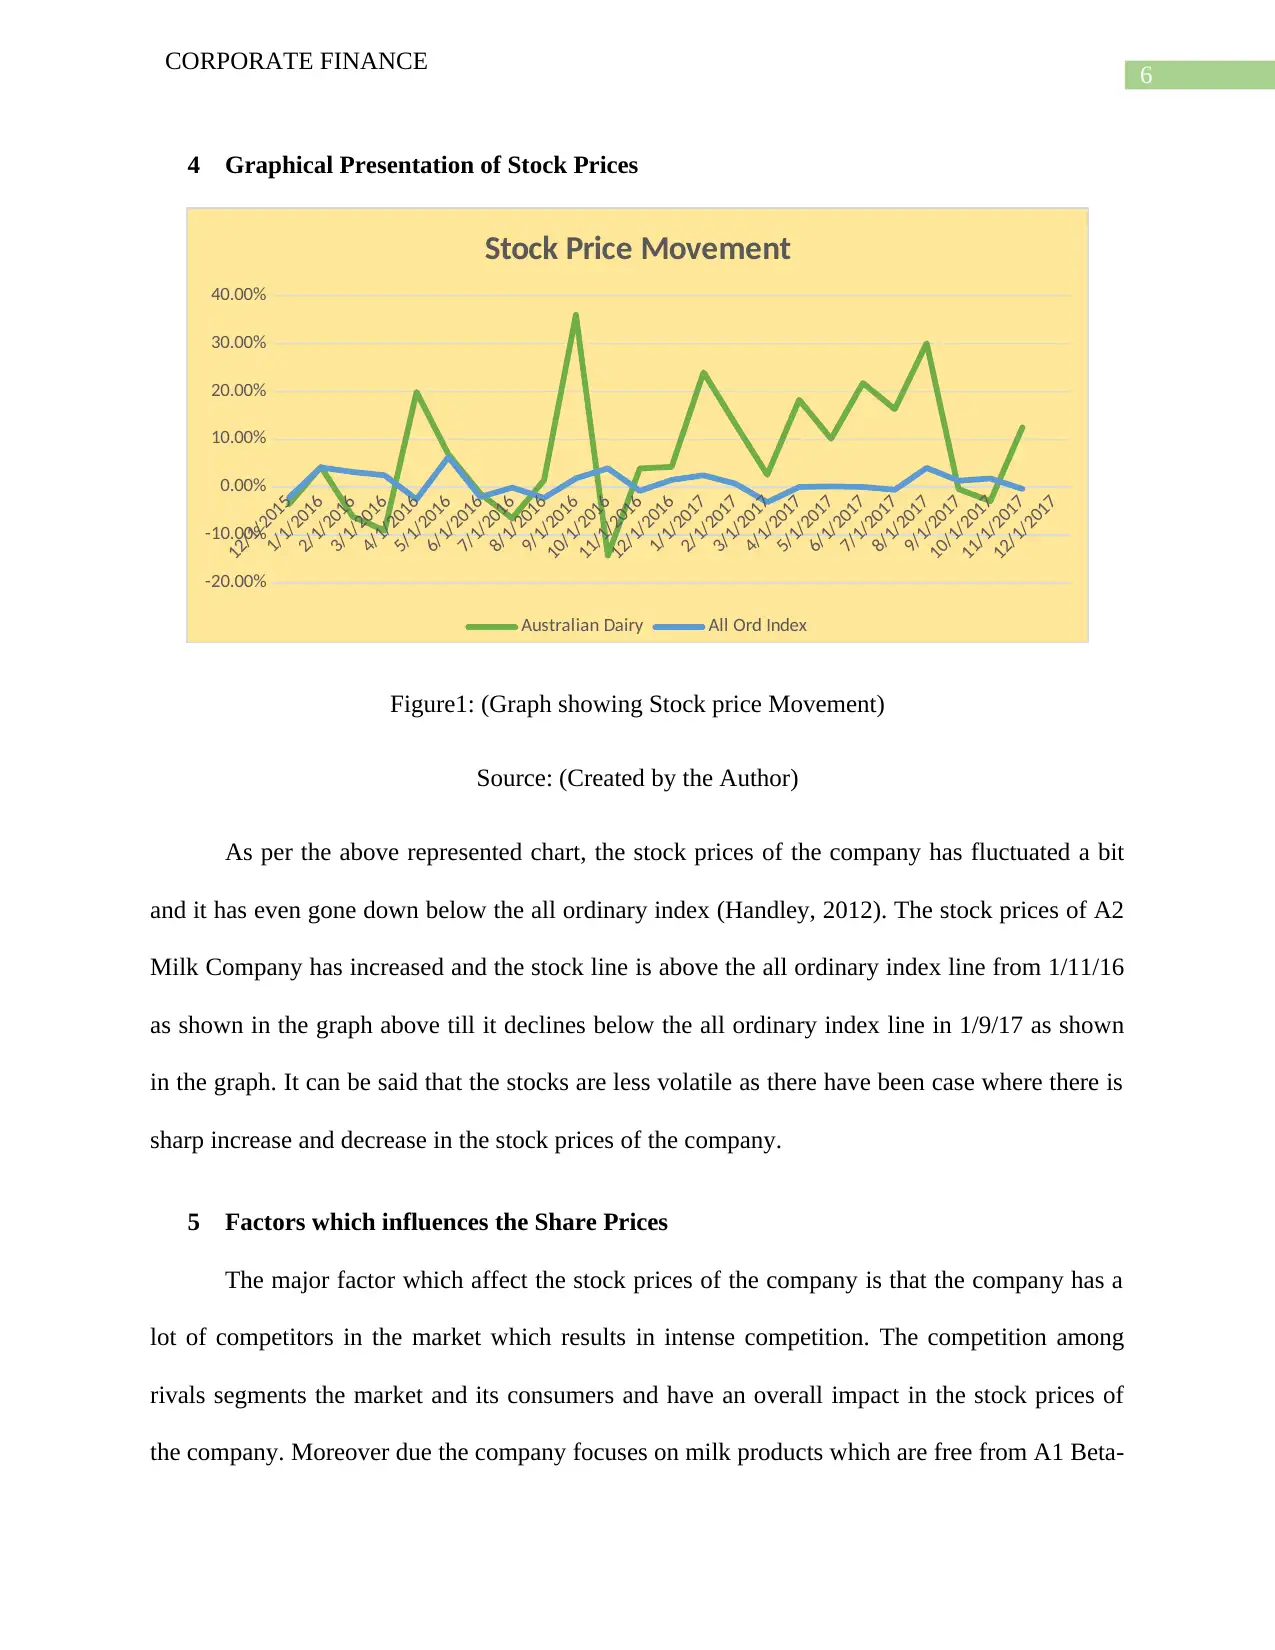
As per the above represented chart, the stock prices of the company has fluctuated a bit
and it has even gone down below the all ordinary index (Handley, 2012). The stock prices of A2
Milk Company has increased and the stock line is above the all ordinary index line from 1/11/16
as shown in the graph above till it declines below the all ordinary index line in 1/9/17 as shown
in the graph. It can be said that the stocks are less volatile as there have been case where there is
sharp increase and decrease in the stock prices of the company.
5 Factors which influences the Share Prices
The major factor which affect the stock prices of the company is that the company has a
lot of competitors in the market which results in intense competition. The competition among
rivals segments the market and its consumers and have an overall impact in the stock prices of
the company. Moreover due the company focuses on milk products which are free from A1 Beta-
CORPORATE FINANCE
4 Graphical Presentation of Stock Prices
12/1/2015
1/1/2016
2/1/2016
3/1/2016
4/1/2016
5/1/2016
6/1/2016
7/1/2016
8/1/2016
9/1/2016
10/1/2016
11/1/2016
12/1/2016
1/1/2017
2/1/2017
3/1/2017
4/1/2017
5/1/2017
6/1/2017
7/1/2017
8/1/2017
9/1/2017
10/1/2017
11/1/2017
12/1/2017
-20.00%
-10.00%
0.00%
10.00%
20.00%
30.00%
40.00%
Stock Price Movement
Australian Dairy All Ord Index
Figure1: (Graph showing Stock price Movement)
Source: (Created by the Author)
As per the above represented chart, the stock prices of the company has fluctuated a bit
and it has even gone down below the all ordinary index (Handley, 2012). The stock prices of A2
Milk Company has increased and the stock line is above the all ordinary index line from 1/11/16
as shown in the graph above till it declines below the all ordinary index line in 1/9/17 as shown
in the graph. It can be said that the stocks are less volatile as there have been case where there is
sharp increase and decrease in the stock prices of the company.
5 Factors which influences the Share Prices
The major factor which affect the stock prices of the company is that the company has a
lot of competitors in the market which results in intense competition. The competition among
rivals segments the market and its consumers and have an overall impact in the stock prices of
the company. Moreover due the company focuses on milk products which are free from A1 Beta-
Paraphrase This Document
Need a fresh take? Get an instant paraphrase of this document with our AI Paraphraser
7
CORPORATE FINANCE
Casein proteins, the company has differentiated product from normal milk which are produced
by the competitors. This does affect the creditability of the company and its products which
affect the stock prices of the company.
6 Computation of Required Rate of Return
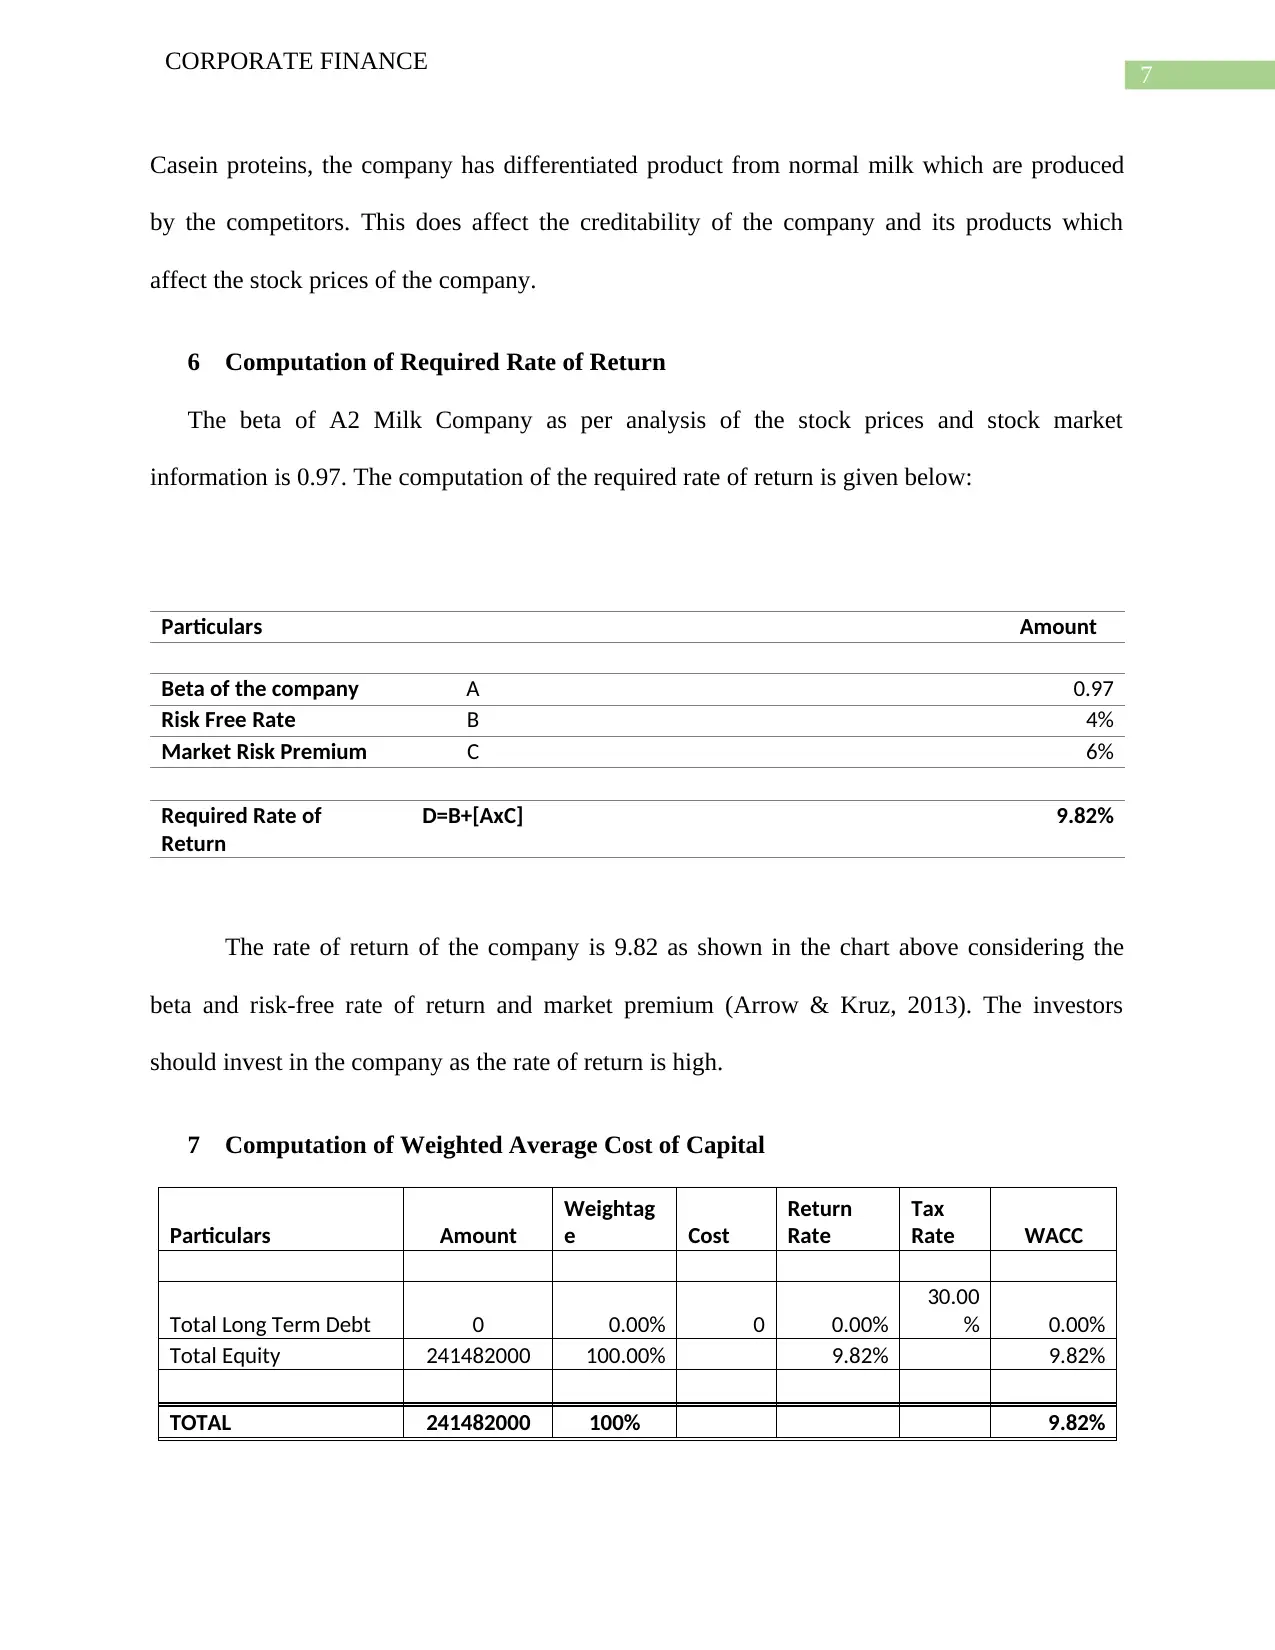
The beta of A2 Milk Company as per analysis of the stock prices and stock market
information is 0.97. The computation of the required rate of return is given below:
Particulars Amount
Beta of the company A 0.97
Risk Free Rate B 4%
Market Risk Premium C 6%
Required Rate of
Return
D=B+[AxC] 9.82%
The rate of return of the company is 9.82 as shown in the chart above considering the
beta and risk-free rate of return and market premium (Arrow & Kruz, 2013). The investors
should invest in the company as the rate of return is high.
7 Computation of Weighted Average Cost of Capital
Particulars Amount
Weightag
e Cost
Return
Rate
Tax
Rate WACC
Total Long Term Debt 0 0.00% 0 0.00%
30.00
% 0.00%
Total Equity 241482000 100.00% 9.82% 9.82%
TOTAL 241482000 100% 9.82%
CORPORATE FINANCE
Casein proteins, the company has differentiated product from normal milk which are produced
by the competitors. This does affect the creditability of the company and its products which
affect the stock prices of the company.
6 Computation of Required Rate of Return
The beta of A2 Milk Company as per analysis of the stock prices and stock market
information is 0.97. The computation of the required rate of return is given below:
Particulars Amount
Beta of the company A 0.97
Risk Free Rate B 4%
Market Risk Premium C 6%
Required Rate of
Return
D=B+[AxC] 9.82%
The rate of return of the company is 9.82 as shown in the chart above considering the
beta and risk-free rate of return and market premium (Arrow & Kruz, 2013). The investors
should invest in the company as the rate of return is high.
7 Computation of Weighted Average Cost of Capital
Particulars Amount
Weightag
e Cost
Return
Rate
Tax
Rate WACC
Total Long Term Debt 0 0.00% 0 0.00%
30.00
% 0.00%
Total Equity 241482000 100.00% 9.82% 9.82%
TOTAL 241482000 100% 9.82%
8
CORPORATE FINANCE
As per the above table it is evident that the company does not have any debt capital or
long term borrowings as per the financial statement of A2 Milk Company for 2017. Therefore
the company uses only equity capital in its capital structure. The higher is the weighted average
cost of capital the more risks the company faces. In this case the cost of equity is the weighted
average cost of capital for the company (Barberis et al., 2015). The company can add debt capital
to the capital structure mix to gain benefits of leverages.
8 Debt Ratio and Capital Gearing Ratio of the Company
The debt ratio of the company shows the relation between the total liabilities to the total
assets of the company. The debt ratio of the company has reduced from the previous year’s trend.
The company’s debt ratio was 0.367 in 2016 and it reduced to 0.298 in 2017.
The company does not have any debt capital as per the financial statement of 2017 and the
capital structure of the company only consist of equity share capital. The company thus seems to
be avoiding the use of debt capital of the company (Hou, Van Dijk & Zhang, 2012). As per the
financial statements of the company, the management of the company intends to make a buyback
of its shares in the next 12 months period which will be up to $ 40 million.
9 Dividend Policy
The company has not announced any dividends for the year, however the company plans to
announce special dividends due the buyback plans which the company intends to follow
(Travlos, Trigeorgis & Vafeas, 2015). The dividend of the company is on the basis of the profits
which the company earns during the year. The company has a basic Earnings per Share of 12.66
cent per share.
⊘ This is a preview!⊘
Do you want full access?
Subscribe today to unlock all pages.
Trusted by 1+ million students worldwide
9
CORPORATE FINANCE
10 Letter of Recommendation
Dear client,
Perth
Australia
Respected Sir,
I would like to advise you to invest in A2 Milk Company as the performance of the
company has been outstanding in the past few years. The company has achieved tremendous
growth in the Australian market with its infant formula. Moreover. the rate of return which the
company is offering is around 9.82% which is a decent rate of return as per the market. The
significant ratios such as return on assets and return on equity is on an increasing trend which is
favorable for investment. The company has also been earning good rate of net profit over the
past two years. In addition to this the company has potential for further development. I hope this
letter of recommendation will help you to take necessary investment decisions in this regard.
Thanking you
Client
Investment Company
Paraphrase This Document
Need a fresh take? Get an instant paraphrase of this document with our AI Paraphraser
10
CORPORATE FINANCE
Reference
Ahmed, K., & Henry, D. (2012). Accounting conservatism and voluntary corporate governance
mechanisms by Australian firms. Accounting & Finance, 52(3), 631-662.
Arrow, K. J., & Kruz, M. (2013). Public investment, the rate of return, and optimal fiscal
policy (Vol. 1). Routledge.
Baños-Caballero, S., García-Teruel, P. J., & Martínez-Solano, P. (2014). Working capital
management, corporate performance, and financial constraints. Journal of Business
Research, 67(3), 332-338.
Barberis, N., Greenwood, R., Jin, L., & Shleifer, A. (2015). X-CAPM: An extrapolative capital
asset pricing model. Journal of financial economics, 115(1), 1-24.
Fan, J. P., Titman, S., & Twite, G. (2012). An international comparison of capital structure and
debt maturity choices. Journal of Financial and quantitative Analysis, 47(1), 23-56.
Handley, J. C. (2012). An estimate of the historical equity risk premium for the period 1883 to
2011. Report prepared for the Australian Energy Regulator.
Heikal, M., Khaddafi, M., & Ummah, A. (2014). Influence analysis of return on assets (ROA),
return on equity (ROE), net profit margin (NPM), debt to equity ratio (DER), and current ratio
(CR), against corporate profit growth in automotive in Indonesia Stock
Exchange. International Journal of Academic Research in Business and Social
Sciences, 4(12), 101.
Hou, K., Van Dijk, M. A., & Zhang, Y. (2012). The implied cost of capital: A new
approach. Journal of Accounting and Economics, 53(3), 504-526.
11
CORPORATE FINANCE
Travlos, N. G., Trigeorgis, L., & Vafeas, N. (2015). Shareholder wealth effects of dividend
policy changes in an emerging stock market: The case of Cyprus.
The a2 Milk Company. (2018). The a2 Milk Company. Retrieved 15 February 2018, from
https://thea2milkcompany.com/
CORPORATE FINANCE
Travlos, N. G., Trigeorgis, L., & Vafeas, N. (2015). Shareholder wealth effects of dividend
policy changes in an emerging stock market: The case of Cyprus.
The a2 Milk Company. (2018). The a2 Milk Company. Retrieved 15 February 2018, from
https://thea2milkcompany.com/
⊘ This is a preview!⊘
Do you want full access?
Subscribe today to unlock all pages.
Trusted by 1+ million students worldwide
1 out of 12
Related Documents


Your All-in-One AI-Powered Toolkit for Academic Success.
+13062052269
info@desklib.com
Available 24*7 on WhatsApp / Email
![[object Object]](/_next/static/media/star-bottom.7253800d.svg)
Unlock your academic potential
Copyright © 2020–2026 A2Z Services. All Rights Reserved. Developed and managed by ZUCOL.