Detailed Financial Statement Analysis Report: A2 Milk Company (GBS003)
VerifiedAdded on 2022/08/20
|17
|3428
|10
Report
AI Summary
This report provides a comprehensive financial analysis of The A2 Milk Co. Ltd. (A2M), an Australian company specializing in infant milk formula and dairy products. The analysis examines A2M's financial performance using data from its financial statements, including the income statement, balance sheet, and cash flow statement. The report delves into various financial ratios, such as liquidity, leverage, efficiency, and profitability ratios, to assess the company's financial health and performance. It discusses the changes in these ratios over time, providing insights into the company's ability to meet its obligations, manage its assets, and generate profits. The report also compares A2M's performance with previous years, highlighting trends and providing a detailed overview of the company's financial position and operational effectiveness, with reference to its geographical segments.
Running head: FINANCIAL STATEMENT ANALYSIS
FINANCIAL STATEMENT ANALYSIS
Name of the Student
Name of the University
Author Note:
FINANCIAL STATEMENT ANALYSIS
Name of the Student
Name of the University
Author Note:
Paraphrase This Document
Need a fresh take? Get an instant paraphrase of this document with our AI Paraphraser
1FINANCIAL STATEMENT ANALYSIS
Executive Summary
This report is based on an Australian organization A2 Milk Company Ltd which is indulged in
producing infant milk formula and other dairy products, and it is listed in the ASX200. This
report provides a precise analysis of the company’s financial performance. The study provides
the changes that occurred in financial ratios and the reason for such change and a comparison of
a company’s performance with previous year results.
2FINANCIAL STATEMENT ANALYSIS
Table of Contents
Introduction......................................................................................................................................4
Discussion........................................................................................................................................4
Income Statement Analysis.............................................................................................................5
Financial Ratio Analysis..................................................................................................................6
Liquidity Ratio:................................................................................................................................6
Current Ratio:..............................................................................................................................7
Acid-test Ratio:............................................................................................................................7
Cash Ratio:...................................................................................................................................8
Leverage Financial Ratio.................................................................................................................8
Debt Ratio:...................................................................................................................................9
Debt-Equity Ratio:.......................................................................................................................9
Efficiency Ratio.............................................................................................................................10
Asset Turnover Ratio:................................................................................................................10
Inventory Turnover Ratio:.........................................................................................................10
Days sales in inventory ratio:....................................................................................................11
Profitability Ratio..........................................................................................................................11
Gross Profit Margin Ratio:........................................................................................................12
Operating Profit Margin:...........................................................................................................12
Return on Asset:........................................................................................................................13
⊘ This is a preview!⊘
Do you want full access?
Subscribe today to unlock all pages.
Trusted by 1+ million students worldwide
3FINANCIAL STATEMENT ANALYSIS
Return on Equity:.......................................................................................................................13
Conclusion.....................................................................................................................................14
Reference.......................................................................................................................................15
Paraphrase This Document
Need a fresh take? Get an instant paraphrase of this document with our AI Paraphraser
4FINANCIAL STATEMENT ANALYSIS
Introduction
This paper will focus on the financial performance of The A2 Milk Co. Ltd. (A2M)
which is a listed company established in New Zealand in the year 2000. It operates in Australia
and New Zealand, United Kingdom, and the USA. A2M generates revenue from producing and
distributing infant formula, milk and dairy products. The A2M is the inheritor of the A2
Corporation Limited, a New Zealand company founded in 2000. The company commercializes
in intellectual property that is related to A1 milk which is protein-free and is traded under A2
milk brands. The headquarter of A2M is located in Auckland, New Zealand. The founder of the
A2 Milk Co. Ltd is Corran Mclachlan and Howard Paterson, and the latter is also New Zealand’s
richest men.
Discussion
The company is earning significant revenue over the previous years and has delivered a
record financial statement and market share information for 2019, which was accompanied by
solid progression. The upsurge in the growth is seen because of the increasing awareness of the
consumers for health and wellbeing, focus on food safety, developing middle class of Asia,
naturalness, and provenance and the rapid pace of digitalization (Thea2milkcompany.com.
2020).
The company A2M is devoted in sustaining the highest standard of corporate governance
and it is nurtured according to the NZX Corporate Governance Code and the ASX Corporate
Governance Council’s Corporate Governance Principal and Recommendation. The financial
statement of the company is prepared based on General Accepted Accounting Practice in New
Zealand and it complies with the International Financial Reporting Standards (IFRS). The
5FINANCIAL STATEMENT ANALYSIS
financial statements has been prepared using the historical cost concept, except for the listed
investment, as it does not consider the changing monetary values i.e, fair values of asset.
Substantial accounting policies used to prepare the financial statement while recording the
transaction is that foreign currency are initially converted into the corresponding functional
currency of the group companies at a rate in which the transaction takes place. All the financial
assets and liabilities which are epitomized in foreign currencies are decoded to the functional
currencies at the exchange rate reigning on the date of reporting. The difference in the foreign
exchange is documented in the comprehensive income statement.
Income Statement Analysis
The consolidated income statement are acknowledged from the internal reports of the
company, and the group is organized based on the geographical location (Robinson, T.R., 2020).
From 1st June the group operating segment has been divided into four groups:
The external returns received by Australia and New Zealand from the sale of infant
formula, milk, and other dairy product. The additional income received by the company
is income from license fees and royalty.
The Asian segment receives income from the sale of milk, infant formula, and dairy
products.
The segment of the USA receives income from the sale of milk.
The segment of the UK receives income from the sale of milk and infant formula.
The above revenues are considered after deducting all the items of variable consideration,
like rebates, trade discounts as agreed with the customers. The sales of the company are
recognized at the time when the products are actually transferred to the customer. The credit
⊘ This is a preview!⊘
Do you want full access?
Subscribe today to unlock all pages.
Trusted by 1+ million students worldwide
6FINANCIAL STATEMENT ANALYSIS
period that is granted to the debtors does not exceeds more than 60 days, while other options for
settlement are cash on delivery and prepaid terms.
Financial Ratio Analysis
When numerical values are taken from the financial statement to arrive at meaningful
information which are reflected in terms of the ratio is termed as financial ratios (Rashid, 2018).
An analysis of the financial ratio requires examination of the company’s financial statement –
balance sheet, income statement, cash flow and comprehensive income statement. It is a
quantitative analysis which provides result regarding the company’s liquidity, leverage, growth,
rate of return, profit margins and more. The report serves two main purposes (Robinson et al.,
2015):
Tracking company performance
Making a judgment on the enactment of the company.
The users of the financial ratios include external and internal parties. External parties include
creditors, tax authorities, regulatory authorities, investors and financial analysts. Internal users
include employees, management team, and the owners of the company. The analysis of the
financial ratio is done in four main categories:
Liquidity Ratio:
The purpose of this ratio is to examines the capability of the A2M to settle its current
liabilities as and when they become payable. It measures how easy the company can raise
enough cash or how well it can convert its assets into cash (Garanina and Belova, 2015). The
liquidity of the company is measured by the current ratio, acid-test ratio, and cash ratio, the
calculation of which has been listed below:
Paraphrase This Document
Need a fresh take? Get an instant paraphrase of this document with our AI Paraphraser
7FINANCIAL STATEMENT ANALYSIS
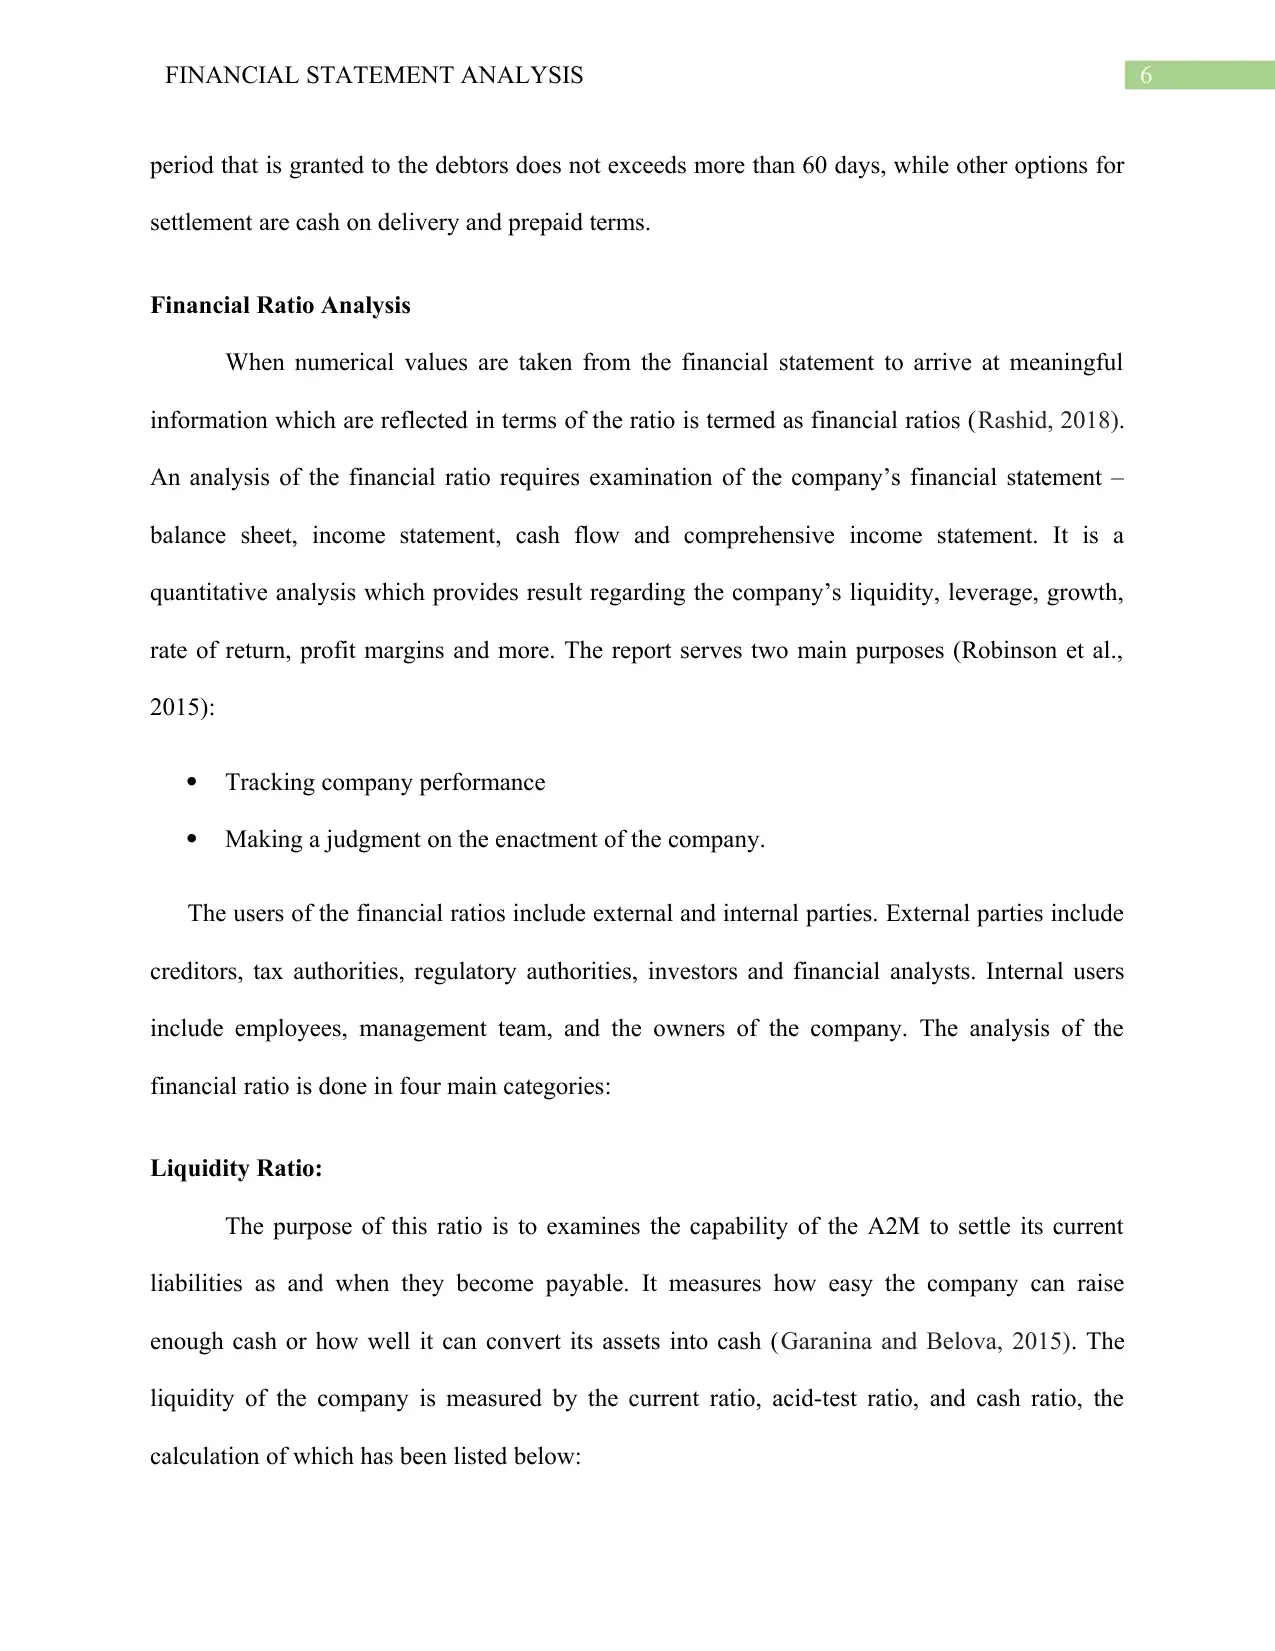
Current Ratio:
The current ratio is evaluated by dividing the current asset with the current liability. The
current ratio of the A2M is greater than the ideal ratio, which is 2:1 i.e. current asset is twice the
current liability (Arkan, 2016). Such high ratio (3.3:1) signifies that the company is financially
sound and has enough liquid to pay off its current obligation before it becomes overdue. The
current ratio of the company has increased by more than 32% as compared with the previous
year. The increase in the current ratio is because of the rise in the asset, as the A2M company
decided to increase the inventory due to rising sales and as a result of which the asset has been
increased.
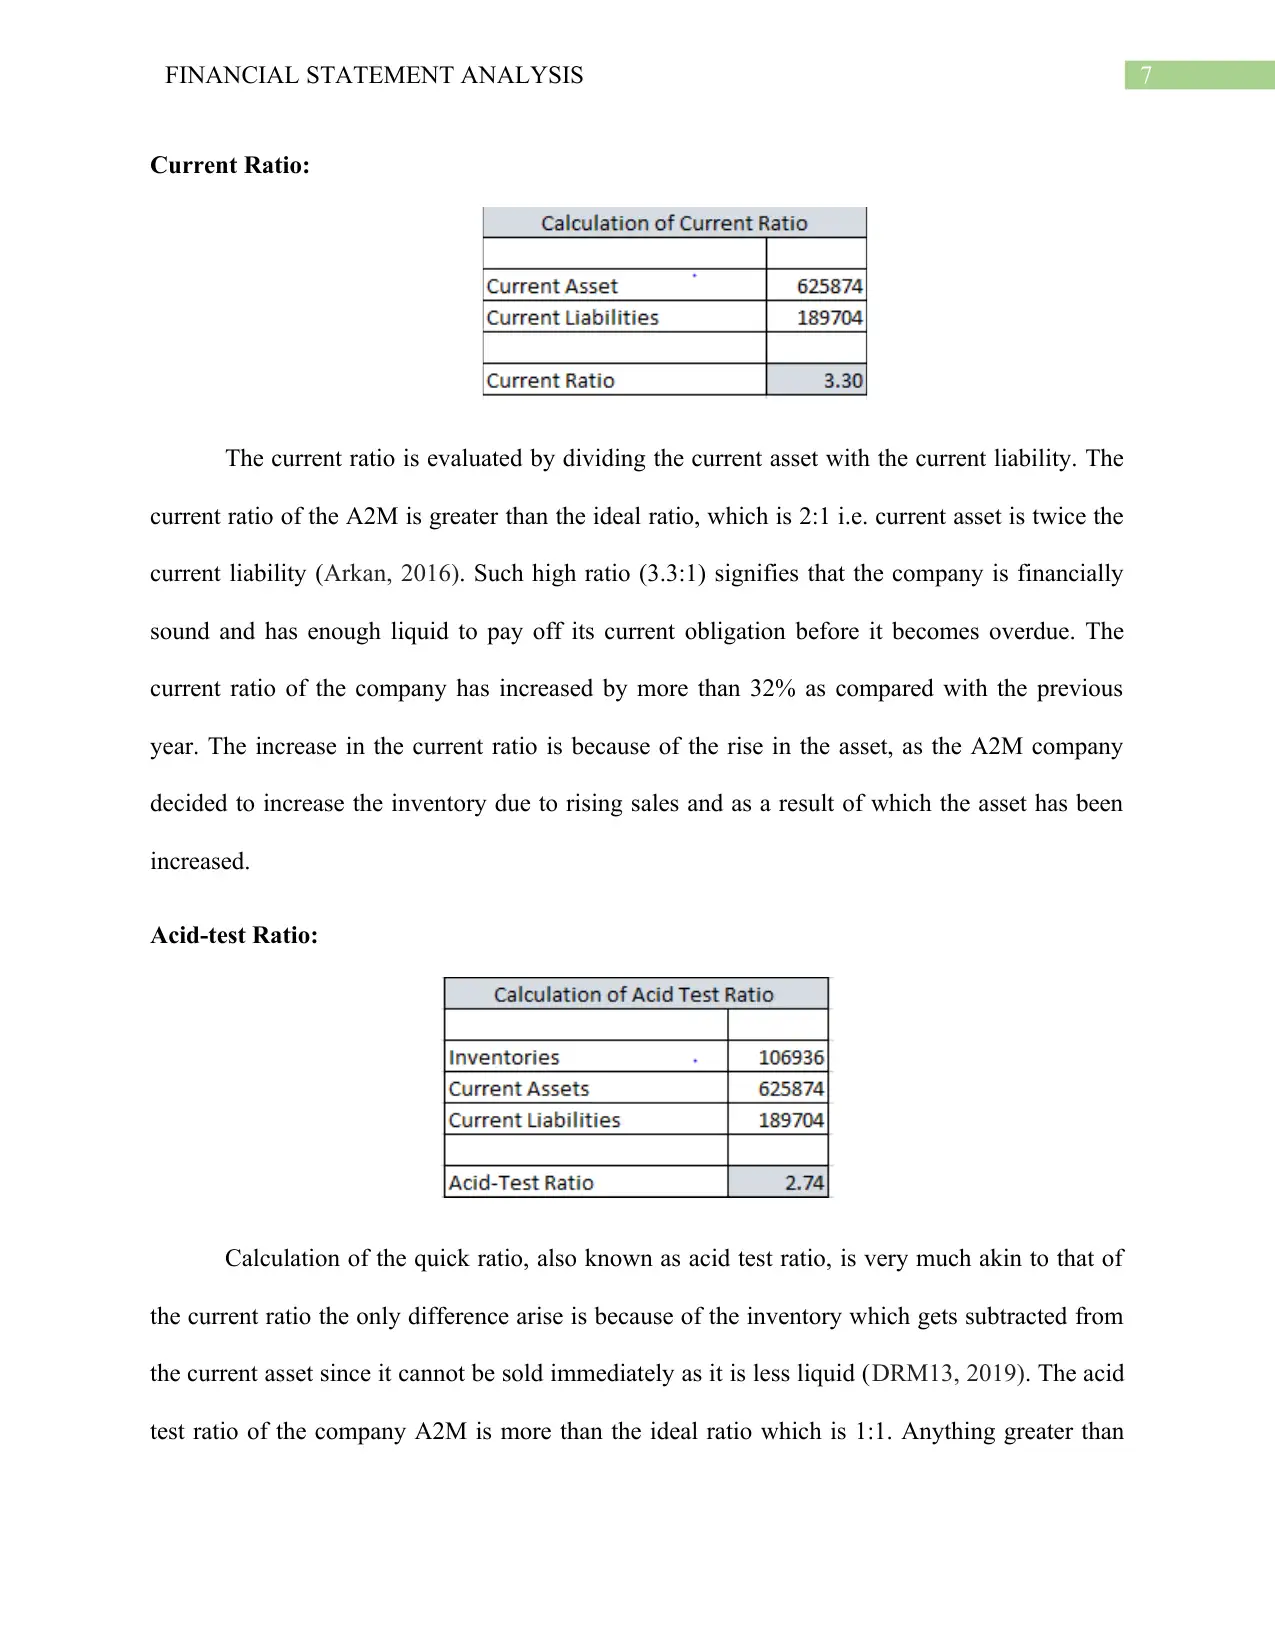
Acid-test Ratio:
Calculation of the quick ratio, also known as acid test ratio, is very much akin to that of
the current ratio the only difference arise is because of the inventory which gets subtracted from
the current asset since it cannot be sold immediately as it is less liquid (DRM13, 2019). The acid
test ratio of the company A2M is more than the ideal ratio which is 1:1. Anything greater than
Current Ratio:
The current ratio is evaluated by dividing the current asset with the current liability. The
current ratio of the A2M is greater than the ideal ratio, which is 2:1 i.e. current asset is twice the
current liability (Arkan, 2016). Such high ratio (3.3:1) signifies that the company is financially
sound and has enough liquid to pay off its current obligation before it becomes overdue. The
current ratio of the company has increased by more than 32% as compared with the previous
year. The increase in the current ratio is because of the rise in the asset, as the A2M company
decided to increase the inventory due to rising sales and as a result of which the asset has been
increased.
Acid-test Ratio:
Calculation of the quick ratio, also known as acid test ratio, is very much akin to that of
the current ratio the only difference arise is because of the inventory which gets subtracted from
the current asset since it cannot be sold immediately as it is less liquid (DRM13, 2019). The acid
test ratio of the company A2M is more than the ideal ratio which is 1:1. Anything greater than
8FINANCIAL STATEMENT ANALYSIS
the ideal ratio is considered that the company is experiencing solid top-line growth and the
receivables are quickly convertible which makes it easy for the company to cover its financial
obligation. Comparing the figures of the company A2M with the last year, an upsurge of more
than 26% has been seen in the fiscal year. Since there is an increase in the inventory, the growth
has increased but at a declining rate.
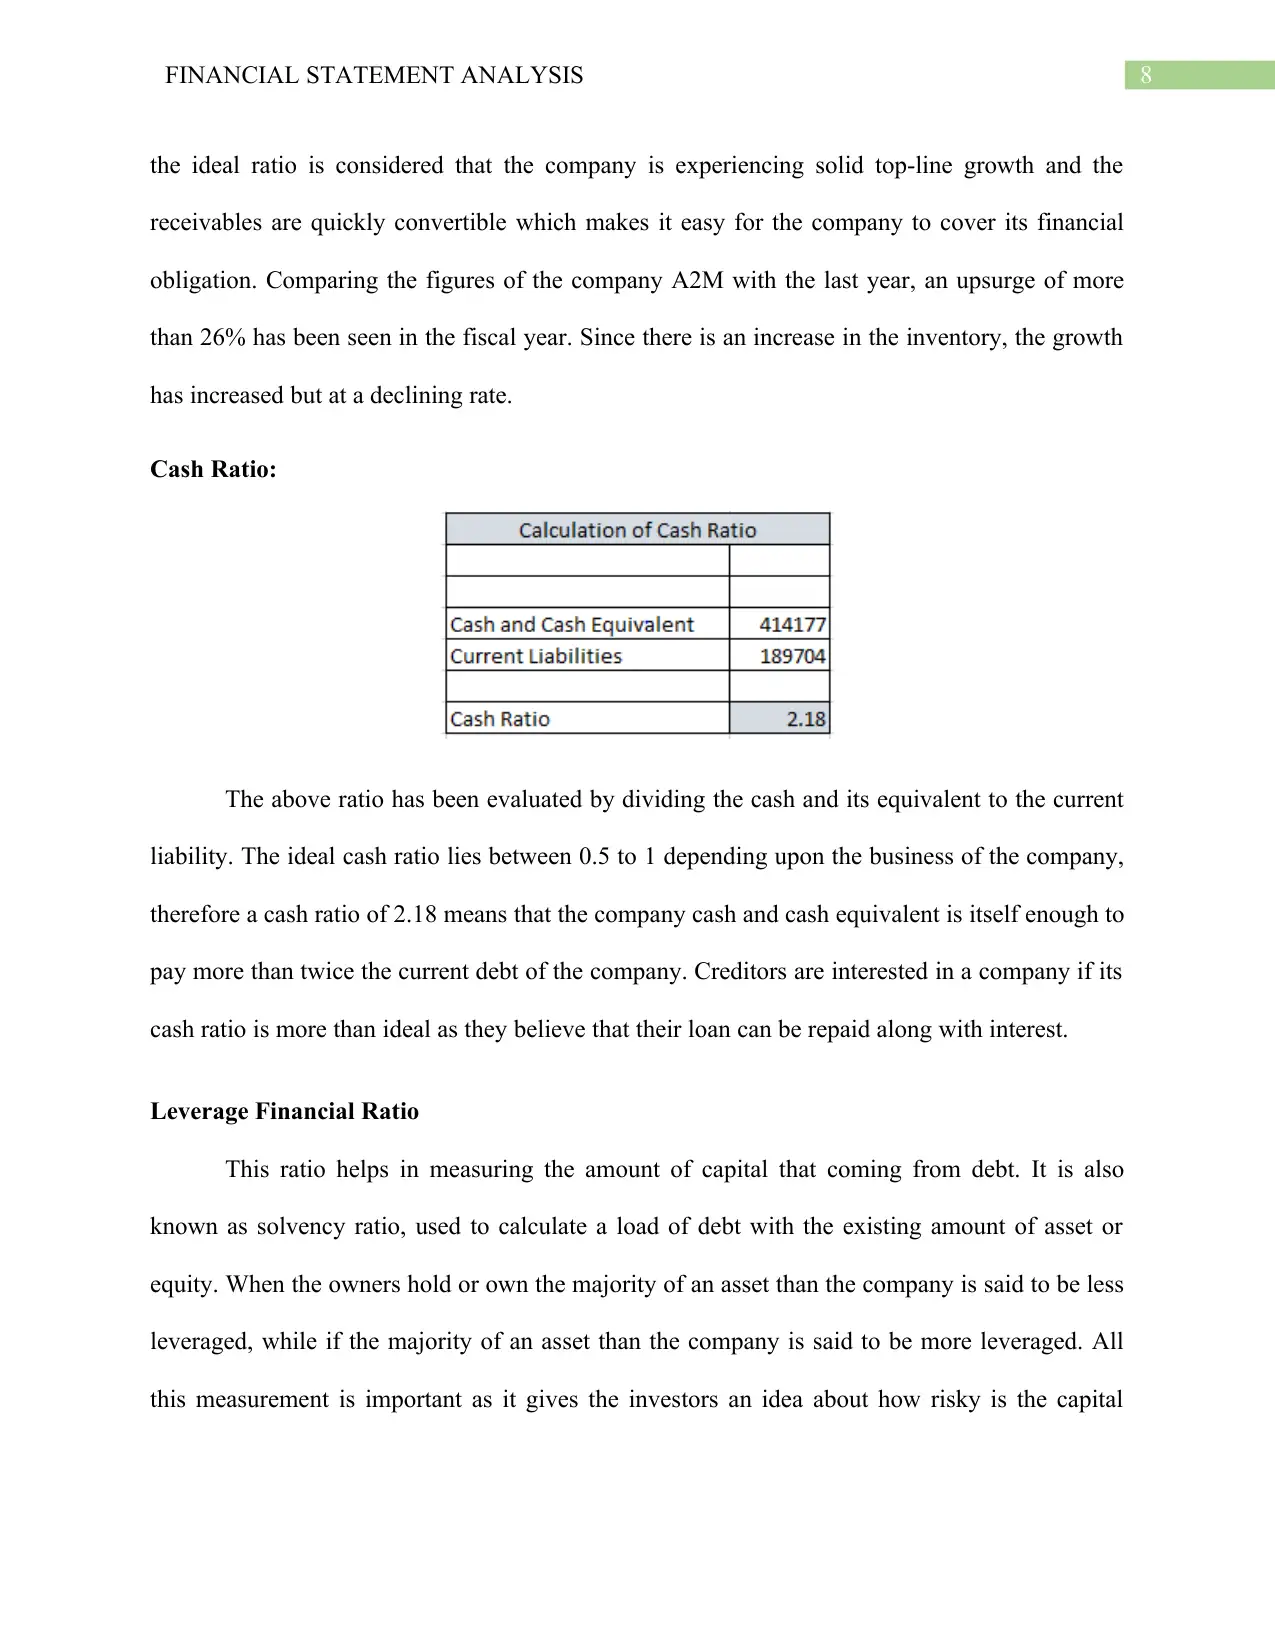
Cash Ratio:
The above ratio has been evaluated by dividing the cash and its equivalent to the current
liability. The ideal cash ratio lies between 0.5 to 1 depending upon the business of the company,
therefore a cash ratio of 2.18 means that the company cash and cash equivalent is itself enough to
pay more than twice the current debt of the company. Creditors are interested in a company if its
cash ratio is more than ideal as they believe that their loan can be repaid along with interest.
Leverage Financial Ratio
This ratio helps in measuring the amount of capital that coming from debt. It is also
known as solvency ratio, used to calculate a load of debt with the existing amount of asset or
equity. When the owners hold or own the majority of an asset than the company is said to be less
leveraged, while if the majority of an asset than the company is said to be more leveraged. All
this measurement is important as it gives the investors an idea about how risky is the capital
the ideal ratio is considered that the company is experiencing solid top-line growth and the
receivables are quickly convertible which makes it easy for the company to cover its financial
obligation. Comparing the figures of the company A2M with the last year, an upsurge of more
than 26% has been seen in the fiscal year. Since there is an increase in the inventory, the growth
has increased but at a declining rate.
Cash Ratio:
The above ratio has been evaluated by dividing the cash and its equivalent to the current
liability. The ideal cash ratio lies between 0.5 to 1 depending upon the business of the company,
therefore a cash ratio of 2.18 means that the company cash and cash equivalent is itself enough to
pay more than twice the current debt of the company. Creditors are interested in a company if its
cash ratio is more than ideal as they believe that their loan can be repaid along with interest.
Leverage Financial Ratio
This ratio helps in measuring the amount of capital that coming from debt. It is also
known as solvency ratio, used to calculate a load of debt with the existing amount of asset or
equity. When the owners hold or own the majority of an asset than the company is said to be less
leveraged, while if the majority of an asset than the company is said to be more leveraged. All
this measurement is important as it gives the investors an idea about how risky is the capital
⊘ This is a preview!⊘
Do you want full access?
Subscribe today to unlock all pages.
Trusted by 1+ million students worldwide
9FINANCIAL STATEMENT ANALYSIS
structure of the company and whether it will be a profitable investment. (Adenugba, Ige and
Kesinro, 2016).
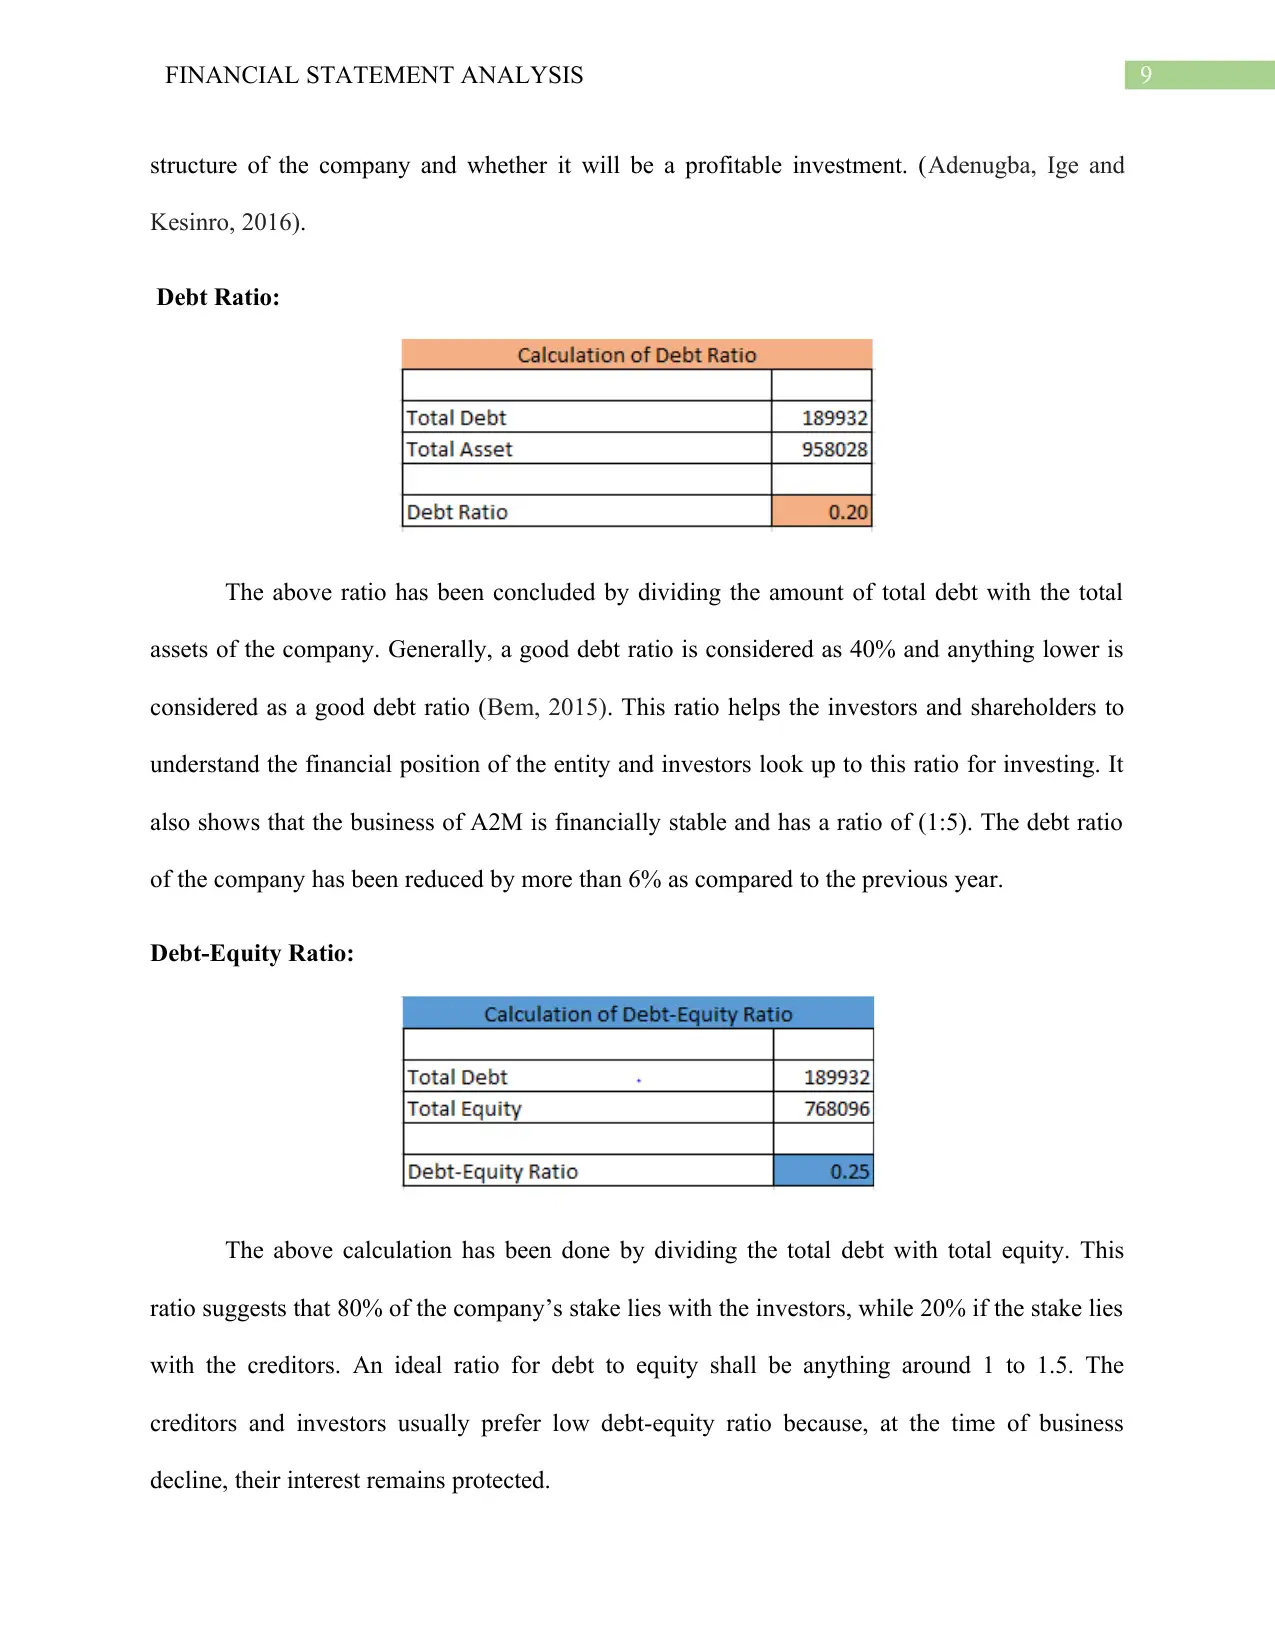
Debt Ratio:
The above ratio has been concluded by dividing the amount of total debt with the total
assets of the company. Generally, a good debt ratio is considered as 40% and anything lower is
considered as a good debt ratio (Bem, 2015). This ratio helps the investors and shareholders to
understand the financial position of the entity and investors look up to this ratio for investing. It
also shows that the business of A2M is financially stable and has a ratio of (1:5). The debt ratio
of the company has been reduced by more than 6% as compared to the previous year.
Debt-Equity Ratio:
The above calculation has been done by dividing the total debt with total equity. This
ratio suggests that 80% of the company’s stake lies with the investors, while 20% if the stake lies
with the creditors. An ideal ratio for debt to equity shall be anything around 1 to 1.5. The
creditors and investors usually prefer low debt-equity ratio because, at the time of business
decline, their interest remains protected.
structure of the company and whether it will be a profitable investment. (Adenugba, Ige and
Kesinro, 2016).
Debt Ratio:
The above ratio has been concluded by dividing the amount of total debt with the total
assets of the company. Generally, a good debt ratio is considered as 40% and anything lower is
considered as a good debt ratio (Bem, 2015). This ratio helps the investors and shareholders to
understand the financial position of the entity and investors look up to this ratio for investing. It
also shows that the business of A2M is financially stable and has a ratio of (1:5). The debt ratio
of the company has been reduced by more than 6% as compared to the previous year.
Debt-Equity Ratio:
The above calculation has been done by dividing the total debt with total equity. This
ratio suggests that 80% of the company’s stake lies with the investors, while 20% if the stake lies
with the creditors. An ideal ratio for debt to equity shall be anything around 1 to 1.5. The
creditors and investors usually prefer low debt-equity ratio because, at the time of business
decline, their interest remains protected.
Paraphrase This Document
Need a fresh take? Get an instant paraphrase of this document with our AI Paraphraser
10FINANCIAL STATEMENT ANALYSIS
Efficiency Ratio
The efficiency ratio, also called activity ratio, processes how proficiently a company can
utilize its resources. The lower the ratio healthier for the company. Generally, 50% is regarded as
the highest ideal ratio. An efficient organization minimizes its net investment on the asset and
therefore requires less capital in order to remain in operation (Schaltegger and Burritt, 2017).
Standard efficiency ratio includes: -
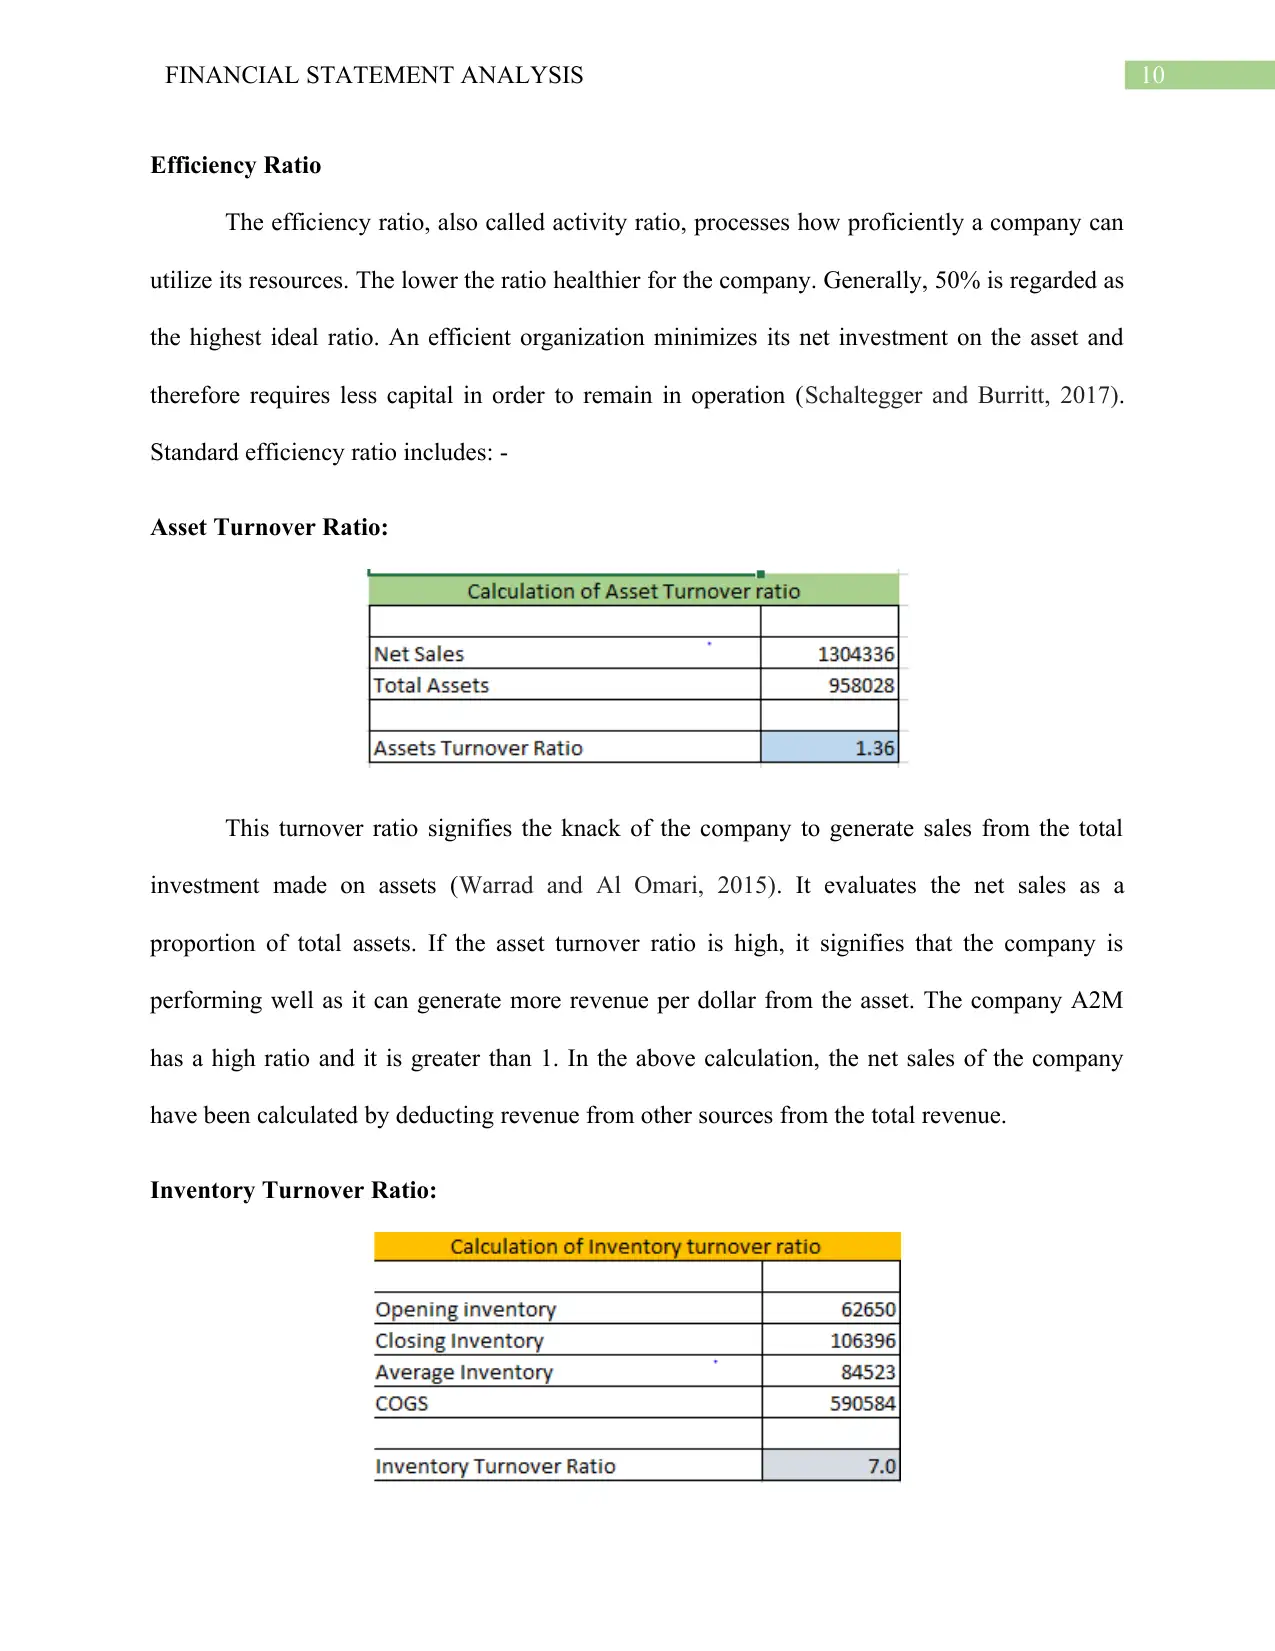
Asset Turnover Ratio:
This turnover ratio signifies the knack of the company to generate sales from the total
investment made on assets (Warrad and Al Omari, 2015). It evaluates the net sales as a
proportion of total assets. If the asset turnover ratio is high, it signifies that the company is
performing well as it can generate more revenue per dollar from the asset. The company A2M
has a high ratio and it is greater than 1. In the above calculation, the net sales of the company
have been calculated by deducting revenue from other sources from the total revenue.
Inventory Turnover Ratio:
Efficiency Ratio
The efficiency ratio, also called activity ratio, processes how proficiently a company can
utilize its resources. The lower the ratio healthier for the company. Generally, 50% is regarded as
the highest ideal ratio. An efficient organization minimizes its net investment on the asset and
therefore requires less capital in order to remain in operation (Schaltegger and Burritt, 2017).
Standard efficiency ratio includes: -
Asset Turnover Ratio:
This turnover ratio signifies the knack of the company to generate sales from the total
investment made on assets (Warrad and Al Omari, 2015). It evaluates the net sales as a
proportion of total assets. If the asset turnover ratio is high, it signifies that the company is
performing well as it can generate more revenue per dollar from the asset. The company A2M
has a high ratio and it is greater than 1. In the above calculation, the net sales of the company
have been calculated by deducting revenue from other sources from the total revenue.
Inventory Turnover Ratio:
11FINANCIAL STATEMENT ANALYSIS
The ratio has been evaluated by dividing the COGS with the average inventory.
Estmation of the average inventory is done by aggregating opening inventory and closing
inventory and dividing it by 2. The ideal inventory ratio lies from around 4 to 6. A higher
inventory turnover ratio reflects the company has effective inventory management. The
inventory turnover has increased which can be a result of higher sales and lower input costs,
which drives profits and cash flow higher (Shardeo, 2015). These will provide better negotiation
power to the business.
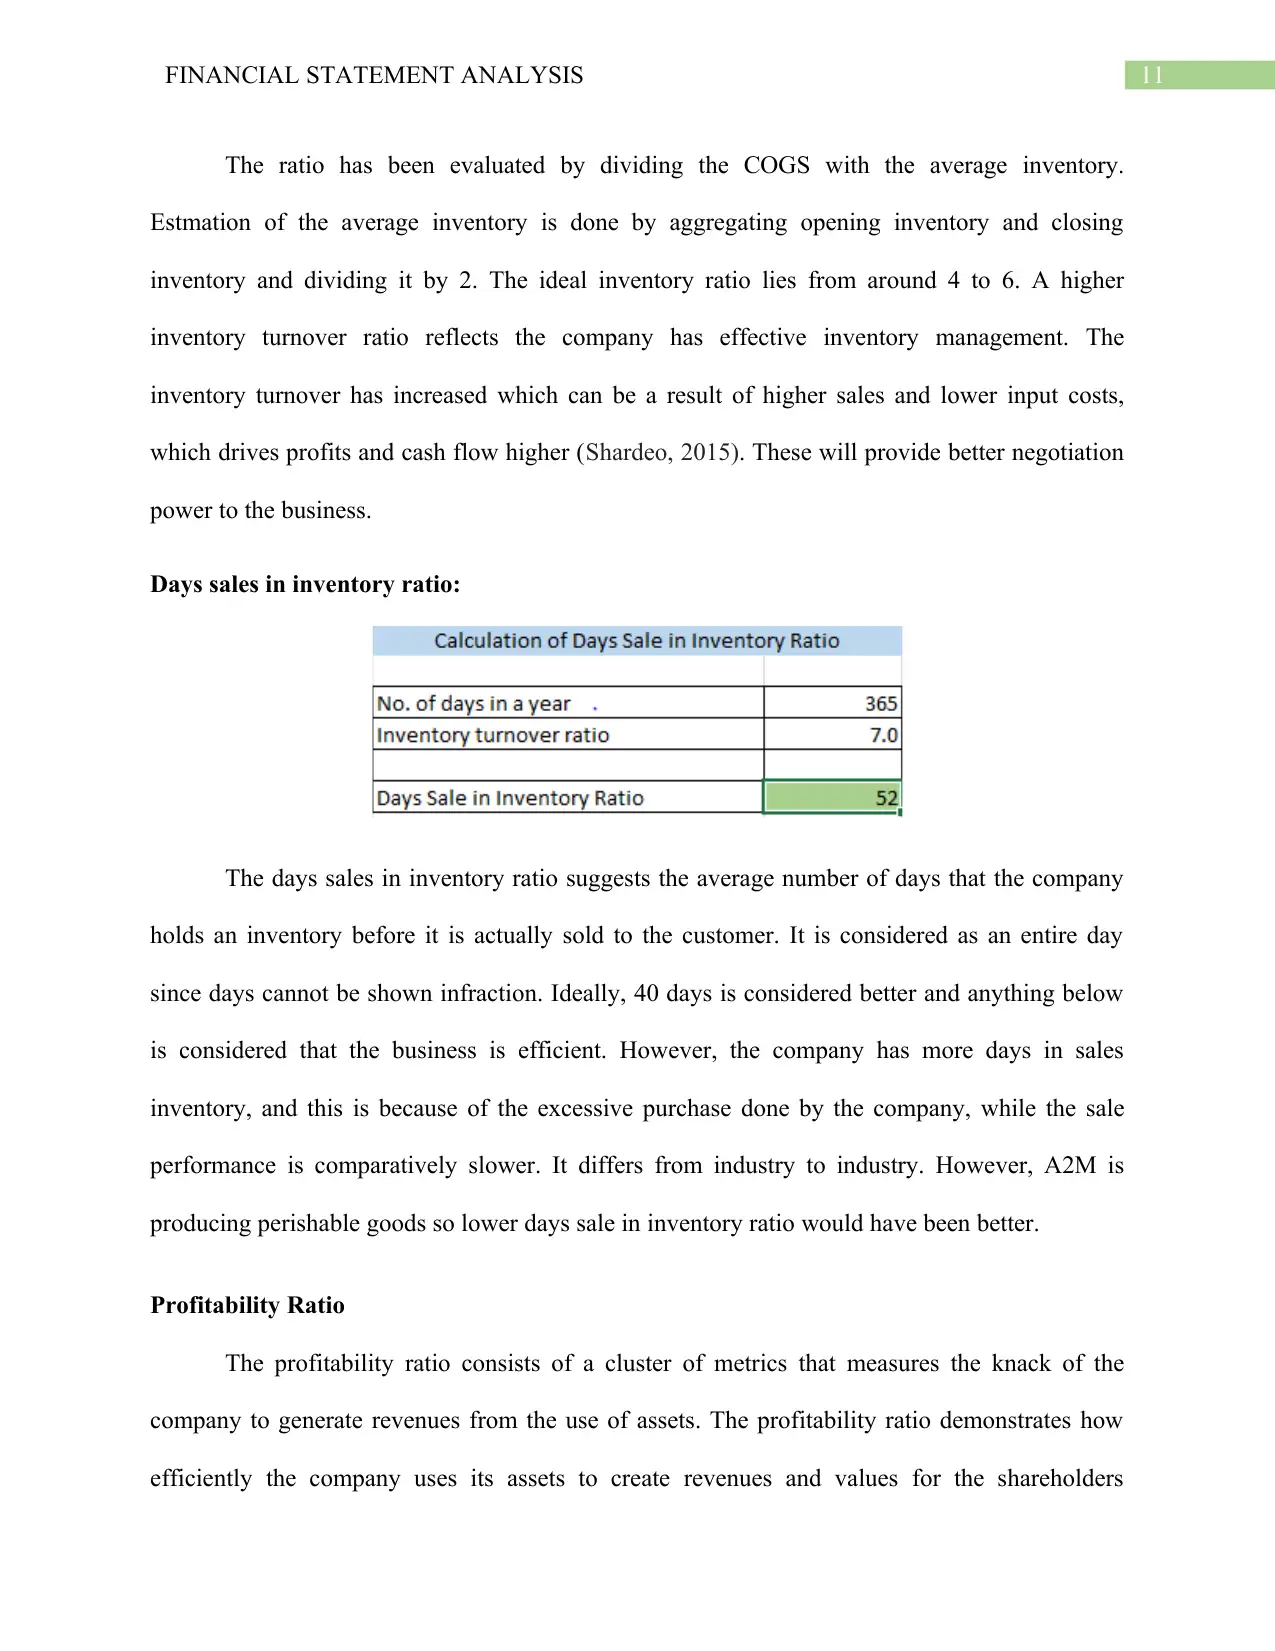
Days sales in inventory ratio:
The days sales in inventory ratio suggests the average number of days that the company
holds an inventory before it is actually sold to the customer. It is considered as an entire day
since days cannot be shown infraction. Ideally, 40 days is considered better and anything below
is considered that the business is efficient. However, the company has more days in sales
inventory, and this is because of the excessive purchase done by the company, while the sale
performance is comparatively slower. It differs from industry to industry. However, A2M is
producing perishable goods so lower days sale in inventory ratio would have been better.
Profitability Ratio
The profitability ratio consists of a cluster of metrics that measures the knack of the
company to generate revenues from the use of assets. The profitability ratio demonstrates how
efficiently the company uses its assets to create revenues and values for the shareholders
The ratio has been evaluated by dividing the COGS with the average inventory.
Estmation of the average inventory is done by aggregating opening inventory and closing
inventory and dividing it by 2. The ideal inventory ratio lies from around 4 to 6. A higher
inventory turnover ratio reflects the company has effective inventory management. The
inventory turnover has increased which can be a result of higher sales and lower input costs,
which drives profits and cash flow higher (Shardeo, 2015). These will provide better negotiation
power to the business.
Days sales in inventory ratio:
The days sales in inventory ratio suggests the average number of days that the company
holds an inventory before it is actually sold to the customer. It is considered as an entire day
since days cannot be shown infraction. Ideally, 40 days is considered better and anything below
is considered that the business is efficient. However, the company has more days in sales
inventory, and this is because of the excessive purchase done by the company, while the sale
performance is comparatively slower. It differs from industry to industry. However, A2M is
producing perishable goods so lower days sale in inventory ratio would have been better.
Profitability Ratio
The profitability ratio consists of a cluster of metrics that measures the knack of the
company to generate revenues from the use of assets. The profitability ratio demonstrates how
efficiently the company uses its assets to create revenues and values for the shareholders
⊘ This is a preview!⊘
Do you want full access?
Subscribe today to unlock all pages.
Trusted by 1+ million students worldwide
1 out of 17
Related Documents


Your All-in-One AI-Powered Toolkit for Academic Success.
+13062052269
info@desklib.com
Available 24*7 on WhatsApp / Email
![[object Object]](/_next/static/media/star-bottom.7253800d.svg)
Unlock your academic potential
Copyright © 2020–2026 A2Z Services. All Rights Reserved. Developed and managed by ZUCOL.