HI5002 Finance: Group Assignment on A2 Milk Company Analysis
VerifiedAdded on  2022/10/19
|23
|3510
|496
Report
AI Summary
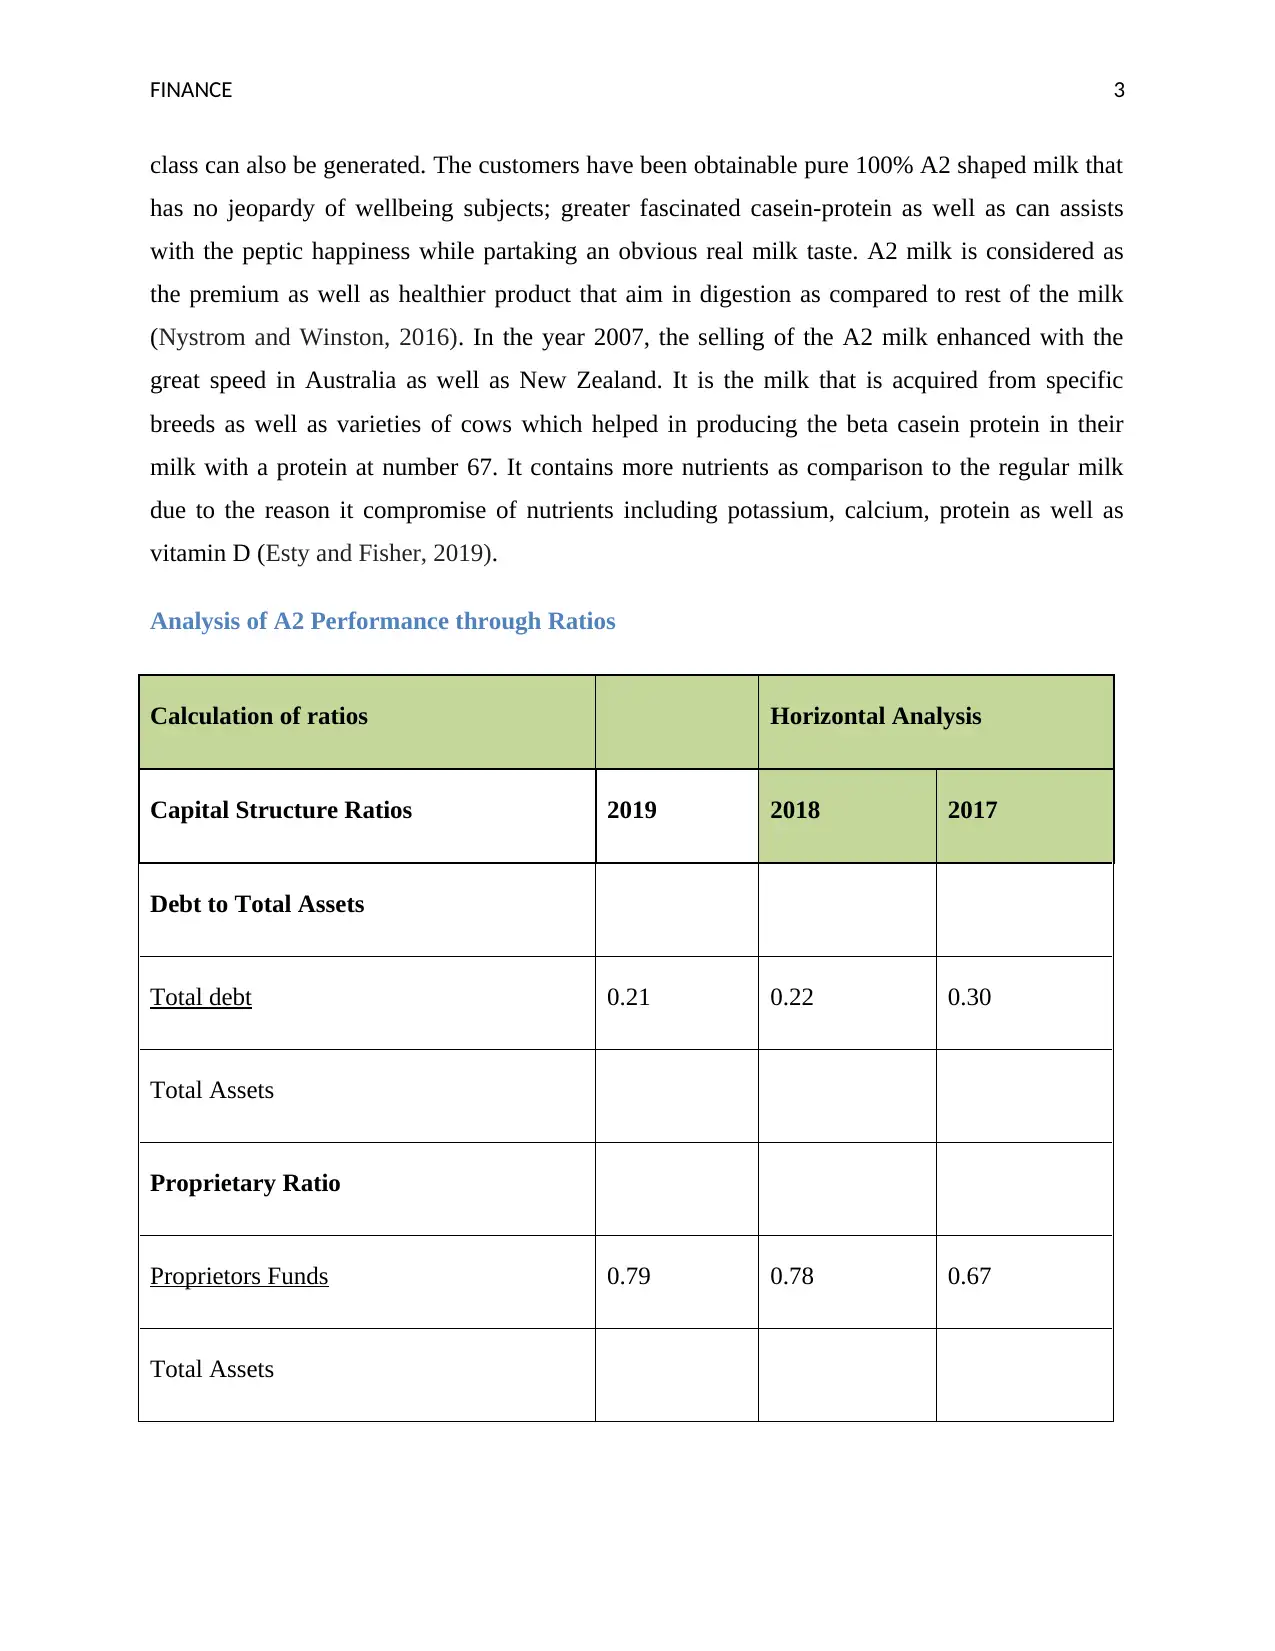
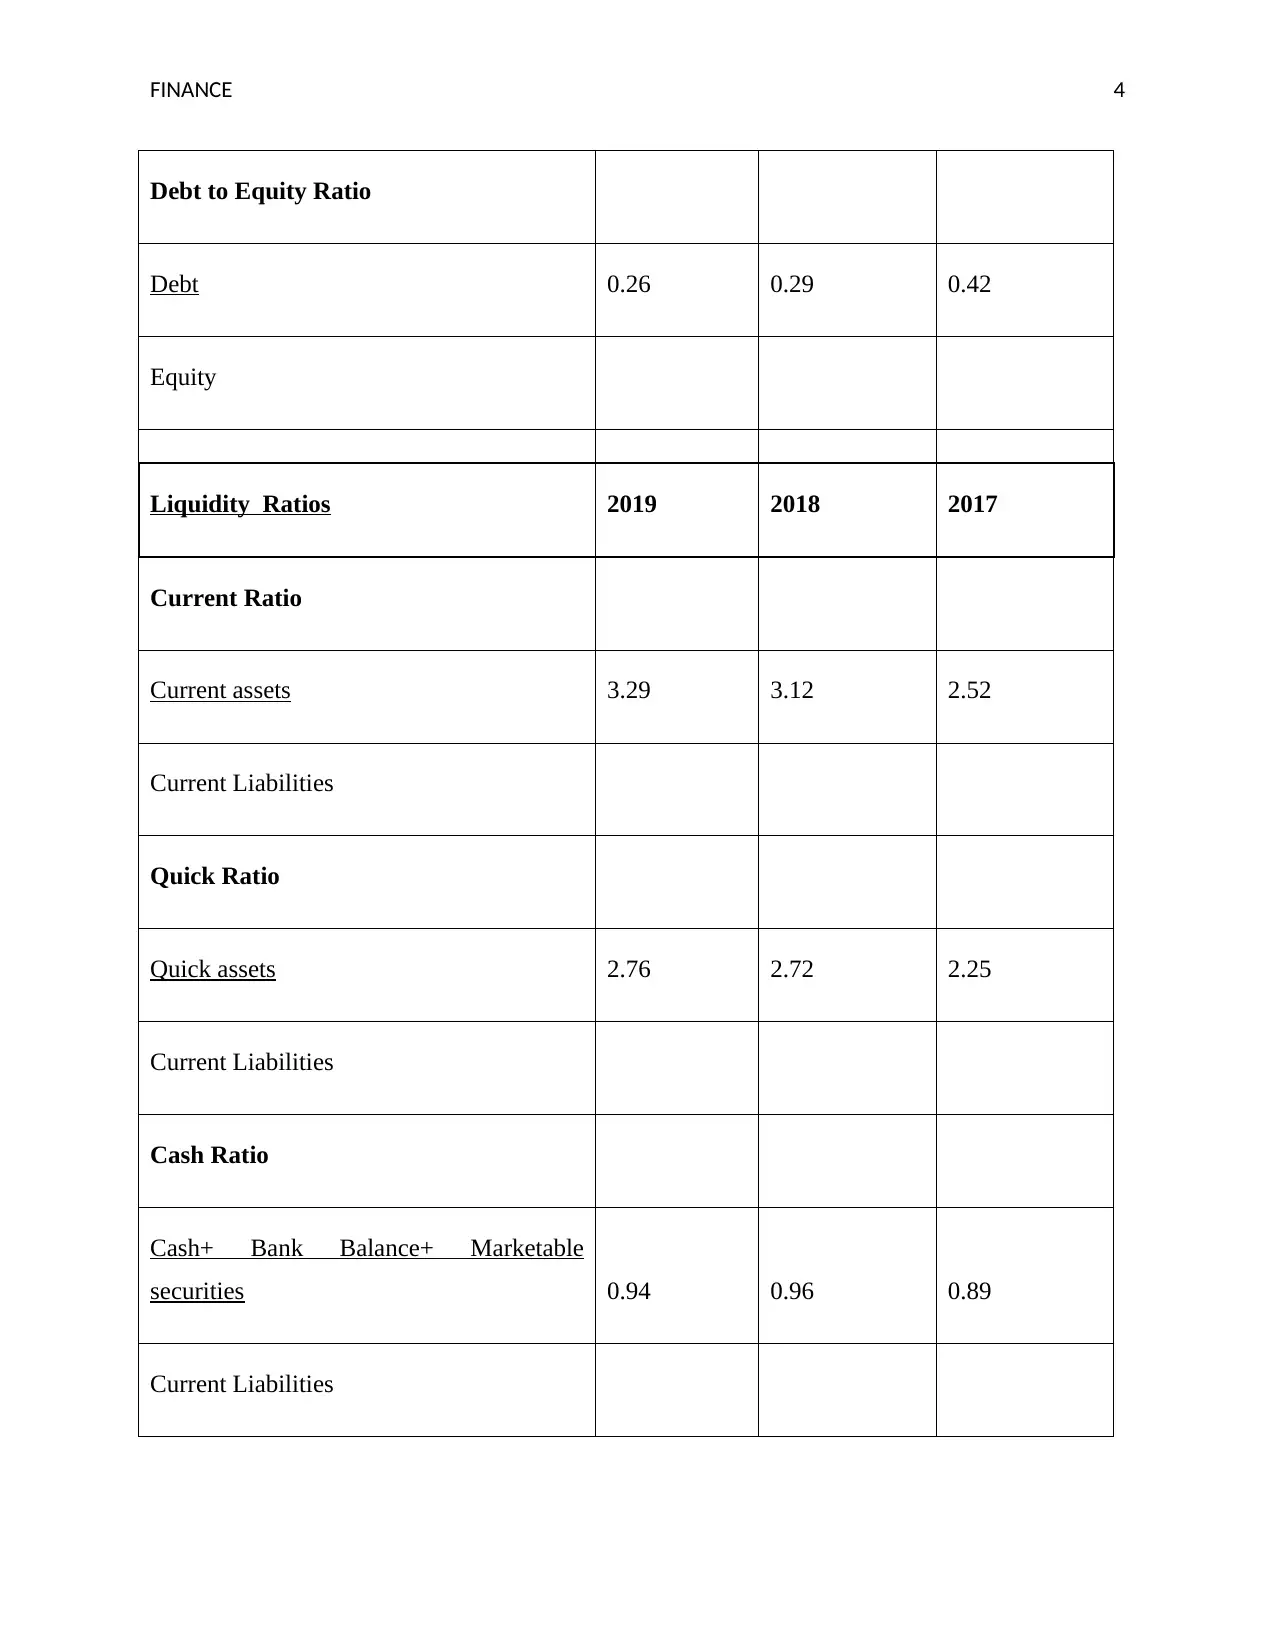
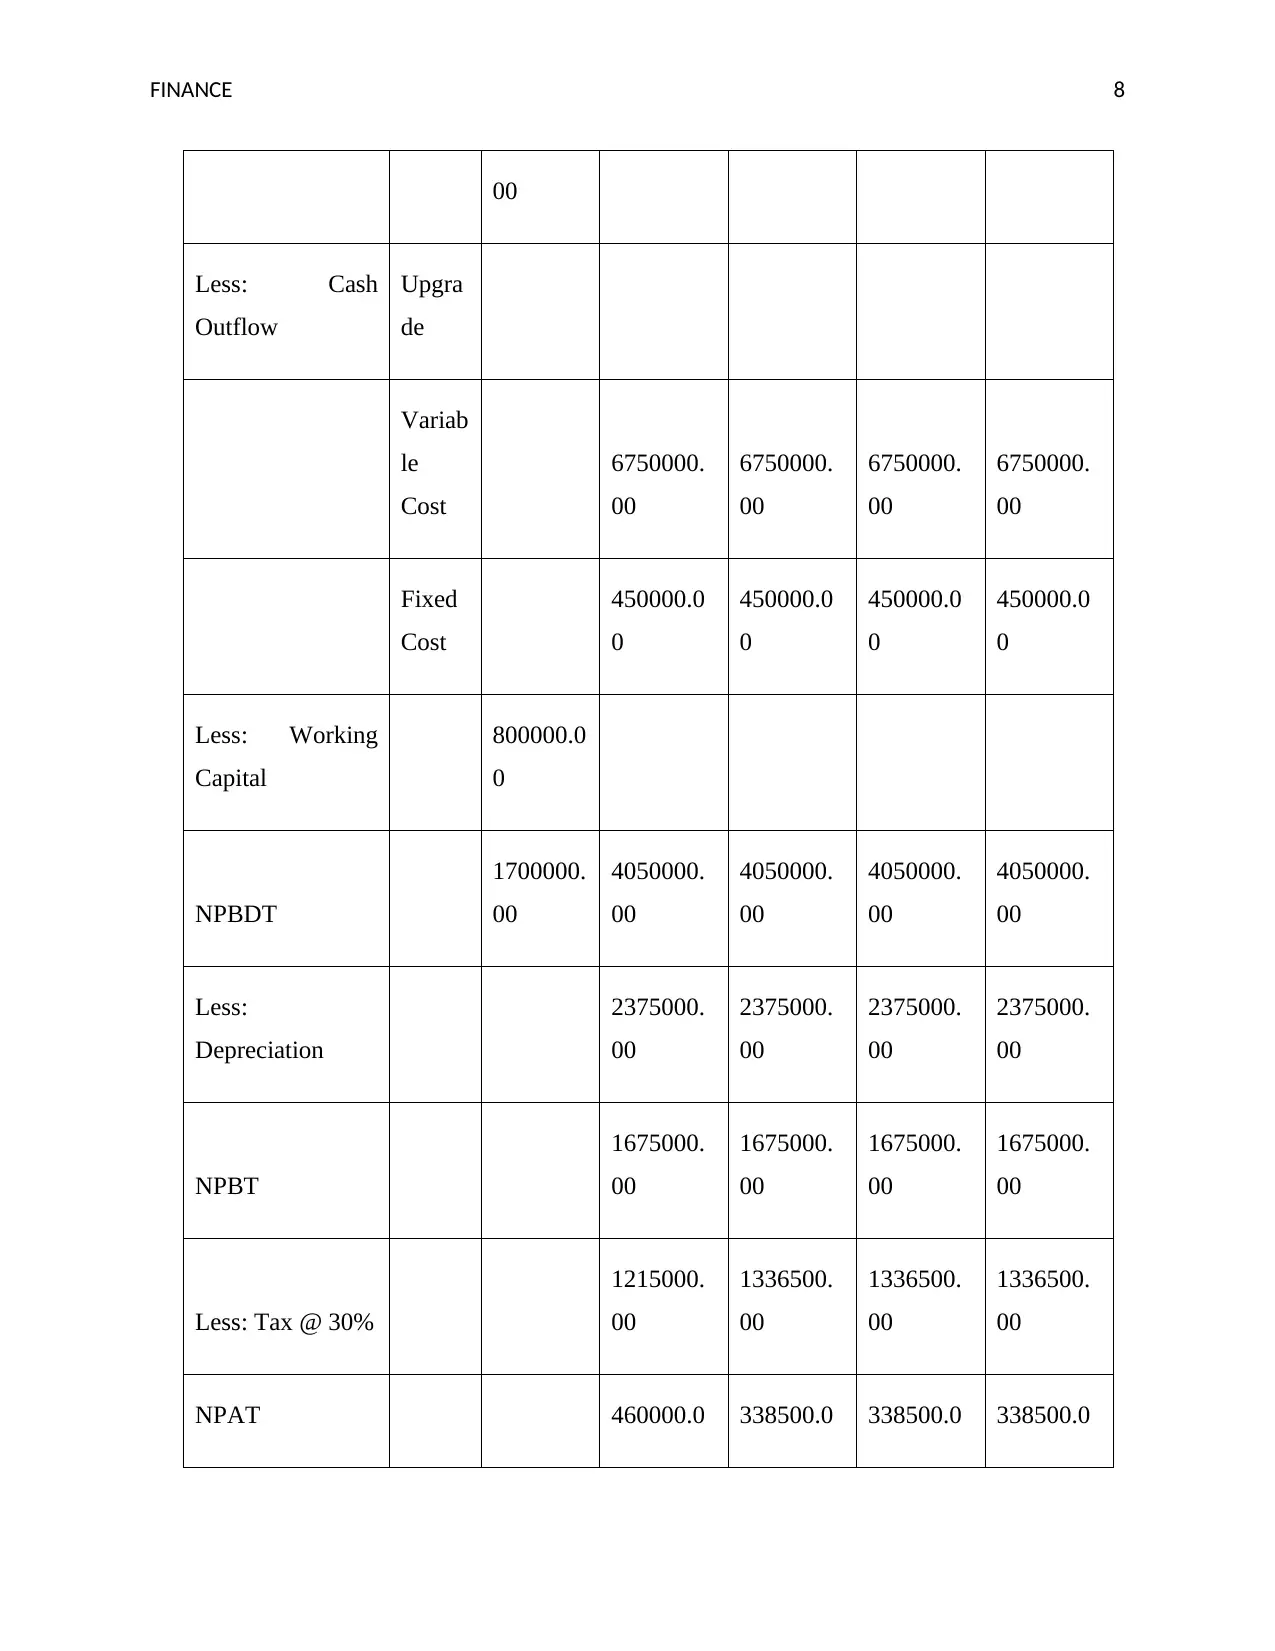
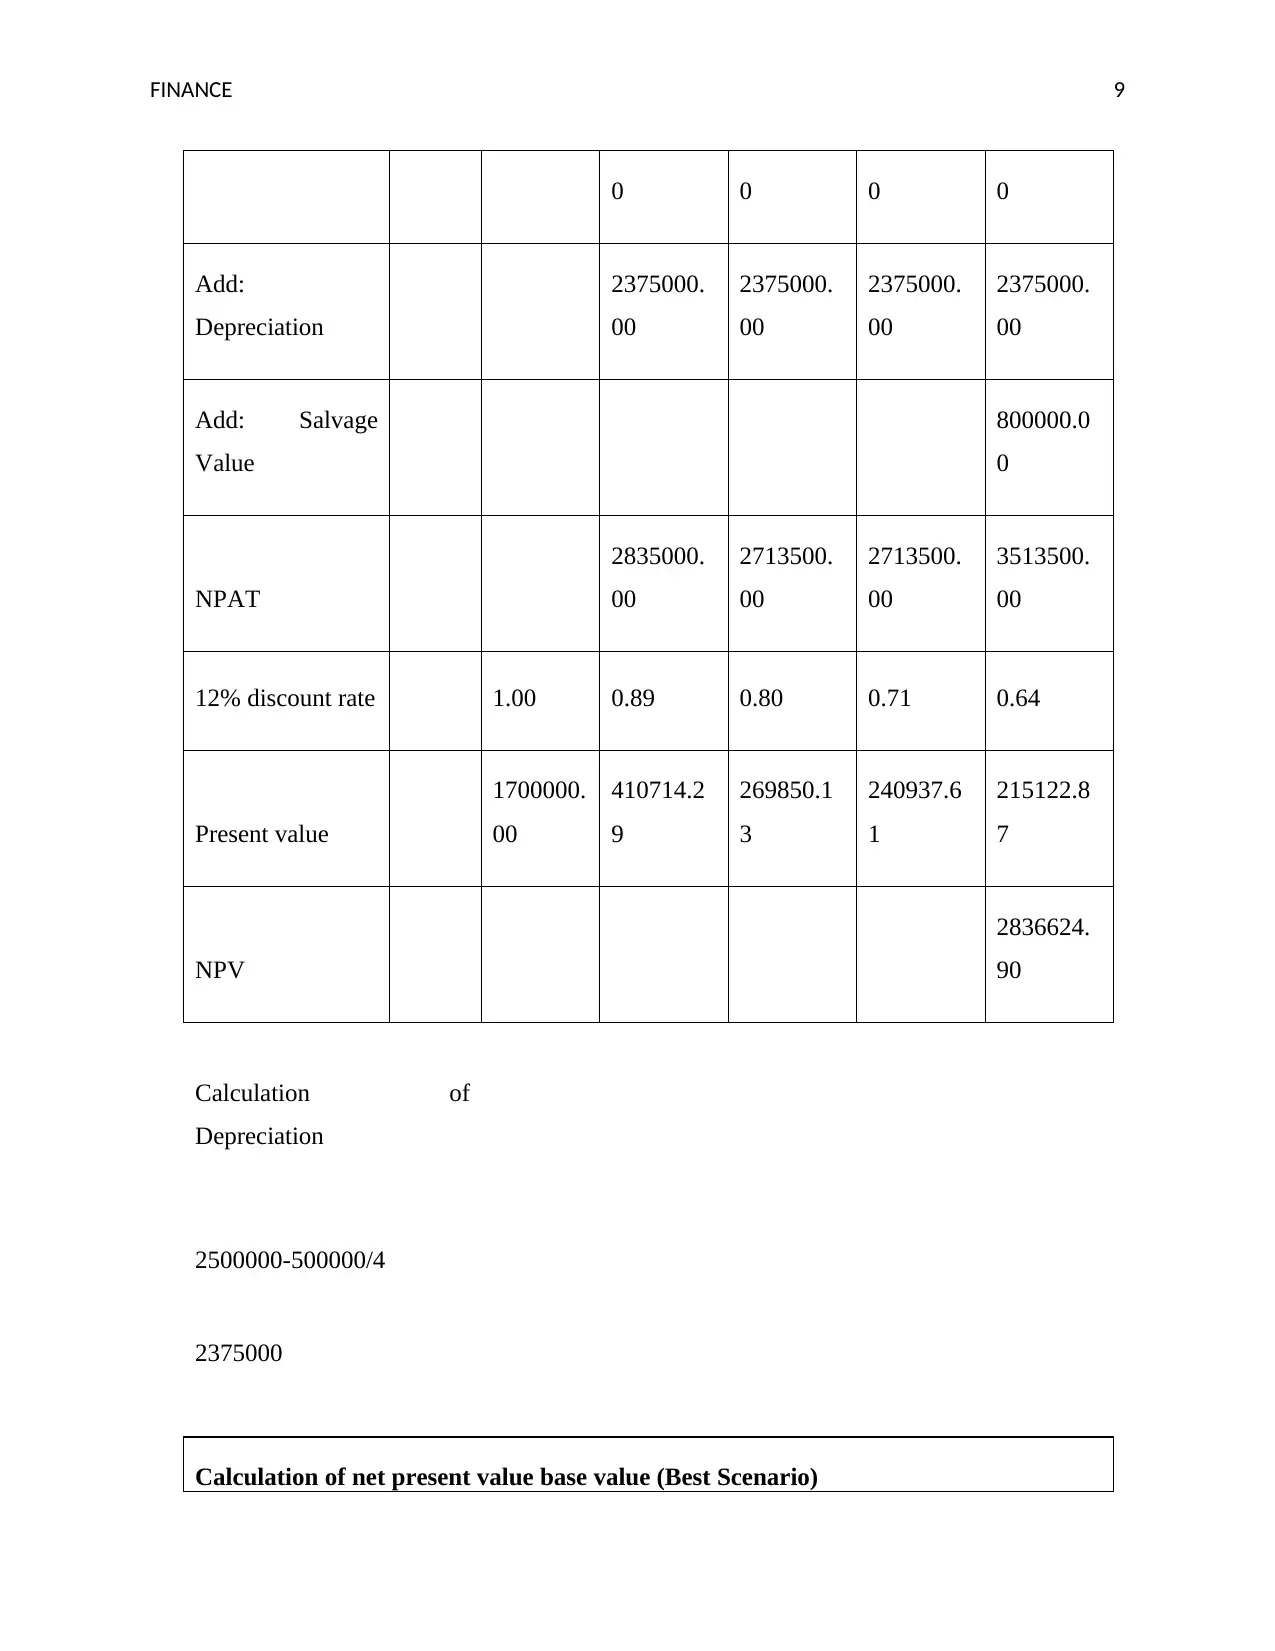
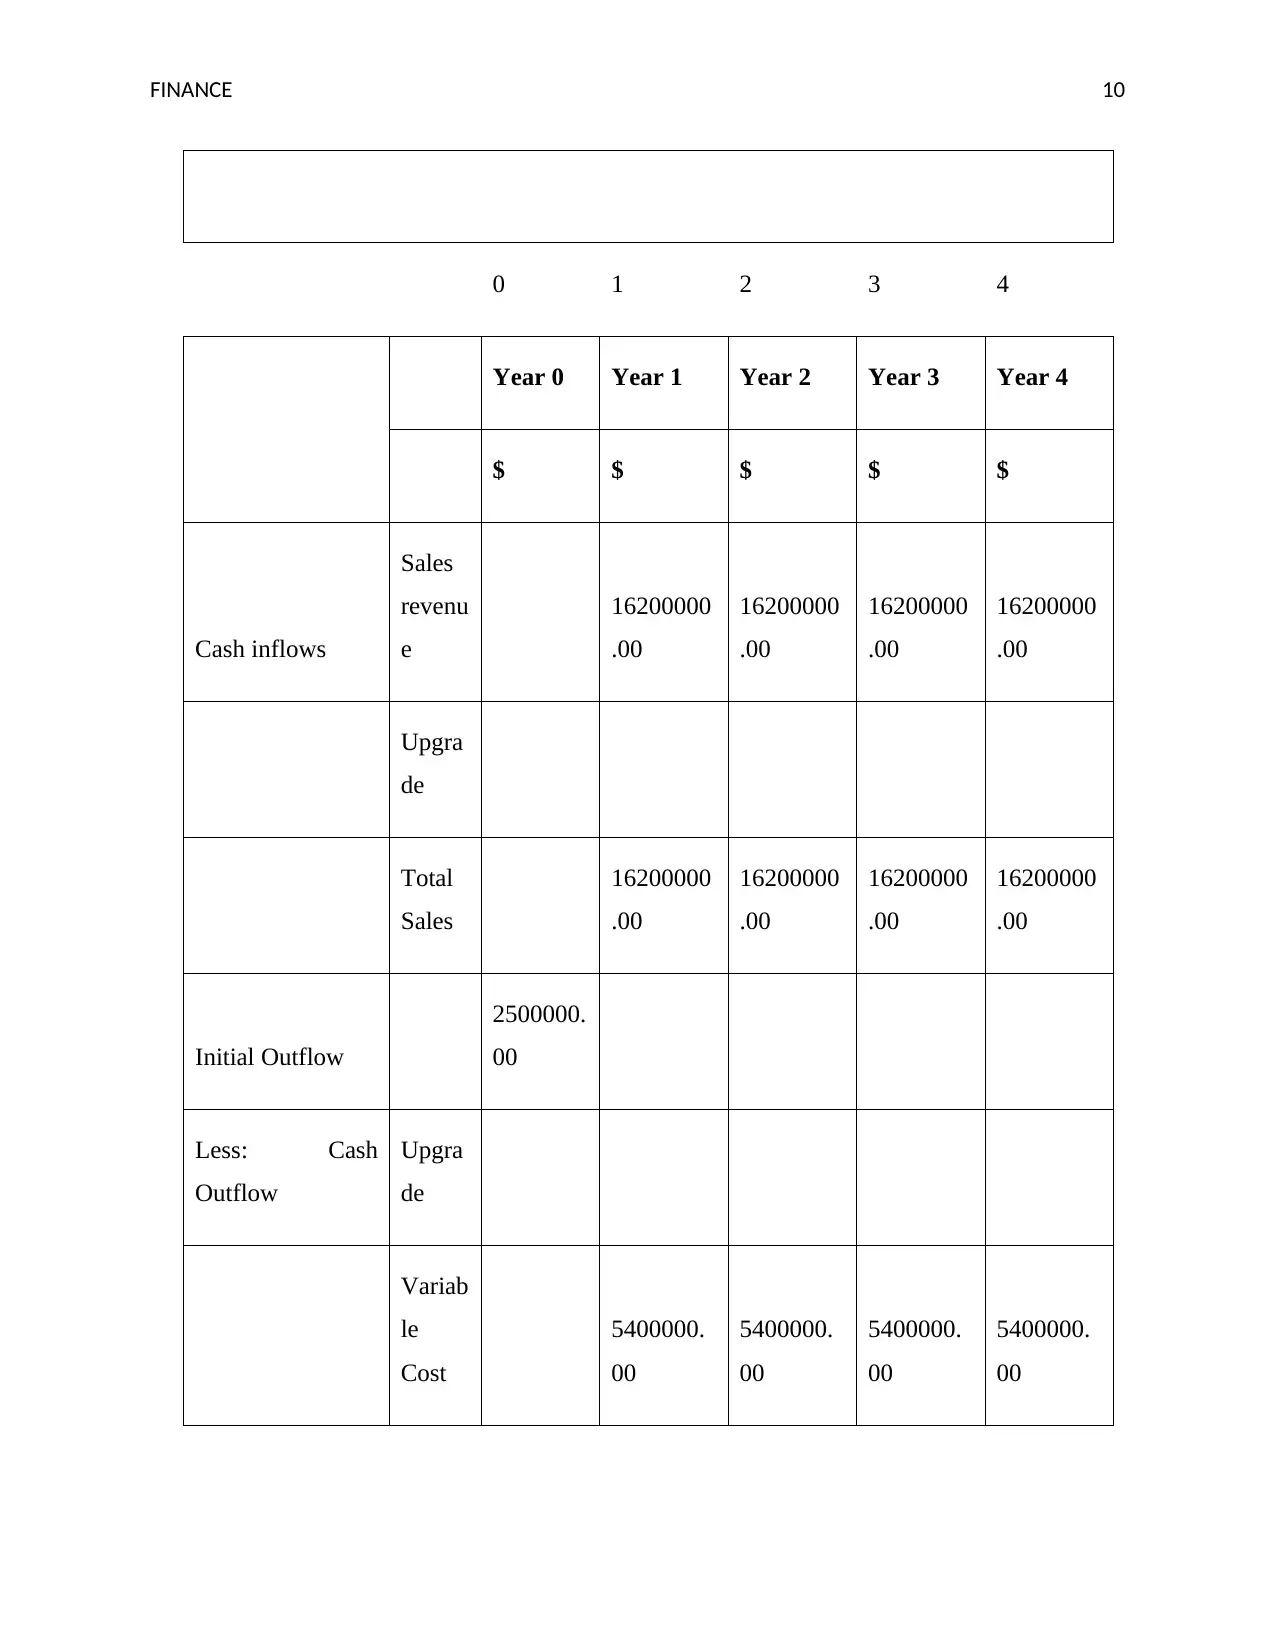
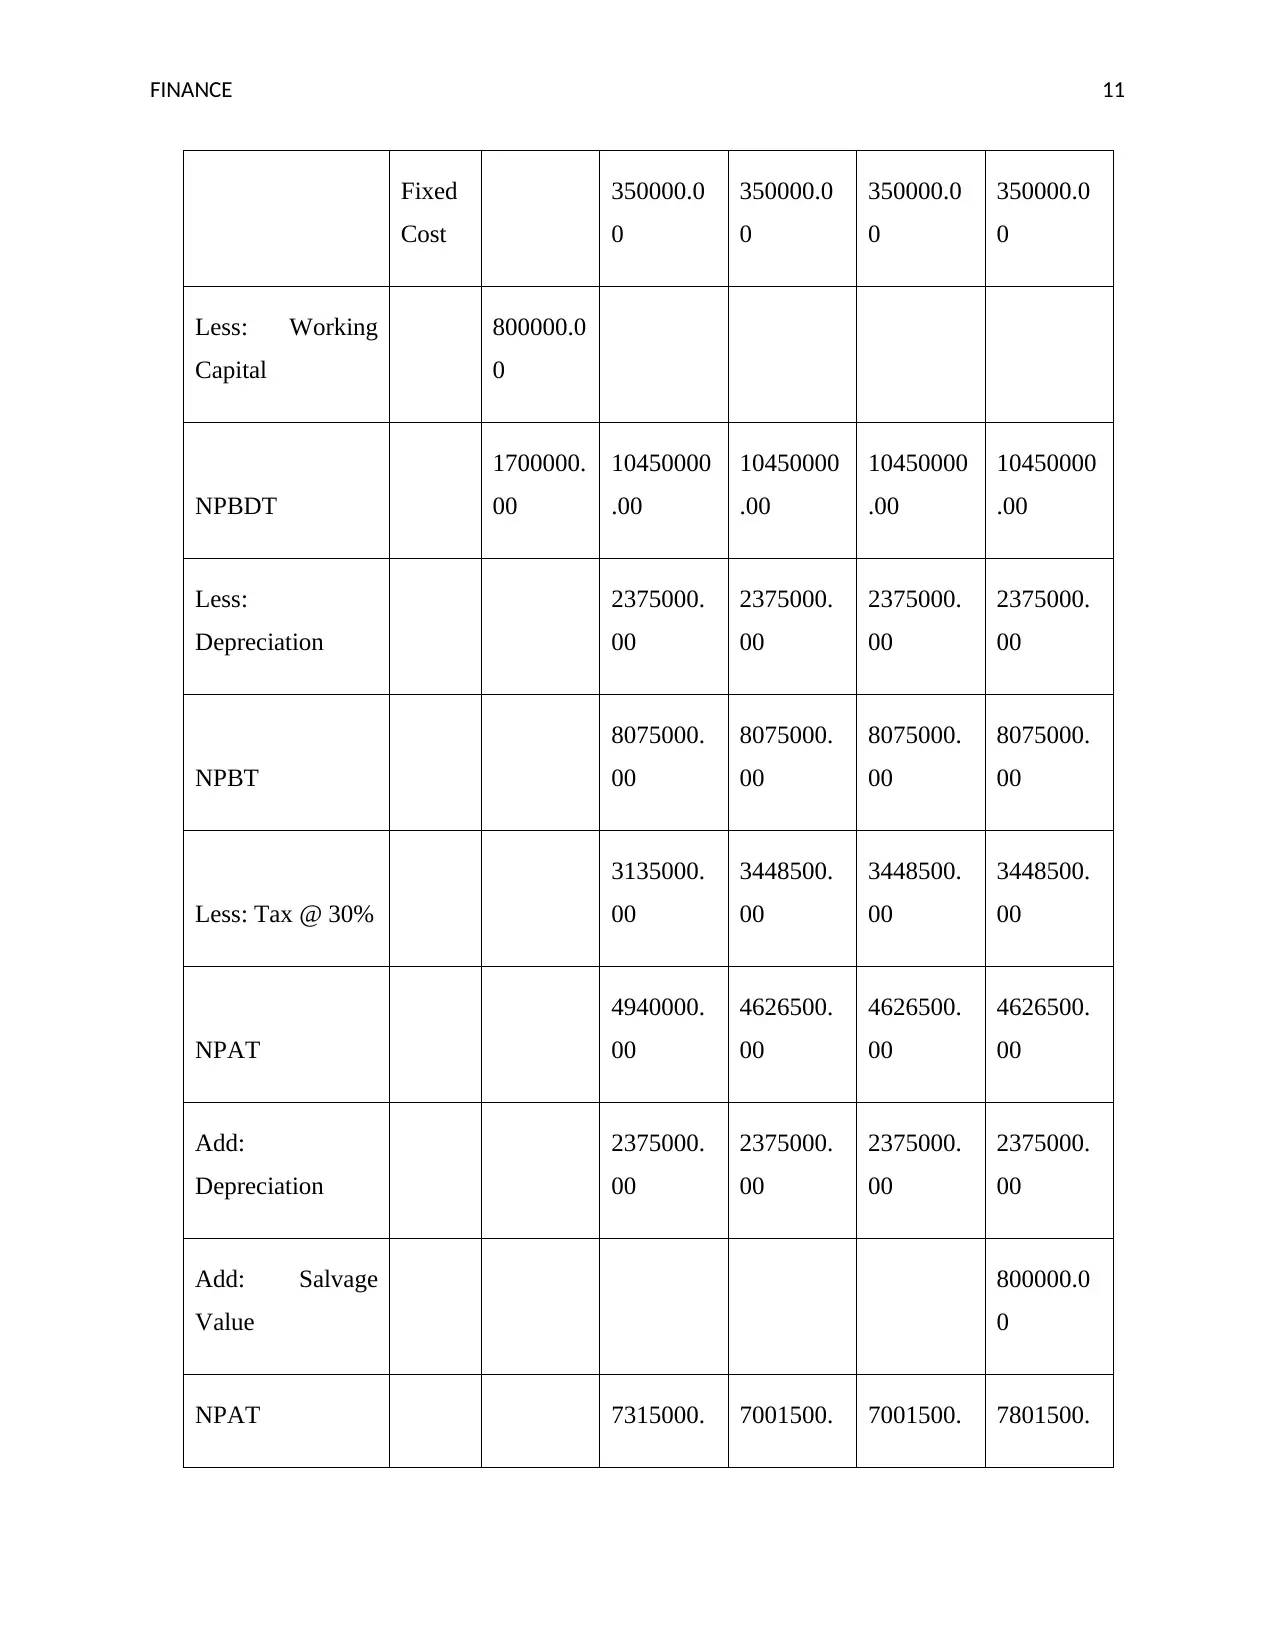
This report provides a detailed financial analysis of A2 Milk, examining its performance from 2017 to 2019. It includes an overview of the company's background, focusing on its competitive advantage in the dairy market. The report analyzes A2 Milk's financial performance through various ratios, including capital structure and liquidity ratios, and assesses its non-current assets. Furthermore, it calculates the Net Present Value (NPV) under different scenarios and discusses the latest share and bond issues. The report also explores share price movements, presents recommendations, and concludes with a summary of the findings. The analysis aims to evaluate A2 Milk's growth, challenges, and opportunities in the market, providing insights into its financial health and potential for future success. The report also includes calculations for depreciation and analyzes the impact of different scenarios on NPV.

Running Head: FINANCE 0
Finance
(Student Name)
Finance
(Student Name)
Paraphrase This Document
Need a fresh take? Get an instant paraphrase of this document with our AI Paraphraser

FINANCE 1
Table of Contents
Introduction......................................................................................................................................2
Financial Analysis of A2 Milk........................................................................................................2
Analysis of A2 Performance through Ratios...............................................................................3
Non- Current Asset Analysis.......................................................................................................4
Calculation of NPV......................................................................................................................5
Latest Shares and Bonds Issue by A2 Company..........................................................................8
PE Ratio....................................................................................................................................9
Share Price Movement.............................................................................................................9
Recommendations..........................................................................................................................11
Conclusion.....................................................................................................................................11
References......................................................................................................................................12

FINANCE 2
Background of the Company
A2 Milk is one of the foremost companies in the international marker. It is considered as the fast
growing consumer group organization that offers product related to the milk which is available to
Australian as well as New Zealand nation. The company as established in the year 2003 as well
as has settled to shape a share market for fair finished 3.5% (Pal et al., 2015). The main
competitive advantage of the company is it delivers pure dairy mark that is fully natural as well
as addictive free. A2 Milk Company of Australia is one of the main creators of A2 milk,
newborn method as well as other dairy products that is supplied in the local with the international
market. The company has headquartered in Sydney, Australia. A2 Milk Company is the heir of
A2 Corporation Limited. The main focus of the organization was on the breeding program of
dairy program for the development of herds that will be producing for A2 Milk (A2 Milk, 2019).
Purpose
The main purpose of this assignment is to analyze the overall performance of the company and
its growth and challenges that is faced by the organization. Furthermore, with the help of the
analysis it can be easily analyze the opportunities that are waiting for the organization and threats
that are included in the market to the certain extent.
Findings
In the following part there will be detailed analysis of the overall performance of A2 Milk in
which the profit or the revenue that is earning form the market will be analyze with the liabilities
that will required to pay by the organization will be analyzed in such report. With the help of
NPV, planning for the project can be analyzed in a proper manner with the issuance of share in
the market will be analyzed in the market.
Financial Analysis of A2 Milk
A2 milk is one of the companies that deliver product which is wholly related to the milk. A2
Milk is ironic in A2 Beta casein protein in which the revenues it’s one of very rare makes of milk
that is allowed of the A1 beta casein. The main corporate model of A2 Milk is to majorly
emphasis on the customer fronting goods with a target on the functional food market were a first-
⊘ This is a preview!⊘
Do you want full access?
Subscribe today to unlock all pages.

Trusted by 1+ million students worldwide

FINANCE 3
class can also be generated. The customers have been obtainable pure 100% A2 shaped milk that
has no jeopardy of wellbeing subjects; greater fascinated casein-protein as well as can assists
with the peptic happiness while partaking an obvious real milk taste. A2 milk is considered as
the premium as well as healthier product that aim in digestion as compared to rest of the milk
(Nystrom and Winston, 2016). In the year 2007, the selling of the A2 milk enhanced with the
great speed in Australia as well as New Zealand. It is the milk that is acquired from specific
breeds as well as varieties of cows which helped in producing the beta casein protein in their
milk with a protein at number 67. It contains more nutrients as comparison to the regular milk
due to the reason it compromise of nutrients including potassium, calcium, protein as well as
vitamin D (Esty and Fisher, 2019).
Analysis of A2 Performance through Ratios
Calculation of ratios Horizontal Analysis
Capital Structure Ratios 2019 2018 2017
Debt to Total Assets
Total debt 0.21 0.22 0.30
Total Assets
Proprietary Ratio
Proprietors Funds 0.79 0.78 0.67
Total Assets
Paraphrase This Document
Need a fresh take? Get an instant paraphrase of this document with our AI Paraphraser

FINANCE 4
Debt to Equity Ratio
Debt 0.26 0.29 0.42
Equity
Liquidity Ratios 2019 2018 2017
Current Ratio
Current assets 3.29 3.12 2.52
Current Liabilities
Quick Ratio
Quick assets 2.76 2.72 2.25
Current Liabilities
Cash Ratio
Cash+ Bank Balance+ Marketable
securities 0.94 0.96 0.89
Current Liabilities
Debt to Equity Ratio
Debt 0.26 0.29 0.42
Equity
Liquidity Ratios 2019 2018 2017
Current Ratio
Current assets 3.29 3.12 2.52
Current Liabilities
Quick Ratio
Quick assets 2.76 2.72 2.25
Current Liabilities
Cash Ratio
Cash+ Bank Balance+ Marketable
securities 0.94 0.96 0.89
Current Liabilities

FINANCE 5
In order to analyze the capital structure as well as liquidity of the company, it can be found that
the company grows efficiently from the year 2017 to 2019. the liquidity ratio of the company
represent that the assets of the organization increase every year by 2.52 to 3.29 that showcase
that the company do not highly rely on the loans and other debts to run the business. The quick
ratio represent that the company has sufficient amount that can be liquid quickly. The cash ratio
of the company represents. The cash ratio of the company shows that the company has low cash
in hand that can create an issue for the organization while they need the amount in urgency,. The
liabilities of the company is high than the liquid cash (ASX, 2019).
Moreover, in order to analyze the capital structure of the organization, it represent that the assets
of the company is higher than the debt at every situation. It is one of the positive aspects for the
company as they are not highly relying on the market for debt. The company has also not raise
the amount by issuing the shares that showcase that the earning of the business is advanced than
any other businesses to the certain extent. The debt to total-assets showcase that the debt of the
organization is low and the total assets of the company is high. Therefore, it can have the
probability for the organization to raise the funds to the certain extent. The proprietary ratio
showcase that the shareholder of the organization is low than its total assets that showcase that
the company has vacant assets that is required to be invested to raise the funds and earn
maximum revenue of the organization to the certain extent. Debt equity ratio represent that the
organization raise its funds majorly from equity rather than from debt which increase the sharing
of the profits to the certain extent.
Therefore, both ratios showcase that the company is growing from years to years and it less rely
on the debt and equity that make the company more strong other than competitive companies. It
makes the company more competitive in the market to the certain extent. The company has an
option to raise its funds through debt and can also issue the shares to raise the funds in an
effective as well as efficient manner.
Non- Current Asset Analysis
Non-Current Assets 2019 2018 2017
⊘ This is a preview!⊘
Do you want full access?
Subscribe today to unlock all pages.

Trusted by 1+ million students worldwide

FINANCE 6
Long Term Investment 286807 186862 62049
Property Plant & Equipment 10296 9701 8358
Goodwill 7957 10209 10041
Intangible Assets 4363 4080 2192
Other Assets 8348 5664 3002
Deferred Long-Term Assets 7683 4861 1954
Total Non-Current Assets 325454 221377 87596
Non-current assets are the assets other than current assets. Therefore, the non-current assets of
the company A2 Milk are increases and decreases to the certain extent. The long term investment
of the organization increases every year from 2017 to 2019. The property plant as well as
equipment of the company is also enhanced every year. However, the goodwill of the
organization decrease in the year 2019 while comparing to the goodwill in the 2018. It may
occur due to the certain reasons that may affect the overall performance of the company to the
certain extent. The intangible assets of the organization are also increases every year while
comparing it for the three years. It showcase that the company is growing in an effective and
efficient manner to the certain extent.
The depreciation method that is approved inA2 Milk while calculating the actual value of the
organization is straight line method. Such method is used by the organization every year that
make them ease to identify the actual value of its fixed assets to the certain extent.
Paraphrase This Document
Need a fresh take? Get an instant paraphrase of this document with our AI Paraphraser

FINANCE 7
The depreciation moves the cost of an asset to Depreciation Expense during the useful life of the
assets. The account that is involved in the recording the depreciation is known as depreciation
expense. In order to analyze the operating cash flow of the organization, the depreciation is not
mention in the cash flow due to the main reason; the company has adopted direct method in its
organization (Annual Report, 2019).
Calculation of NPV
Calculation of net present value base value
0 1 2 3 4
Year 0 Year 1 Year 2 Year 3 Year 4
Cash inflows
Sales
revenu
e
11250000
.00
11250000
.00
11250000
.00
11250000
.00
Upgra
de
Total
Sales
11250000
.00
11250000
.00
11250000
.00
11250000
.00
Initial Outflow 2500000.

FINANCE 8
00
Less: Cash
Outflow
Upgra
de
Variab
le
Cost
6750000.
00
6750000.
00
6750000.
00
6750000.
00
Fixed
Cost
450000.0
0
450000.0
0
450000.0
0
450000.0
0
Less: Working
Capital
800000.0
0
NPBDT
1700000.
00
4050000.
00
4050000.
00
4050000.
00
4050000.
00
Less:
Depreciation
2375000.
00
2375000.
00
2375000.
00
2375000.
00
NPBT
1675000.
00
1675000.
00
1675000.
00
1675000.
00
Less: Tax @ 30%
1215000.
00
1336500.
00
1336500.
00
1336500.
00
NPAT 460000.0 338500.0 338500.0 338500.0
00
Less: Cash
Outflow
Upgra
de
Variab
le
Cost
6750000.
00
6750000.
00
6750000.
00
6750000.
00
Fixed
Cost
450000.0
0
450000.0
0
450000.0
0
450000.0
0
Less: Working
Capital
800000.0
0
NPBDT
1700000.
00
4050000.
00
4050000.
00
4050000.
00
4050000.
00
Less:
Depreciation
2375000.
00
2375000.
00
2375000.
00
2375000.
00
NPBT
1675000.
00
1675000.
00
1675000.
00
1675000.
00
Less: Tax @ 30%
1215000.
00
1336500.
00
1336500.
00
1336500.
00
NPAT 460000.0 338500.0 338500.0 338500.0
⊘ This is a preview!⊘
Do you want full access?
Subscribe today to unlock all pages.

Trusted by 1+ million students worldwide

FINANCE 9
0 0 0 0
Add:
Depreciation
2375000.
00
2375000.
00
2375000.
00
2375000.
00
Add: Salvage
Value
800000.0
0
NPAT
2835000.
00
2713500.
00
2713500.
00
3513500.
00
12% discount rate 1.00 0.89 0.80 0.71 0.64
Present value
1700000.
00
410714.2
9
269850.1
3
240937.6
1
215122.8
7
NPV
2836624.
90
Calculation of
Depreciation
2500000-500000/4
2375000
Calculation of net present value base value (Best Scenario)
Paraphrase This Document
Need a fresh take? Get an instant paraphrase of this document with our AI Paraphraser

FINANCE 10
0 1 2 3 4
Year 0 Year 1 Year 2 Year 3 Year 4
$ $ $ $ $
Cash inflows
Sales
revenu
e
16200000
.00
16200000
.00
16200000
.00
16200000
.00
Upgra
de
Total
Sales
16200000
.00
16200000
.00
16200000
.00
16200000
.00
Initial Outflow
2500000.
00
Less: Cash
Outflow
Upgra
de
Variab
le
Cost
5400000.
00
5400000.
00
5400000.
00
5400000.
00

FINANCE 11
Fixed
Cost
350000.0
0
350000.0
0
350000.0
0
350000.0
0
Less: Working
Capital
800000.0
0
NPBDT
1700000.
00
10450000
.00
10450000
.00
10450000
.00
10450000
.00
Less:
Depreciation
2375000.
00
2375000.
00
2375000.
00
2375000.
00
NPBT
8075000.
00
8075000.
00
8075000.
00
8075000.
00
Less: Tax @ 30%
3135000.
00
3448500.
00
3448500.
00
3448500.
00
NPAT
4940000.
00
4626500.
00
4626500.
00
4626500.
00
Add:
Depreciation
2375000.
00
2375000.
00
2375000.
00
2375000.
00
Add: Salvage
Value
800000.0
0
NPAT 7315000. 7001500. 7001500. 7801500.
⊘ This is a preview!⊘
Do you want full access?
Subscribe today to unlock all pages.

Trusted by 1+ million students worldwide
1 out of 23
Related Documents

Your All-in-One AI-Powered Toolkit for Academic Success.
 +13062052269
info@desklib.com
Available 24*7 on WhatsApp / Email
Unlock your academic potential
Copyright © 2020–2025 A2Z Services. All Rights Reserved. Developed and managed by ZUCOL.