Financial Performance Analysis: A2 Milk Company's Share and Bonds

Verified

Added on  2022/11/04

|4
|704
|177
Report
AI Summary
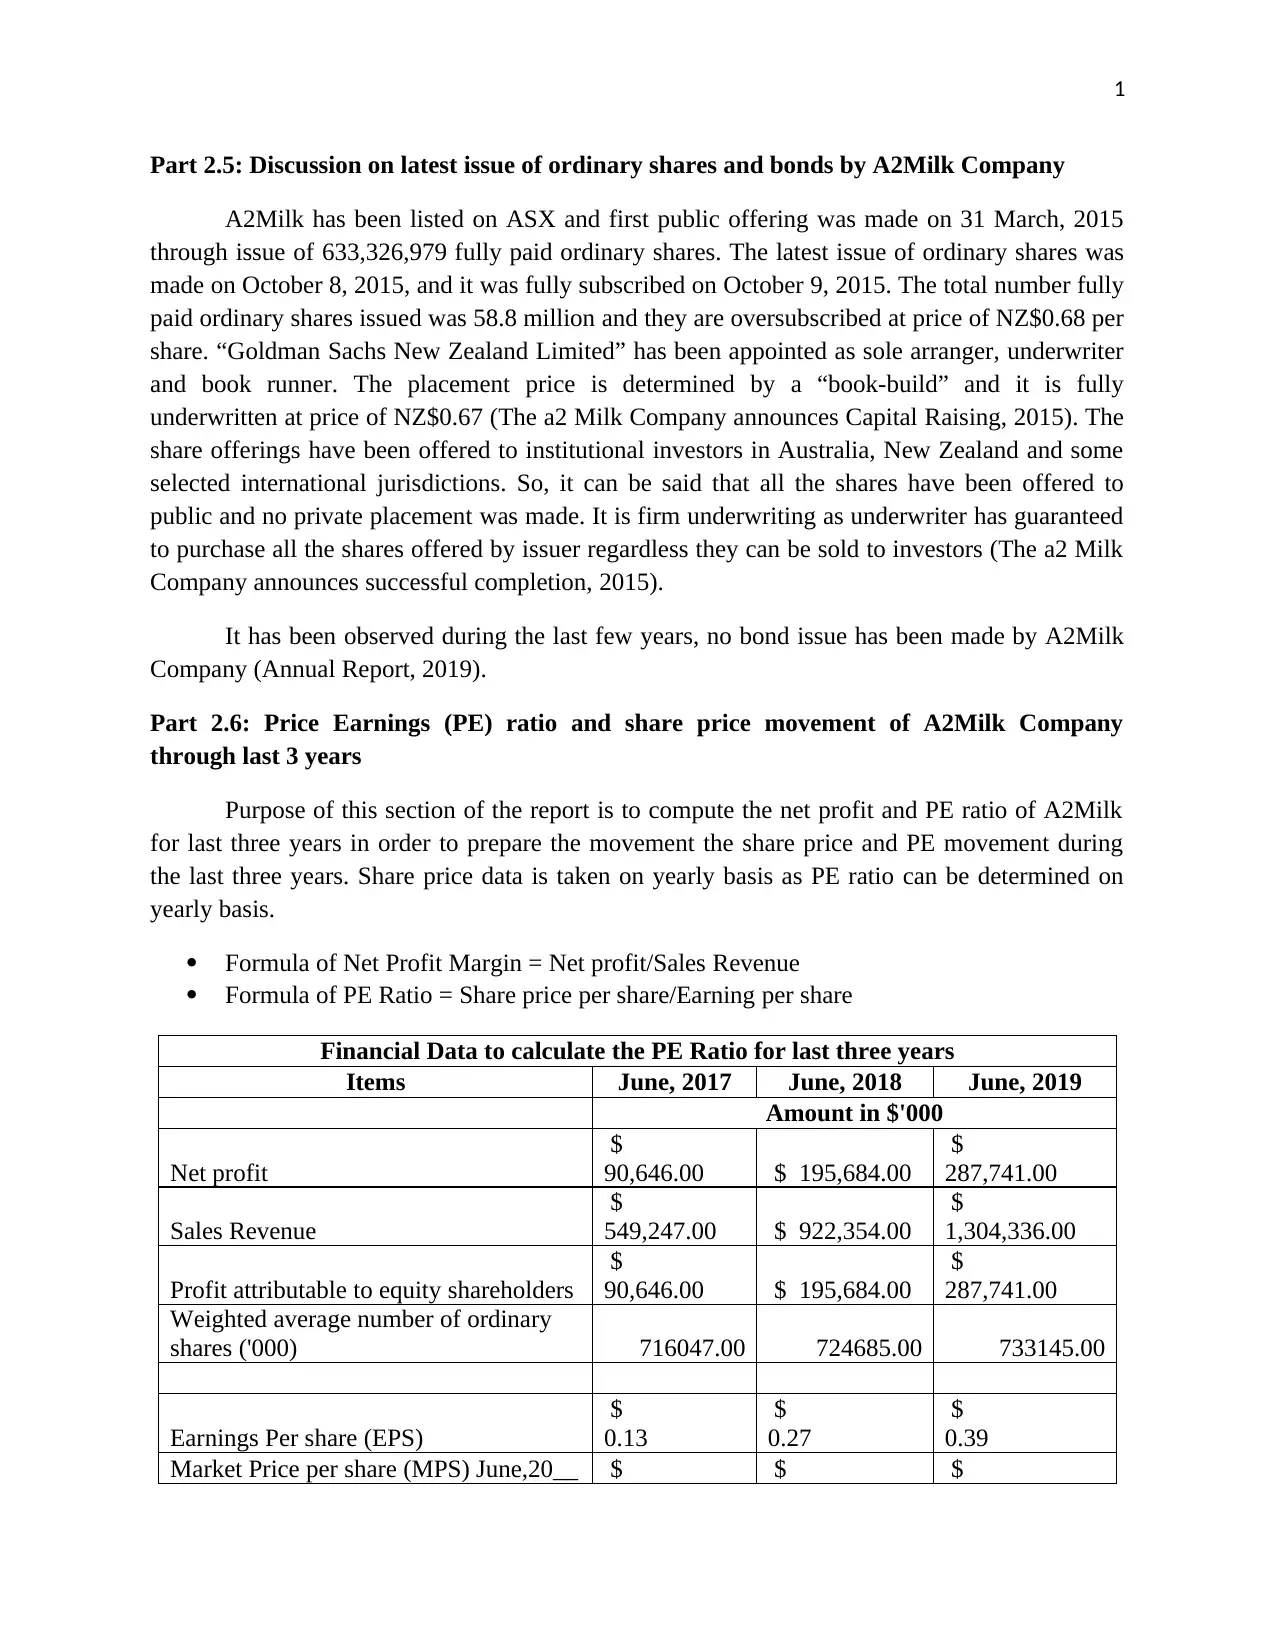
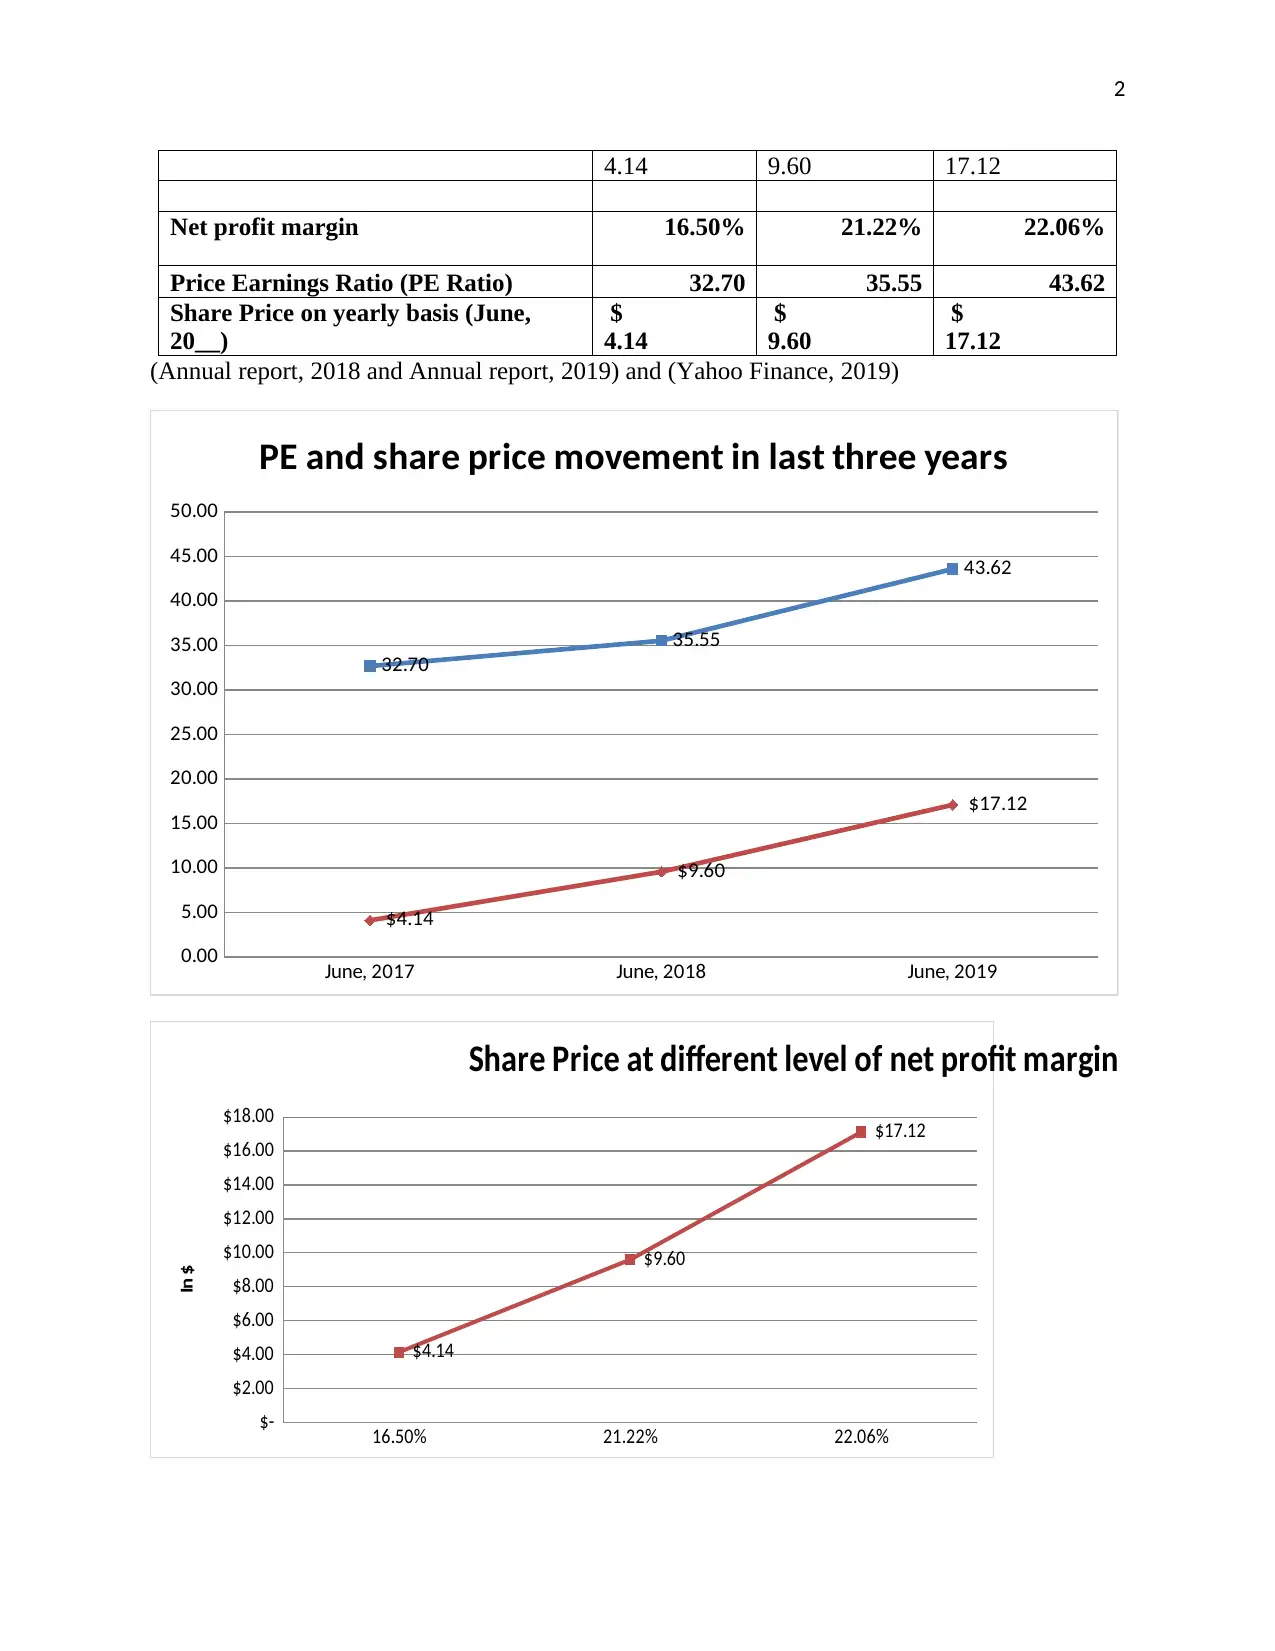
This report analyzes the financial performance of A2 Milk Company, focusing on its share price movements and Price-Earnings (PE) ratio over a three-year period (2017-2019). The report begins with a discussion of the company's latest issue of ordinary shares and bond activities, highlighting key details such as the initial public offering, subsequent share offerings, and the role of underwriters. The analysis then shifts to the company's financial data, including net profit, sales revenue, and earnings per share, to calculate and interpret the PE ratio. The report examines the relationship between share price and net profit, revealing a convergence trend where the share price increased in line with the rise in net profit. The report uses financial data from the annual reports and Yahoo Finance to support its findings and conclusions.
tabler-icon-diamond-filled.svg

Contribute Materials

Your contribution can guide someone’s learning journey. Share your documents today.
Document Page
1
Part 2.5: Discussion on latest issue of ordinary shares and bonds by A2Milk Company
A2Milk has been listed on ASX and first public offering was made on 31 March, 2015
through issue of 633,326,979 fully paid ordinary shares. The latest issue of ordinary shares was
made on October 8, 2015, and it was fully subscribed on October 9, 2015. The total number fully
paid ordinary shares issued was 58.8 million and they are oversubscribed at price of NZ$0.68 per
share. “Goldman Sachs New Zealand Limited” has been appointed as sole arranger, underwriter
and book runner. The placement price is determined by a “book-build” and it is fully
underwritten at price of NZ$0.67 (The a2 Milk Company announces Capital Raising, 2015). The
share offerings have been offered to institutional investors in Australia, New Zealand and some
selected international jurisdictions. So, it can be said that all the shares have been offered to
public and no private placement was made. It is firm underwriting as underwriter has guaranteed
to purchase all the shares offered by issuer regardless they can be sold to investors (The a2 Milk
Company announces successful completion, 2015).
It has been observed during the last few years, no bond issue has been made by A2Milk
Company (Annual Report, 2019).
Part 2.6: Price Earnings (PE) ratio and share price movement of A2Milk Company
through last 3 years
Purpose of this section of the report is to compute the net profit and PE ratio of A2Milk
for last three years in order to prepare the movement the share price and PE movement during
the last three years. Share price data is taken on yearly basis as PE ratio can be determined on
yearly basis.
Formula of Net Profit Margin = Net profit/Sales Revenue
Formula of PE Ratio = Share price per share/Earning per share
Financial Data to calculate the PE Ratio for last three years
Items June, 2017 June, 2018 June, 2019
Amount in $'000
Net profit
$
90,646.00 $ 195,684.00
$
287,741.00
Sales Revenue
$
549,247.00 $ 922,354.00
$
1,304,336.00
Profit attributable to equity shareholders
$
90,646.00 $ 195,684.00
$
287,741.00
Weighted average number of ordinary
shares ('000) 716047.00 724685.00 733145.00
Earnings Per share (EPS)
$
0.13
$
0.27
$
0.39
Market Price per share (MPS) June,20__ $ $ $
tabler-icon-diamond-filled.svg

Secure Best Marks with AI Grader

Need help grading? Try our AI Grader for instant feedback on your assignments.
Document Page
2
4.14 9.60 17.12
Net profit margin 16.50% 21.22% 22.06%
Price Earnings Ratio (PE Ratio) 32.70 35.55 43.62
Share Price on yearly basis (June,
20__)
$
4.14
$
9.60
$
17.12
(Annual report, 2018 and Annual report, 2019) and (Yahoo Finance, 2019)
June, 2017 June, 2018 June, 2019
0.00
5.00
10.00
15.00
20.00
25.00
30.00
35.00
40.00
45.00
50.00
32.70
35.55
43.62
$4.14
$9.60
$17.12
PE and share price movement in last three years
16.50% 21.22% 22.06%
$-
$2.00
$4.00
$6.00
$8.00
$10.00
$12.00
$14.00
$16.00
$18.00
$4.14
$9.60
$17.12
Share Price at different level of net profit margin
In $
Document Page
3
Looking at the trend of share price with respect to net profit during the last three years it
can be said that there was convergence between share price and net profit of the company. As per
past research there was no divergence between share price and net profit of the company because
share price increased with increase of net profit.
Document Page
4
References
Annual report. 2018. A2Milk Company. [Online]. Available at:
https://thea2milkcompany.com/wp-content/uploads/A2M-Annual-Report-FY18.pdf [Accessed
on: 25 September, 2019].
Annual report. 2019. A2Milk Company. [Online]. Available at:
https://thea2milkcompany.com/wp-content/uploads/The-a2-Milk-Company_FY19-Annual-
Report_double-pages-1.pdf [Accessed on: 25 September, 2019].
The a2 Milk Company announces Capital Raising. 2015. [Online]. Available at:
http://www.aspecthuntley.com.au.ezproxy.scu.edu.au/asxdata/20151008/pdf/01669860.pdf
[Accessed on: 25 September, 2019].
The a2 Milk Company announces successful completion. 2015. [Online]. Available at:
http://www.aspecthuntley.com.au.ezproxy.scu.edu.au/asxdata/20151009/pdf/01670261.pdf
[Accessed on: 25 September, 2019].
Yahoo Finance. 2019. A2Milk Company. [Online]. Available at:
https://finance.yahoo.com/quote/A2M.AX/history?
period1=1411497000&period2=1569263400&interval=1mo&filter=history&frequency=1mo
[Accessed on: 25 September, 2019].
chevron_up_icon
1 out of 4
circle_padding
hide_on_mobile
zoom_out_icon
logo.png

Your All-in-One AI-Powered Toolkit for Academic Success.

Available 24*7 on WhatsApp / Email

[object Object]