Financial Markets and Portfolio Management AAF0406: An Analysis
VerifiedAdded on 2023/06/14
|13
|3362
|275
Report
AI Summary
This report provides an analysis of financial markets and portfolio management, focusing on the return, variance, standard deviation, semi-deviation, kurtosis, and skewness of stocks from companies like Unilever, Shell, HSBC, and AstraZeneca. It includes a VAR (Value at Risk) analysis at different confidence levels and examines the covariance and correlation between the stocks. Furthermore, the report evaluates the beta values of each company to assess their potential return on investment, concluding with an investor-centric perspective on the attractiveness of each company based on these financial metrics. Desklib offers a wealth of similar solved assignments and past papers for students seeking to deepen their understanding of finance.
Financial Markets and
Portfolio Management
AAF0406
1
Portfolio Management
AAF0406
1
Paraphrase This Document
Need a fresh take? Get an instant paraphrase of this document with our AI Paraphraser
INTRODUCTION...........................................................................................................................3
MAIN BODY...................................................................................................................................3
Section 1.......................................................................................................................................3
Section 2.......................................................................................................................................8
CONCLUSION................................................................................................................................9
REFERENCES..............................................................................................................................10
2
INTRODUCTION
Portfolio management is defined as managing the different aspects related to portfolio
investment such as risk, return and all other. This project will discuss different elements
associated with the portfolio management process.
MAIN BODY
Section 1
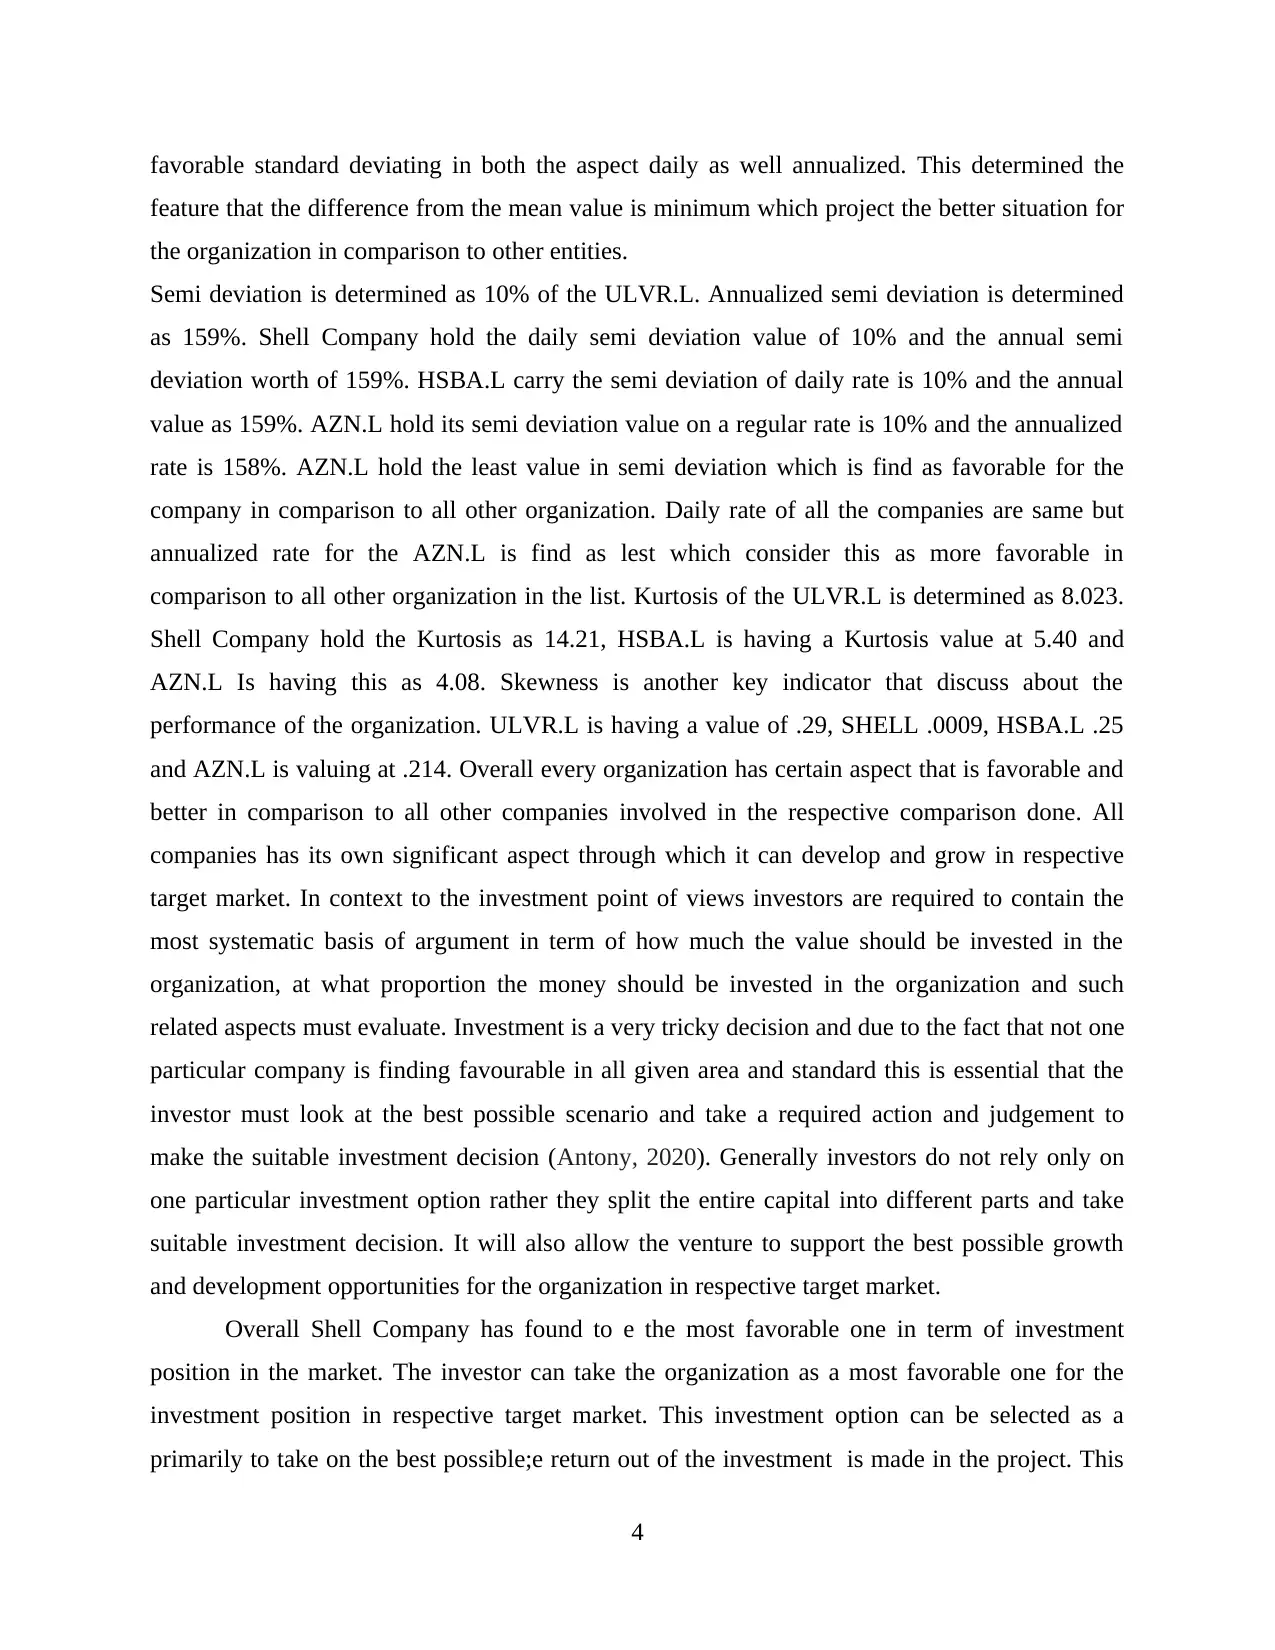
Return (Daily and Annualized): This statistical calculation state the daily and annualized return
of four different stocks or companies such as Unilever, Shell plc, HSBC holding and
AstraZeneca plc. The return of each stock is computed from its adjusted closing price with
the formula current day price – previous day price / previous day price *100. The annualized
return of each stock is computed using formula daily return * (1+R) ^ (252). After analysing
each stocks return, it is identified that the daily and annualized returns of all four socks
basically fluctuated (i.e., goes up and down) on day to day or year to year basis. The positive
return means appreciation in stock price while a negative return state decrease in stock price.
Variance daily and annualized
ULVR.L hold an annualized return of 1.4% and annualized variance is identify as
22.27%. Shell Company hols a daily variable identify as 2.4% and also the annualized rate is
determined as 38.17%. HSBA.L determined first daily return as 1.83% and the annualized return
is 29.07%. AZN.L could address the daily variable as 1.66% and annualized one as 26.28%.
SHELL Company is in the most convenient position in term of daily variance and the annualized
variance level of the organization. Company is having the best possible variance on a daily basis
and also annualized manner as well.
Standard deviation is determined of ULVR.L as 22.27%. Shell Company hold a daily
standard deviation value as 2.4% and the annualized standard deviation value determined as
38.17%. HSBA.L hold a standard deviation value on a daily basis as 1.83% and the annualized
standard deviation value of 29.07%. AZN.L hold it standard deviation on a daily level as 1.66%
and the annualized level as 26.28%. In comparison to other organization AZN.L hold the most
3
Portfolio management is defined as managing the different aspects related to portfolio
investment such as risk, return and all other. This project will discuss different elements
associated with the portfolio management process.
MAIN BODY
Section 1
Return (Daily and Annualized): This statistical calculation state the daily and annualized return
of four different stocks or companies such as Unilever, Shell plc, HSBC holding and
AstraZeneca plc. The return of each stock is computed from its adjusted closing price with
the formula current day price – previous day price / previous day price *100. The annualized
return of each stock is computed using formula daily return * (1+R) ^ (252). After analysing
each stocks return, it is identified that the daily and annualized returns of all four socks
basically fluctuated (i.e., goes up and down) on day to day or year to year basis. The positive
return means appreciation in stock price while a negative return state decrease in stock price.
Variance daily and annualized
ULVR.L hold an annualized return of 1.4% and annualized variance is identify as
22.27%. Shell Company hols a daily variable identify as 2.4% and also the annualized rate is
determined as 38.17%. HSBA.L determined first daily return as 1.83% and the annualized return
is 29.07%. AZN.L could address the daily variable as 1.66% and annualized one as 26.28%.
SHELL Company is in the most convenient position in term of daily variance and the annualized
variance level of the organization. Company is having the best possible variance on a daily basis
and also annualized manner as well.
Standard deviation is determined of ULVR.L as 22.27%. Shell Company hold a daily
standard deviation value as 2.4% and the annualized standard deviation value determined as
38.17%. HSBA.L hold a standard deviation value on a daily basis as 1.83% and the annualized
standard deviation value of 29.07%. AZN.L hold it standard deviation on a daily level as 1.66%
and the annualized level as 26.28%. In comparison to other organization AZN.L hold the most
3
⊘ This is a preview!⊘
Do you want full access?
Subscribe today to unlock all pages.
Trusted by 1+ million students worldwide
favorable standard deviating in both the aspect daily as well annualized. This determined the
feature that the difference from the mean value is minimum which project the better situation for
the organization in comparison to other entities.
Semi deviation is determined as 10% of the ULVR.L. Annualized semi deviation is determined
as 159%. Shell Company hold the daily semi deviation value of 10% and the annual semi
deviation worth of 159%. HSBA.L carry the semi deviation of daily rate is 10% and the annual
value as 159%. AZN.L hold its semi deviation value on a regular rate is 10% and the annualized
rate is 158%. AZN.L hold the least value in semi deviation which is find as favorable for the
company in comparison to all other organization. Daily rate of all the companies are same but
annualized rate for the AZN.L is find as lest which consider this as more favorable in
comparison to all other organization in the list. Kurtosis of the ULVR.L is determined as 8.023.
Shell Company hold the Kurtosis as 14.21, HSBA.L is having a Kurtosis value at 5.40 and
AZN.L Is having this as 4.08. Skewness is another key indicator that discuss about the
performance of the organization. ULVR.L is having a value of .29, SHELL .0009, HSBA.L .25
and AZN.L is valuing at .214. Overall every organization has certain aspect that is favorable and
better in comparison to all other companies involved in the respective comparison done. All
companies has its own significant aspect through which it can develop and grow in respective
target market. In context to the investment point of views investors are required to contain the
most systematic basis of argument in term of how much the value should be invested in the
organization, at what proportion the money should be invested in the organization and such
related aspects must evaluate. Investment is a very tricky decision and due to the fact that not one
particular company is finding favourable in all given area and standard this is essential that the
investor must look at the best possible scenario and take a required action and judgement to
make the suitable investment decision (Antony, 2020). Generally investors do not rely only on
one particular investment option rather they split the entire capital into different parts and take
suitable investment decision. It will also allow the venture to support the best possible growth
and development opportunities for the organization in respective target market.
Overall Shell Company has found to e the most favorable one in term of investment
position in the market. The investor can take the organization as a most favorable one for the
investment position in respective target market. This investment option can be selected as a
primarily to take on the best possible;e return out of the investment is made in the project. This
4
Paraphrase This Document
Need a fresh take? Get an instant paraphrase of this document with our AI Paraphraser
would further enhance to the overall return possibility of the investor. IN context to the
investment decision the company is selected that possibly offer the maximum possible return out
of investment is made in the project. Shell find it very favourable in all the possible areas to take
on the investment decision in business.
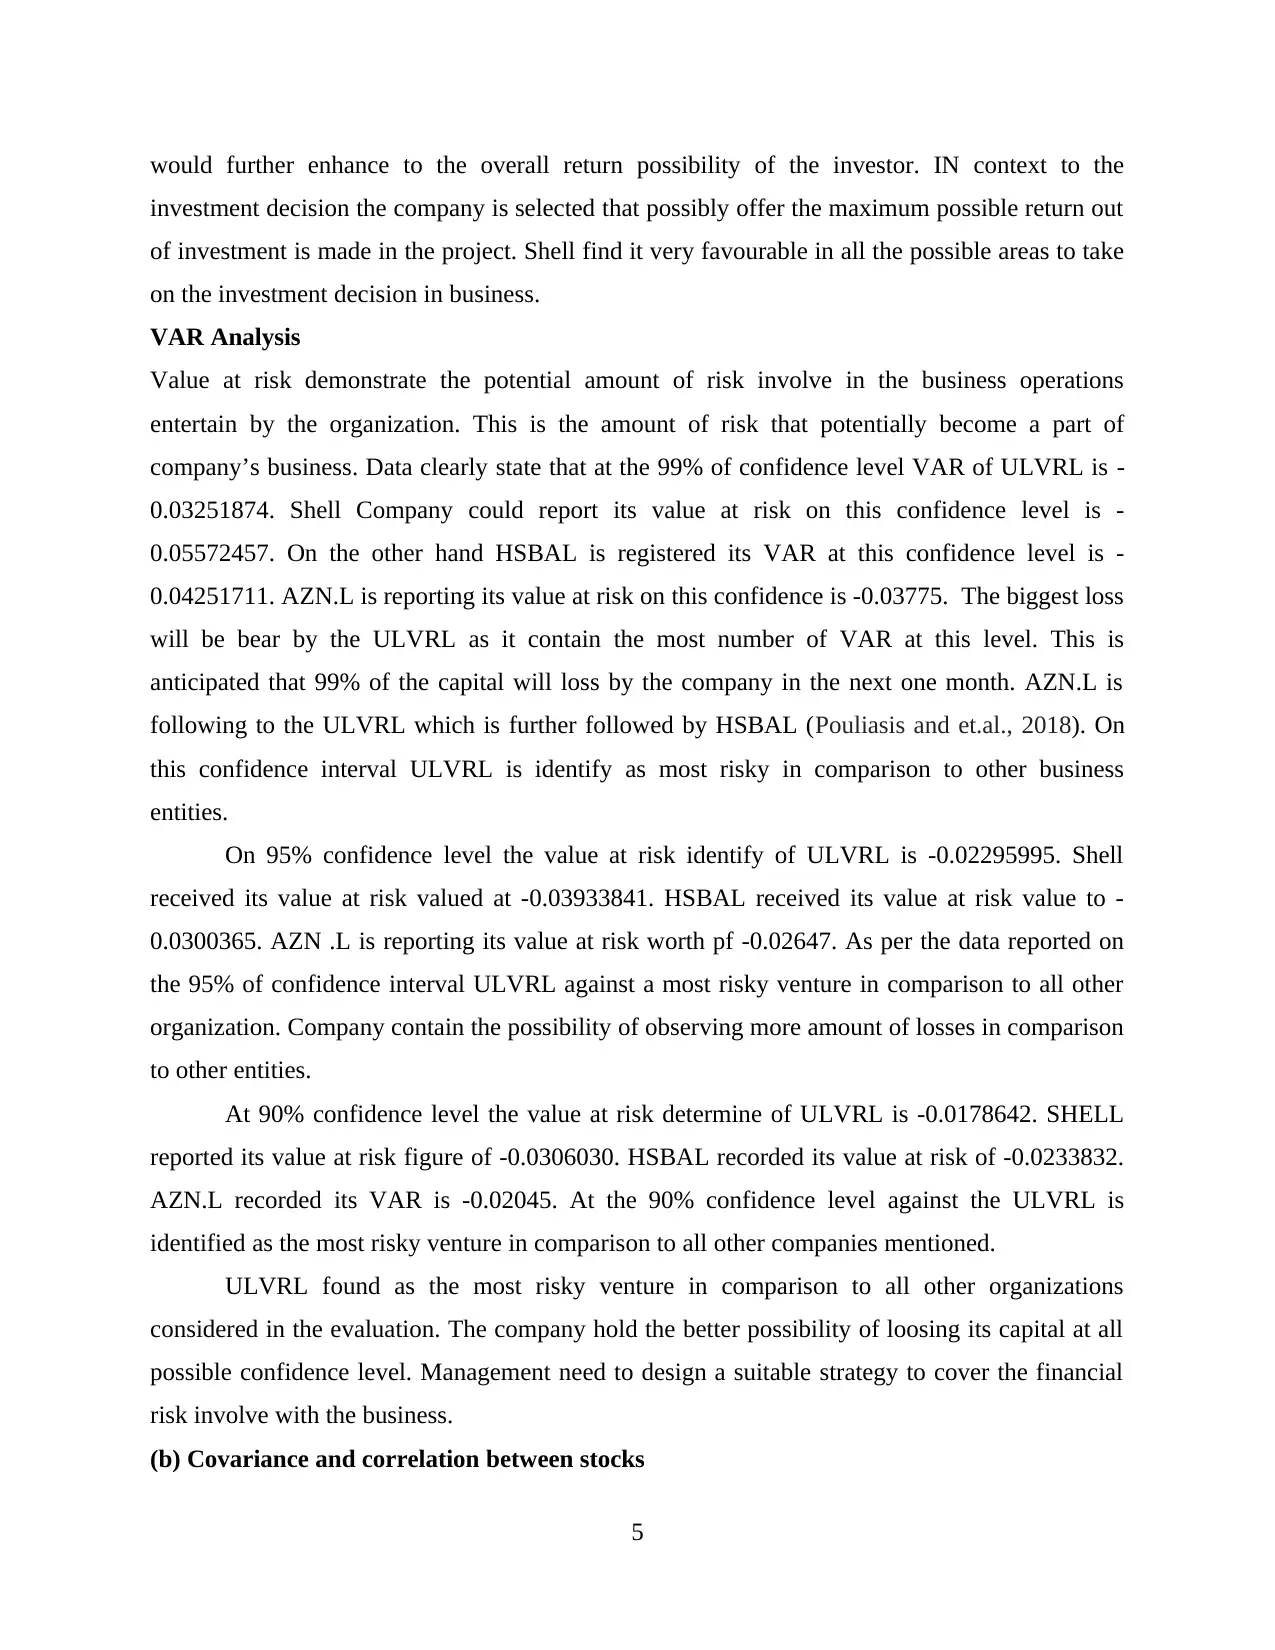
VAR Analysis
Value at risk demonstrate the potential amount of risk involve in the business operations
entertain by the organization. This is the amount of risk that potentially become a part of
company’s business. Data clearly state that at the 99% of confidence level VAR of ULVRL is -
0.03251874. Shell Company could report its value at risk on this confidence level is -
0.05572457. On the other hand HSBAL is registered its VAR at this confidence level is -
0.04251711. AZN.L is reporting its value at risk on this confidence is -0.03775. The biggest loss
will be bear by the ULVRL as it contain the most number of VAR at this level. This is
anticipated that 99% of the capital will loss by the company in the next one month. AZN.L is
following to the ULVRL which is further followed by HSBAL (Pouliasis and et.al., 2018). On
this confidence interval ULVRL is identify as most risky in comparison to other business
entities.
On 95% confidence level the value at risk identify of ULVRL is -0.02295995. Shell
received its value at risk valued at -0.03933841. HSBAL received its value at risk value to -
0.0300365. AZN .L is reporting its value at risk worth pf -0.02647. As per the data reported on
the 95% of confidence interval ULVRL against a most risky venture in comparison to all other
organization. Company contain the possibility of observing more amount of losses in comparison
to other entities.
At 90% confidence level the value at risk determine of ULVRL is -0.0178642. SHELL
reported its value at risk figure of -0.0306030. HSBAL recorded its value at risk of -0.0233832.
AZN.L recorded its VAR is -0.02045. At the 90% confidence level against the ULVRL is
identified as the most risky venture in comparison to all other companies mentioned.
ULVRL found as the most risky venture in comparison to all other organizations
considered in the evaluation. The company hold the better possibility of loosing its capital at all
possible confidence level. Management need to design a suitable strategy to cover the financial
risk involve with the business.
(b) Covariance and correlation between stocks
5
investment decision the company is selected that possibly offer the maximum possible return out
of investment is made in the project. Shell find it very favourable in all the possible areas to take
on the investment decision in business.
VAR Analysis
Value at risk demonstrate the potential amount of risk involve in the business operations
entertain by the organization. This is the amount of risk that potentially become a part of
company’s business. Data clearly state that at the 99% of confidence level VAR of ULVRL is -
0.03251874. Shell Company could report its value at risk on this confidence level is -
0.05572457. On the other hand HSBAL is registered its VAR at this confidence level is -
0.04251711. AZN.L is reporting its value at risk on this confidence is -0.03775. The biggest loss
will be bear by the ULVRL as it contain the most number of VAR at this level. This is
anticipated that 99% of the capital will loss by the company in the next one month. AZN.L is
following to the ULVRL which is further followed by HSBAL (Pouliasis and et.al., 2018). On
this confidence interval ULVRL is identify as most risky in comparison to other business
entities.
On 95% confidence level the value at risk identify of ULVRL is -0.02295995. Shell
received its value at risk valued at -0.03933841. HSBAL received its value at risk value to -
0.0300365. AZN .L is reporting its value at risk worth pf -0.02647. As per the data reported on
the 95% of confidence interval ULVRL against a most risky venture in comparison to all other
organization. Company contain the possibility of observing more amount of losses in comparison
to other entities.
At 90% confidence level the value at risk determine of ULVRL is -0.0178642. SHELL
reported its value at risk figure of -0.0306030. HSBAL recorded its value at risk of -0.0233832.
AZN.L recorded its VAR is -0.02045. At the 90% confidence level against the ULVRL is
identified as the most risky venture in comparison to all other companies mentioned.
ULVRL found as the most risky venture in comparison to all other organizations
considered in the evaluation. The company hold the better possibility of loosing its capital at all
possible confidence level. Management need to design a suitable strategy to cover the financial
risk involve with the business.
(b) Covariance and correlation between stocks
5

Covariance
ULVR.L SHEL.L HSBA.L AZN.L
ULVR.L 0.000196735
SHEL.L 6.60052E-05 0.000578136
HSBA.L 5.79058E-05 0.000235601 0.000335383
AZN.L 8.06132E-05 7.48591E-05 4.7513E-05
0.00027399
1
Correlation
ULVR.L SHEL.L HSBA.L AZN.L
ULVR.L 1
SHEL.L 0.195714318 1
HSBA.L 0.225429595 0.535046871 1
AZN.L 0.347214742 0.188088414 0.156738025 1
Covariance demonstrate the position of assets to generate the return. ULVRL found its
covariance level at 0.000196735. Level o covariance for SHELL is identify as 0.000578136.
HSBAL found its covariance at 0.000335383. AZN.L could identify the covariance level at
0.000274. SHELL hold The most favorable covariance level which indicate that company
holding a better position in comparison to other companies included in this evaluation to
generate the potential return from assets hold by the organization. HSBAL is having a second
best position in comparison to other companies mentioned in the list to generate return from
assets acquired by the company (Cooper and Sommer, 2020). ULVRL is having a there position
to generate the only in comparison to the AZN.L. The company AZN.L is the least best
possibility to generate the revenue out of utilization the assets hold by the organization. SHELL
Company is holding the most dominating position in respect to other companies included in the
lust to generate a potential return against utilizing the assets hold by the organization.
ULVRL is holding a correlation measure of 0.195714318. SHELL Company is acquiring
the correlation value of 0.535046871. HSBAL Is holding the value of 0.15673802. AZN.L is
6
ULVR.L SHEL.L HSBA.L AZN.L
ULVR.L 0.000196735
SHEL.L 6.60052E-05 0.000578136
HSBA.L 5.79058E-05 0.000235601 0.000335383
AZN.L 8.06132E-05 7.48591E-05 4.7513E-05
0.00027399
1
Correlation
ULVR.L SHEL.L HSBA.L AZN.L
ULVR.L 1
SHEL.L 0.195714318 1
HSBA.L 0.225429595 0.535046871 1
AZN.L 0.347214742 0.188088414 0.156738025 1
Covariance demonstrate the position of assets to generate the return. ULVRL found its
covariance level at 0.000196735. Level o covariance for SHELL is identify as 0.000578136.
HSBAL found its covariance at 0.000335383. AZN.L could identify the covariance level at
0.000274. SHELL hold The most favorable covariance level which indicate that company
holding a better position in comparison to other companies included in this evaluation to
generate the potential return from assets hold by the organization. HSBAL is having a second
best position in comparison to other companies mentioned in the list to generate return from
assets acquired by the company (Cooper and Sommer, 2020). ULVRL is having a there position
to generate the only in comparison to the AZN.L. The company AZN.L is the least best
possibility to generate the revenue out of utilization the assets hold by the organization. SHELL
Company is holding the most dominating position in respect to other companies included in the
lust to generate a potential return against utilizing the assets hold by the organization.
ULVRL is holding a correlation measure of 0.195714318. SHELL Company is acquiring
the correlation value of 0.535046871. HSBAL Is holding the value of 0.15673802. AZN.L is
6
⊘ This is a preview!⊘
Do you want full access?
Subscribe today to unlock all pages.
Trusted by 1+ million students worldwide
holding the value at 1. The relationship between stock and return is most stronger in case of
AZN.L. SHELL is also having a better position in the market. ULVRL is behind to the SHELL
and AZN.L. HSBAL is holding the lest position in the entire situation in comparison to other
organization available in the market.
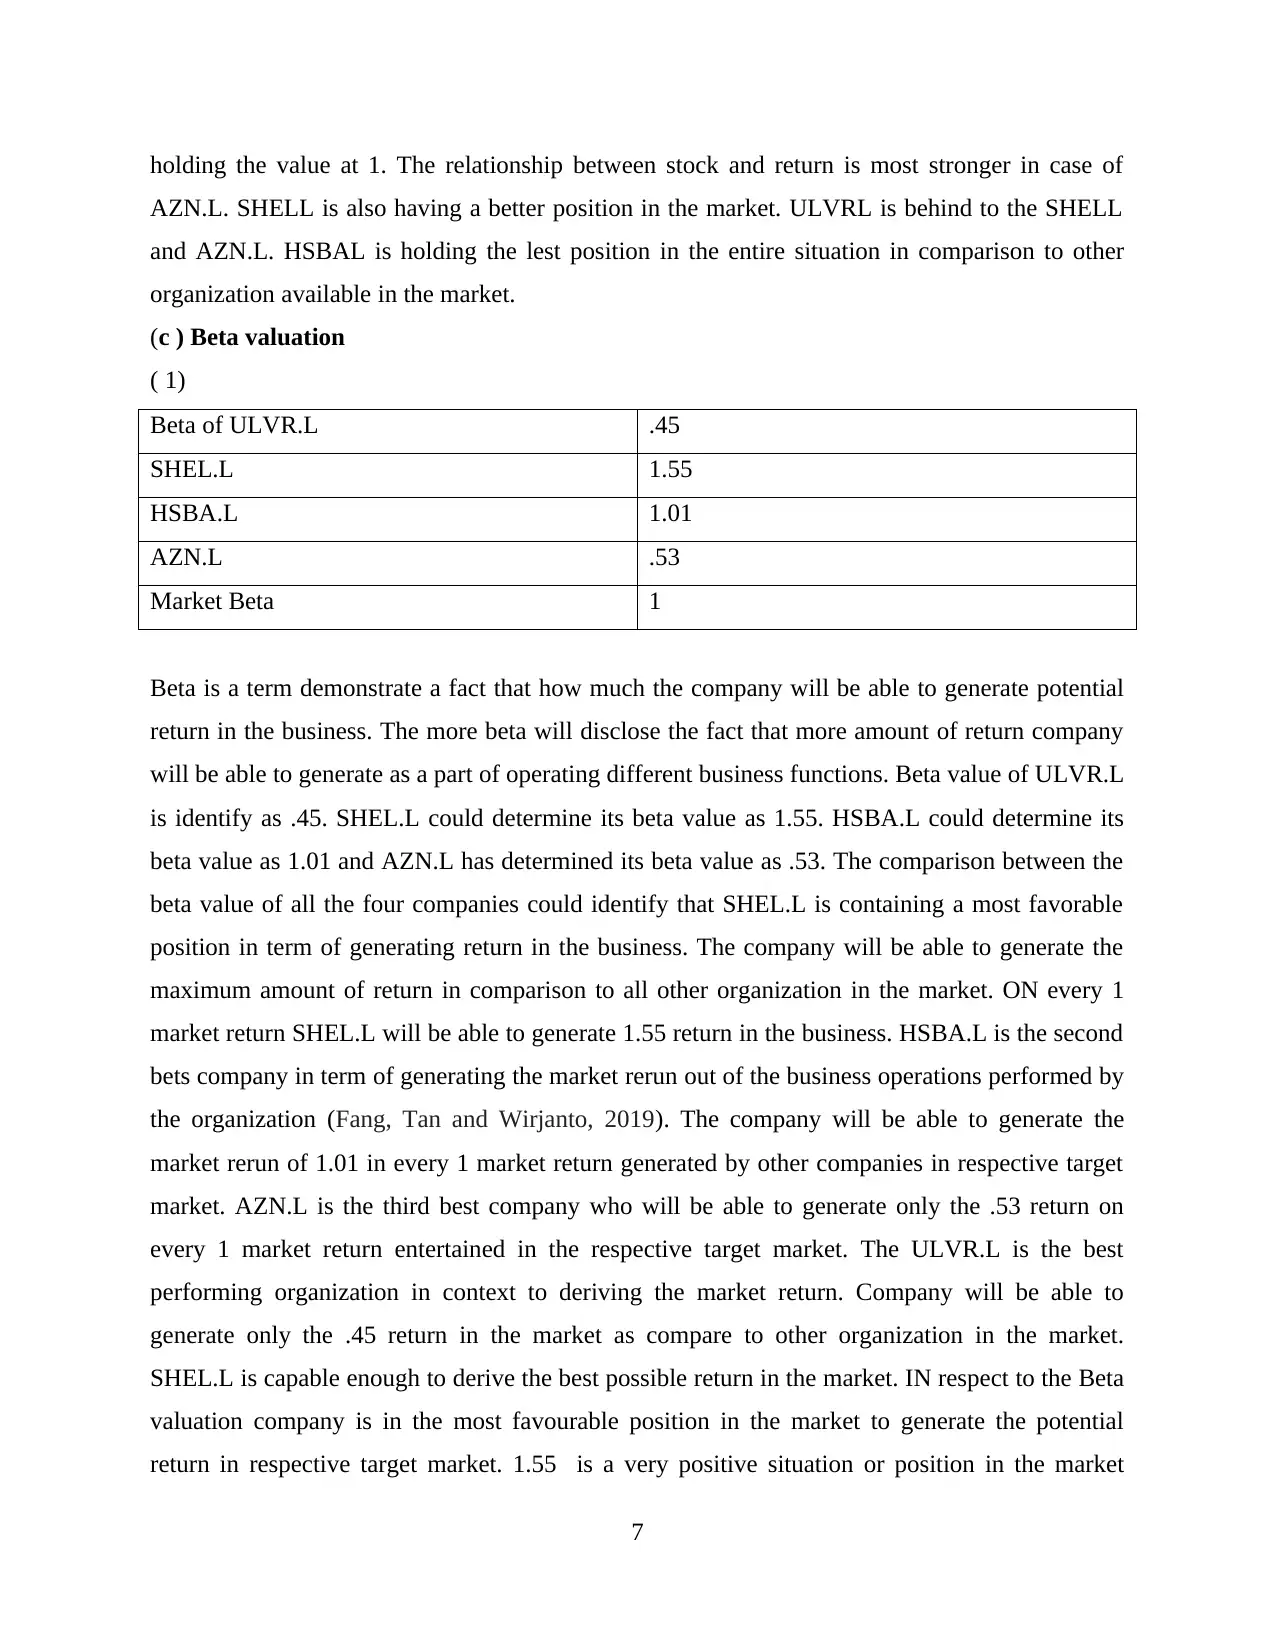
(c ) Beta valuation
( 1)
Beta of ULVR.L .45
SHEL.L 1.55
HSBA.L 1.01
AZN.L .53
Market Beta 1
Beta is a term demonstrate a fact that how much the company will be able to generate potential
return in the business. The more beta will disclose the fact that more amount of return company
will be able to generate as a part of operating different business functions. Beta value of ULVR.L
is identify as .45. SHEL.L could determine its beta value as 1.55. HSBA.L could determine its
beta value as 1.01 and AZN.L has determined its beta value as .53. The comparison between the
beta value of all the four companies could identify that SHEL.L is containing a most favorable
position in term of generating return in the business. The company will be able to generate the
maximum amount of return in comparison to all other organization in the market. ON every 1
market return SHEL.L will be able to generate 1.55 return in the business. HSBA.L is the second
bets company in term of generating the market rerun out of the business operations performed by
the organization (Fang, Tan and Wirjanto, 2019). The company will be able to generate the
market rerun of 1.01 in every 1 market return generated by other companies in respective target
market. AZN.L is the third best company who will be able to generate only the .53 return on
every 1 market return entertained in the respective target market. The ULVR.L is the best
performing organization in context to deriving the market return. Company will be able to
generate only the .45 return in the market as compare to other organization in the market.
SHEL.L is capable enough to derive the best possible return in the market. IN respect to the Beta
valuation company is in the most favourable position in the market to generate the potential
return in respective target market. 1.55 is a very positive situation or position in the market
7
AZN.L. SHELL is also having a better position in the market. ULVRL is behind to the SHELL
and AZN.L. HSBAL is holding the lest position in the entire situation in comparison to other
organization available in the market.
(c ) Beta valuation
( 1)
Beta of ULVR.L .45
SHEL.L 1.55
HSBA.L 1.01
AZN.L .53
Market Beta 1
Beta is a term demonstrate a fact that how much the company will be able to generate potential
return in the business. The more beta will disclose the fact that more amount of return company
will be able to generate as a part of operating different business functions. Beta value of ULVR.L
is identify as .45. SHEL.L could determine its beta value as 1.55. HSBA.L could determine its
beta value as 1.01 and AZN.L has determined its beta value as .53. The comparison between the
beta value of all the four companies could identify that SHEL.L is containing a most favorable
position in term of generating return in the business. The company will be able to generate the
maximum amount of return in comparison to all other organization in the market. ON every 1
market return SHEL.L will be able to generate 1.55 return in the business. HSBA.L is the second
bets company in term of generating the market rerun out of the business operations performed by
the organization (Fang, Tan and Wirjanto, 2019). The company will be able to generate the
market rerun of 1.01 in every 1 market return generated by other companies in respective target
market. AZN.L is the third best company who will be able to generate only the .53 return on
every 1 market return entertained in the respective target market. The ULVR.L is the best
performing organization in context to deriving the market return. Company will be able to
generate only the .45 return in the market as compare to other organization in the market.
SHEL.L is capable enough to derive the best possible return in the market. IN respect to the Beta
valuation company is in the most favourable position in the market to generate the potential
return in respective target market. 1.55 is a very positive situation or position in the market
7
Paraphrase This Document
Need a fresh take? Get an instant paraphrase of this document with our AI Paraphraser
which demonstrate the fact that on every 1 market return arrives the SHEL.L will be able to
generate 1.55 which is more than 1. From the investors point of view SHEL.L Company is in the
most favorable position or situation in the market as compare to all its other competitors
mentioned in the list (Platanakis and Urquhart, 2019). The current position of the organization is
highly favorable for the company which will allow the potential investors to get attracted
towards the business growth and development possibilities. Apart from the SHEL.L, HSBA.L Is
also ion the favourable position. The company will be able to derive the better and more number
of return in the busies as compare to the market position. The organization will be able to
generate the market return of 1.01 in comparison to the 1 market return generated in the sector.
Form the investor's point of view HSBA.L is also one of the favourable organization to invest.
Expected return in the business play a significant role every time investor make the investment
decision in the market. Both the SHEL.L and HSABL.L are the two most favourable
organization in term of making an investment decision in the market.
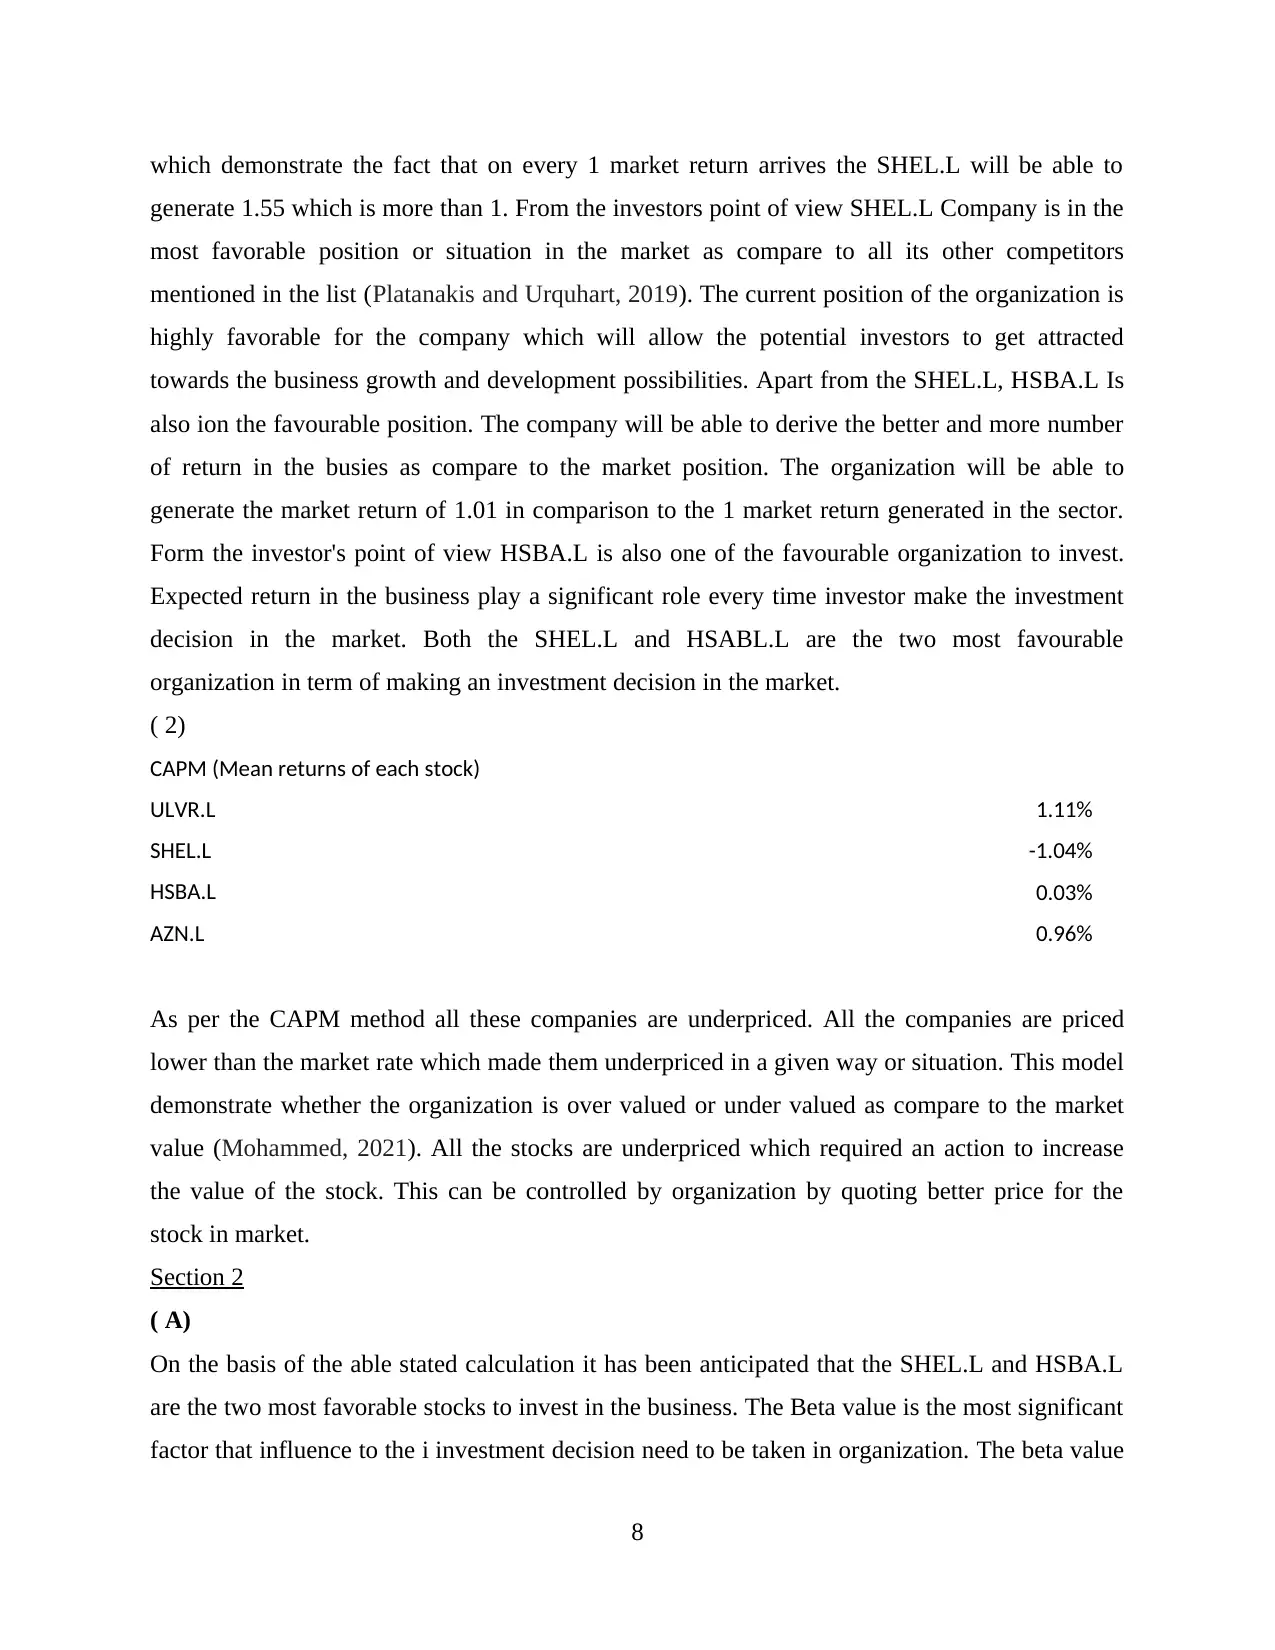
( 2)
CAPM (Mean returns of each stock)
ULVR.L 1.11%
SHEL.L -1.04%
HSBA.L 0.03%
AZN.L 0.96%
As per the CAPM method all these companies are underpriced. All the companies are priced
lower than the market rate which made them underpriced in a given way or situation. This model
demonstrate whether the organization is over valued or under valued as compare to the market
value (Mohammed, 2021). All the stocks are underpriced which required an action to increase
the value of the stock. This can be controlled by organization by quoting better price for the
stock in market.
Section 2
( A)
On the basis of the able stated calculation it has been anticipated that the SHEL.L and HSBA.L
are the two most favorable stocks to invest in the business. The Beta value is the most significant
factor that influence to the i investment decision need to be taken in organization. The beta value
8
generate 1.55 which is more than 1. From the investors point of view SHEL.L Company is in the
most favorable position or situation in the market as compare to all its other competitors
mentioned in the list (Platanakis and Urquhart, 2019). The current position of the organization is
highly favorable for the company which will allow the potential investors to get attracted
towards the business growth and development possibilities. Apart from the SHEL.L, HSBA.L Is
also ion the favourable position. The company will be able to derive the better and more number
of return in the busies as compare to the market position. The organization will be able to
generate the market return of 1.01 in comparison to the 1 market return generated in the sector.
Form the investor's point of view HSBA.L is also one of the favourable organization to invest.
Expected return in the business play a significant role every time investor make the investment
decision in the market. Both the SHEL.L and HSABL.L are the two most favourable
organization in term of making an investment decision in the market.
( 2)
CAPM (Mean returns of each stock)
ULVR.L 1.11%
SHEL.L -1.04%
HSBA.L 0.03%
AZN.L 0.96%
As per the CAPM method all these companies are underpriced. All the companies are priced
lower than the market rate which made them underpriced in a given way or situation. This model
demonstrate whether the organization is over valued or under valued as compare to the market
value (Mohammed, 2021). All the stocks are underpriced which required an action to increase
the value of the stock. This can be controlled by organization by quoting better price for the
stock in market.
Section 2
( A)
On the basis of the able stated calculation it has been anticipated that the SHEL.L and HSBA.L
are the two most favorable stocks to invest in the business. The Beta value is the most significant
factor that influence to the i investment decision need to be taken in organization. The beta value
8
of the SHEL.L is 1.55 and HSBA.L is 1.01 which is more than 1. This demonstrate that on every
1 return market earn the SHEL.L will earn 1.55 instead of 1 and HSBAL.L will derive 1.01
return. Hence, investors can select both these stocks to make an investment decision in the
business (Hannila and et.al., 2019). These stocks are in a position to derive the most favorable
rerun over the investment decision is made by the inventors. The respective ratio may further
increase for the company which will further raise to the expected return generate against
investing in these stocks.
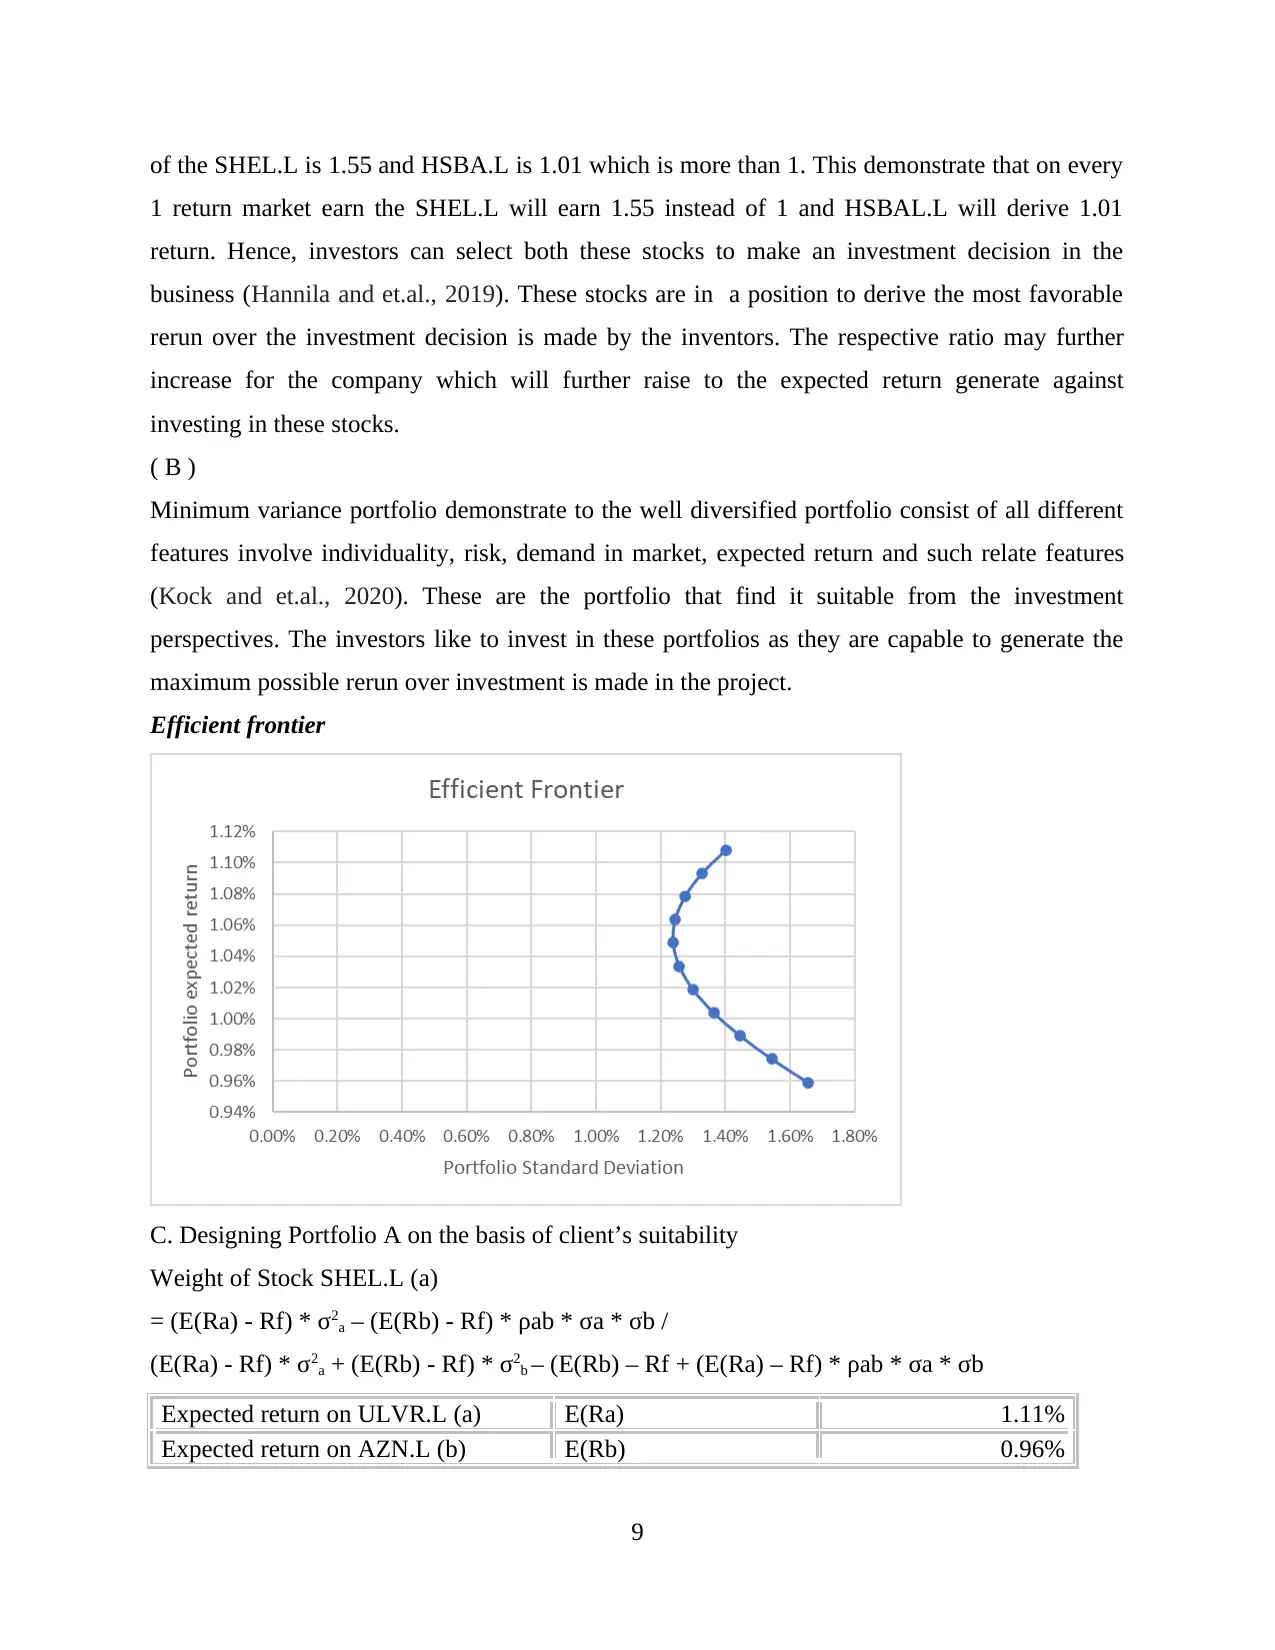
( B )
Minimum variance portfolio demonstrate to the well diversified portfolio consist of all different
features involve individuality, risk, demand in market, expected return and such relate features
(Kock and et.al., 2020). These are the portfolio that find it suitable from the investment
perspectives. The investors like to invest in these portfolios as they are capable to generate the
maximum possible rerun over investment is made in the project.
Efficient frontier
C. Designing Portfolio A on the basis of client’s suitability
Weight of Stock SHEL.L (a)
= (E(Ra) - Rf) * σ2a – (E(Rb) - Rf) * ρab * σa * σb /
(E(Ra) - Rf) * σ2a + (E(Rb) - Rf) * σ2b – (E(Rb) – Rf + (E(Ra) – Rf) * ρab * σa * σb
Expected return on ULVR.L (a) E(Ra) 1.11%
Expected return on AZN.L (b) E(Rb) 0.96%
9
1 return market earn the SHEL.L will earn 1.55 instead of 1 and HSBAL.L will derive 1.01
return. Hence, investors can select both these stocks to make an investment decision in the
business (Hannila and et.al., 2019). These stocks are in a position to derive the most favorable
rerun over the investment decision is made by the inventors. The respective ratio may further
increase for the company which will further raise to the expected return generate against
investing in these stocks.
( B )
Minimum variance portfolio demonstrate to the well diversified portfolio consist of all different
features involve individuality, risk, demand in market, expected return and such relate features
(Kock and et.al., 2020). These are the portfolio that find it suitable from the investment
perspectives. The investors like to invest in these portfolios as they are capable to generate the
maximum possible rerun over investment is made in the project.
Efficient frontier
C. Designing Portfolio A on the basis of client’s suitability
Weight of Stock SHEL.L (a)
= (E(Ra) - Rf) * σ2a – (E(Rb) - Rf) * ρab * σa * σb /
(E(Ra) - Rf) * σ2a + (E(Rb) - Rf) * σ2b – (E(Rb) – Rf + (E(Ra) – Rf) * ρab * σa * σb
Expected return on ULVR.L (a) E(Ra) 1.11%
Expected return on AZN.L (b) E(Rb) 0.96%
9
⊘ This is a preview!⊘
Do you want full access?
Subscribe today to unlock all pages.
Trusted by 1+ million students worldwide
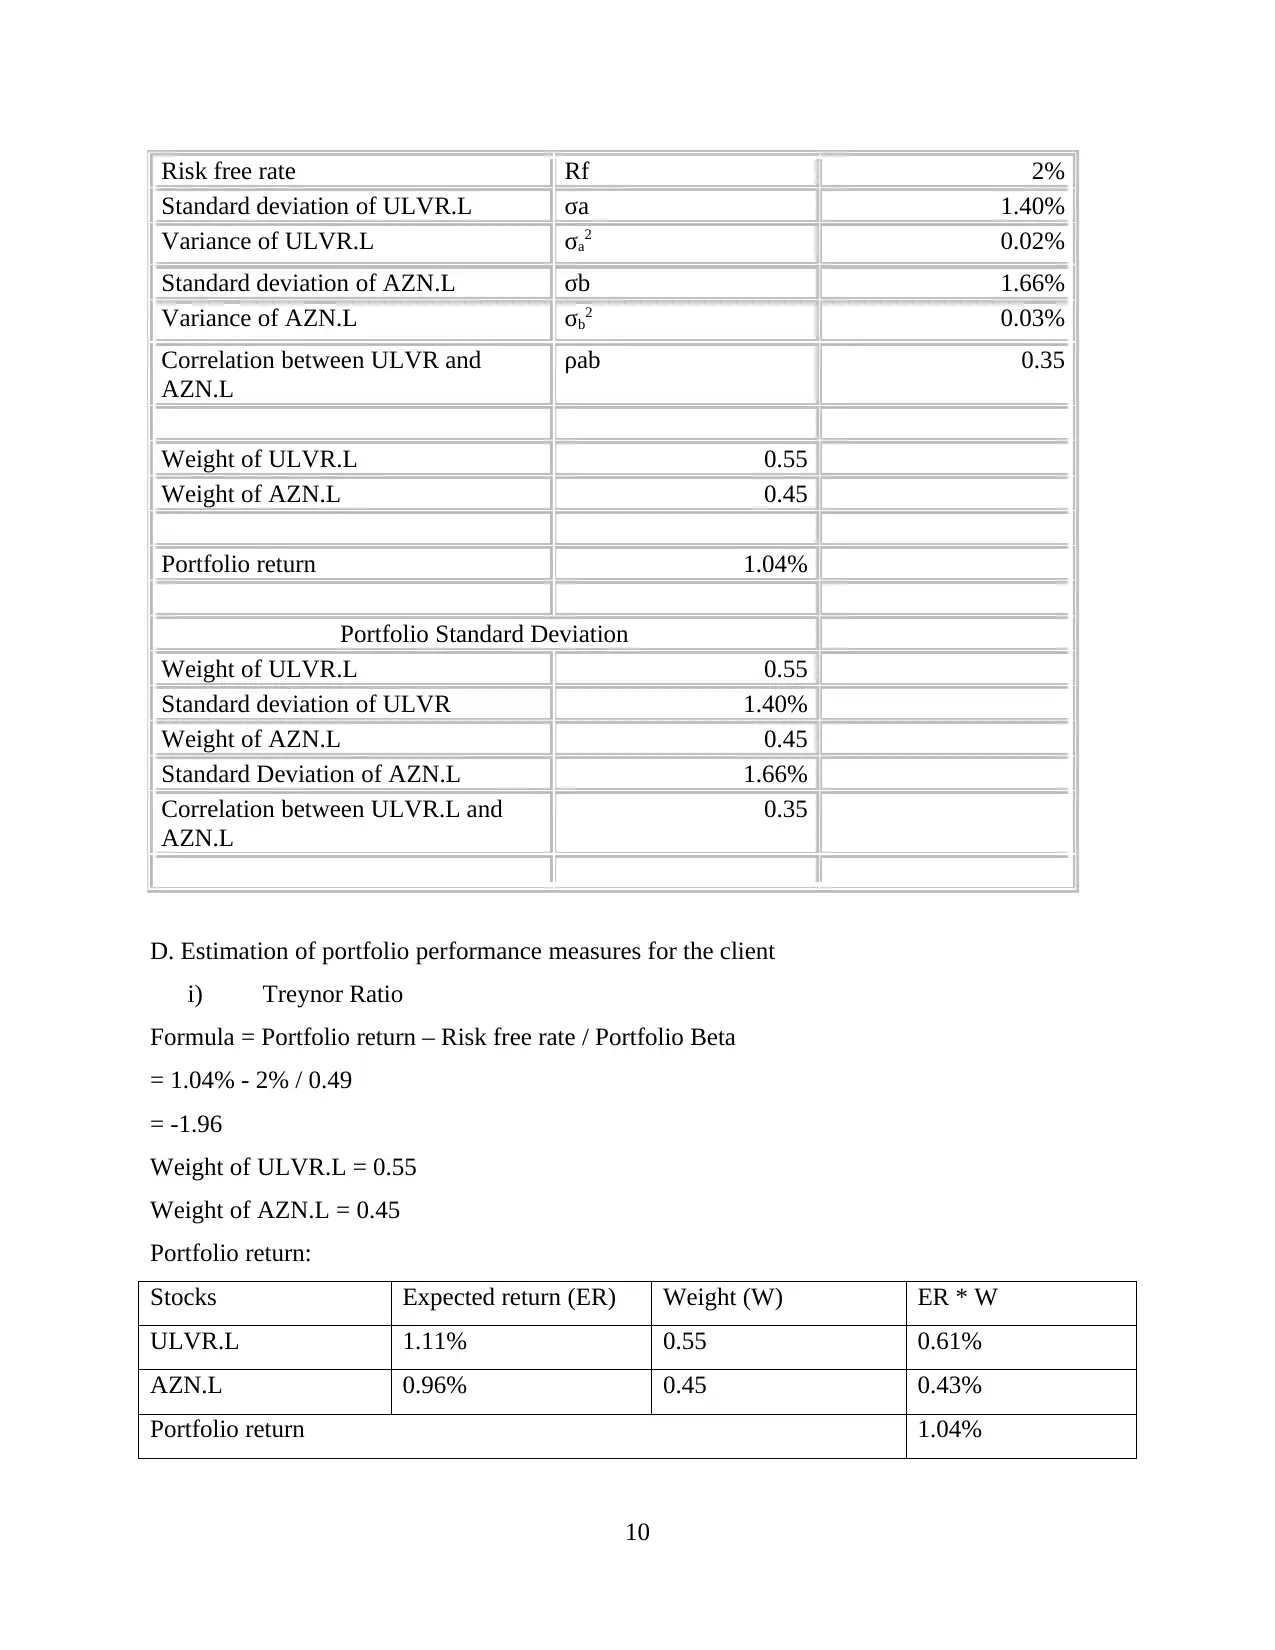
Risk free rate Rf 2%
Standard deviation of ULVR.L σa 1.40%
Variance of ULVR.L σa2 0.02%
Standard deviation of AZN.L σb 1.66%
Variance of AZN.L σb2 0.03%
Correlation between ULVR and
AZN.L
ρab 0.35
Weight of ULVR.L 0.55
Weight of AZN.L 0.45
Portfolio return 1.04%
Portfolio Standard Deviation
Weight of ULVR.L 0.55
Standard deviation of ULVR 1.40%
Weight of AZN.L 0.45
Standard Deviation of AZN.L 1.66%
Correlation between ULVR.L and
AZN.L
0.35
D. Estimation of portfolio performance measures for the client
i) Treynor Ratio
Formula = Portfolio return – Risk free rate / Portfolio Beta
= 1.04% - 2% / 0.49
= -1.96
Weight of ULVR.L = 0.55
Weight of AZN.L = 0.45
Portfolio return:
Stocks Expected return (ER) Weight (W) ER * W
ULVR.L 1.11% 0.55 0.61%
AZN.L 0.96% 0.45 0.43%
Portfolio return 1.04%
10
Paraphrase This Document
Need a fresh take? Get an instant paraphrase of this document with our AI Paraphraser
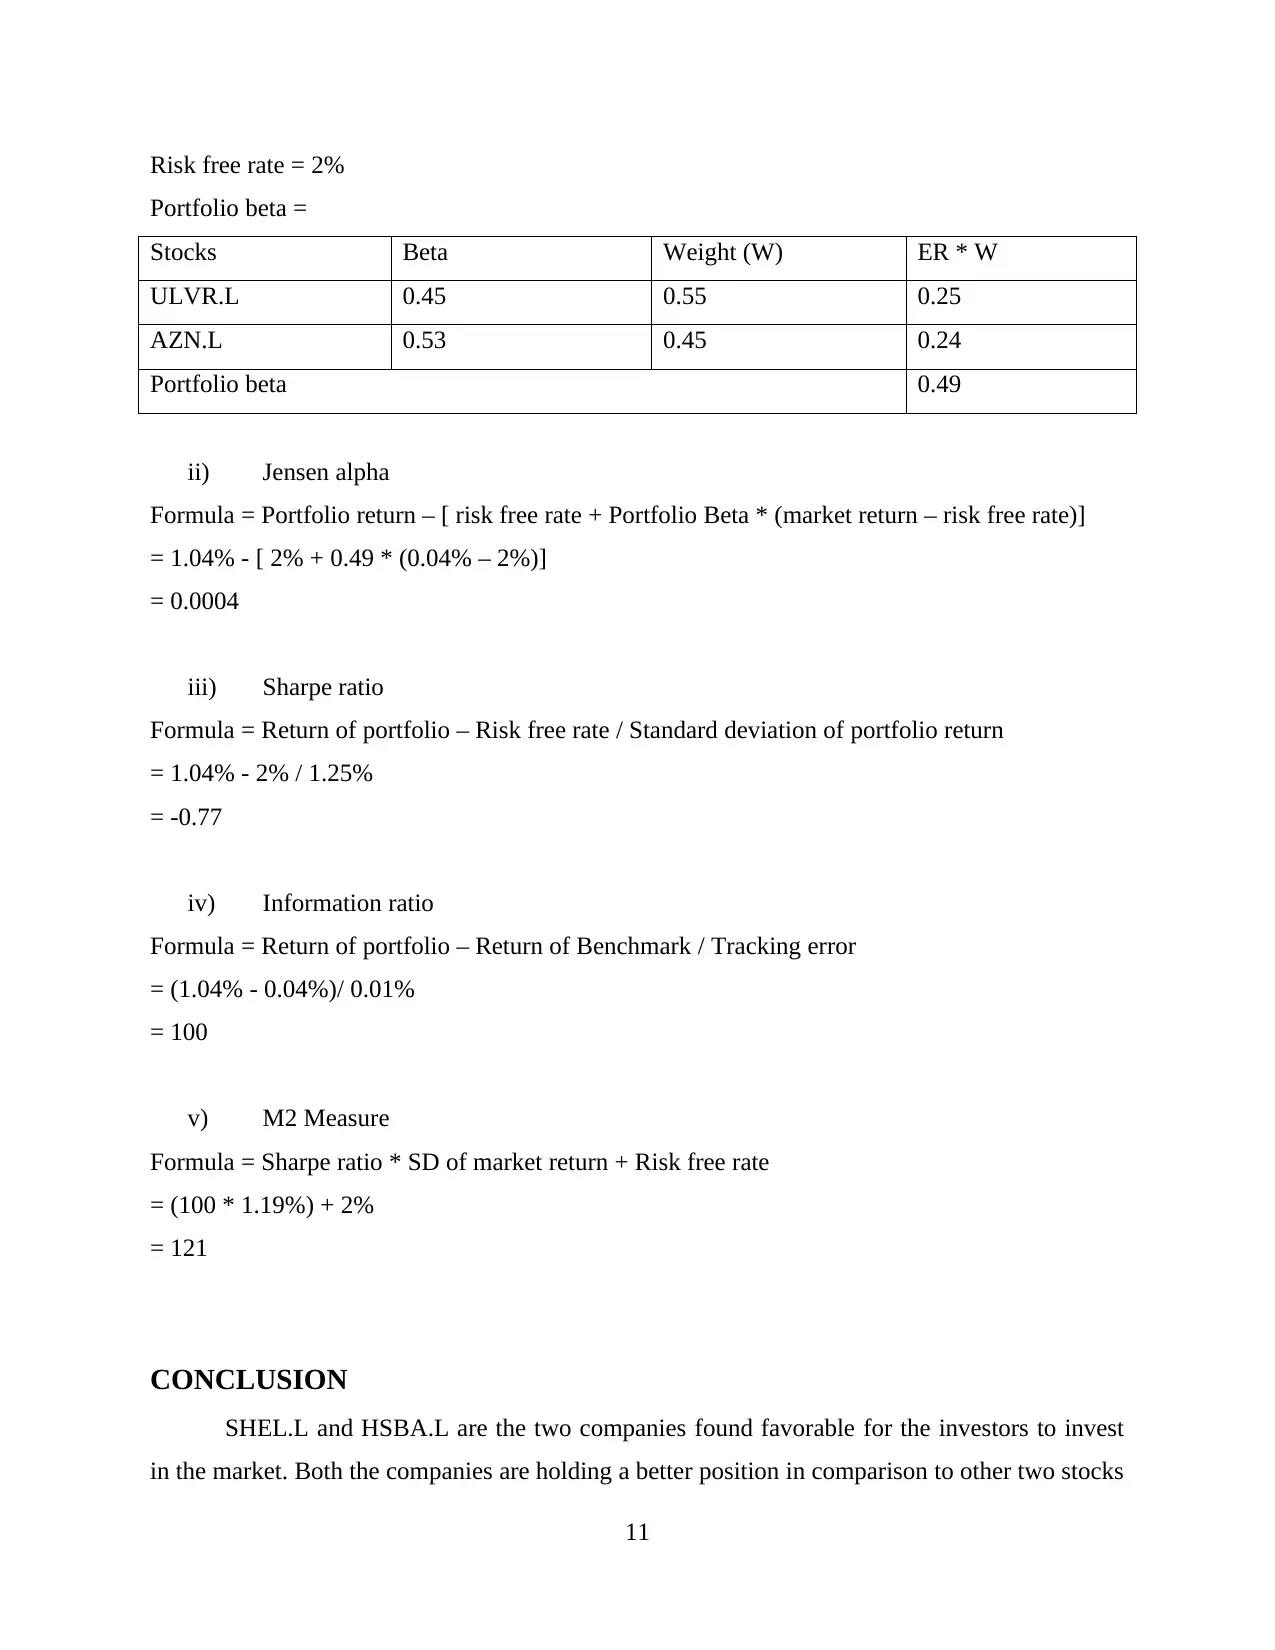
Risk free rate = 2%
Portfolio beta =
Stocks Beta Weight (W) ER * W
ULVR.L 0.45 0.55 0.25
AZN.L 0.53 0.45 0.24
Portfolio beta 0.49
ii) Jensen alpha
Formula = Portfolio return – [ risk free rate + Portfolio Beta * (market return – risk free rate)]
= 1.04% - [ 2% + 0.49 * (0.04% – 2%)]
= 0.0004
iii) Sharpe ratio
Formula = Return of portfolio – Risk free rate / Standard deviation of portfolio return
= 1.04% - 2% / 1.25%
= -0.77
iv) Information ratio
Formula = Return of portfolio – Return of Benchmark / Tracking error
= (1.04% - 0.04%)/ 0.01%
= 100
v) M2 Measure
Formula = Sharpe ratio * SD of market return + Risk free rate
= (100 * 1.19%) + 2%
= 121
CONCLUSION
SHEL.L and HSBA.L are the two companies found favorable for the investors to invest
in the market. Both the companies are holding a better position in comparison to other two stocks
11

which could favour to the investor to generate the better return out of the investment is made in
the project.
REFERENCES
Books and Journal
12
the project.
REFERENCES
Books and Journal
12
⊘ This is a preview!⊘
Do you want full access?
Subscribe today to unlock all pages.
Trusted by 1+ million students worldwide
1 out of 13
Related Documents


Your All-in-One AI-Powered Toolkit for Academic Success.
+13062052269
info@desklib.com
Available 24*7 on WhatsApp / Email
![[object Object]](/_next/static/media/star-bottom.7253800d.svg)
Unlock your academic potential
Copyright © 2020–2026 A2Z Services. All Rights Reserved. Developed and managed by ZUCOL.