AASB 136 Impairment, Financial Ratio Analysis & Cash Flows
VerifiedAdded on 2023/06/13
|11
|2078
|128
Report
AI Summary
This assignment includes a letter to the CFO regarding AASB 136 and CGUs, financial ratio analysis for 2016 and 2017, a report summarizing Woolworths Limited's financial performance, an analysis of liquidity ratios, and a discussion on translating foreign currency financial statements. The assignment also presents a statement of cash flow for Flash in the Pan Ltd. for the year ended 30th June, 2019, including detailed workings for cash collected from sales, payments to suppliers, proceeds from the sale of assets, and payment of taxes. Desklib provides a range of solved assignments and study resources for students.
Solution-1
To,
The Chief Financial Officer,
The Wentnor Dairy Company Ltd.
Dear Sir,
Subject: Advice on application of AASB 136 to the company’s various activities
This letter is in reference to the application of AASB 136, “Impairment of assets” on the company’s
various activities. Let’s start with the definition of cash generating units.
A cash generating unit (or CGU) is a smallest identifiable group of assets, which generates cash inflows
and these cash inflows are largely independent from the cash inflows generated by other assets or other
cash generating units.
Para 66 of AASB 136, states that the impairment testing should be conducted on a single asset basis, but
if the recoverable amount for a single asset cannot be determined for the reason because the cash inflows
of that asset cannot be separately identified or are not independent from the cash inflows of other assets or
its value in use cannot be determined then the impairment testing should be conducted on a cash
generating units basis.
So, considering above, the impairment testing is conduct on a CGU basis, because the cash inflows
involved in the individual assets cannot be reliably estimated or calculated.
Further, for identifying the CGUs of the company, the following factors should be considered.
(a) Whether there is an identifiable group of assets whose cash flows are largely independent from
the cash flows of other assets
(b) Whether an active market exists for the assets being produced by above group of assets
irrespective of the fact that whether the produced products are used internally or externally.
Further, para 70 of AASB 136, states that (Aasb.gov.au, 2018)
“If an active market exists for the output produced by an asset or group of assets, that asset or group of
assets shall be identified as a cash-generating unit, even if some or all of the output is used internally.”
So, considering the above factors we can conclude that the milk production section is a separate CGU
since, the milk produce by the CGU can be sold externally means an active market exists for it and
further, the CGU’s cash inflows are independent of the cash inflows of other factories.
Hope it helps and have clarified the issues.
Thanks,
Paraphrase This Document
Need a fresh take? Get an instant paraphrase of this document with our AI Paraphraser

With Regards,
XYZ
XYZ
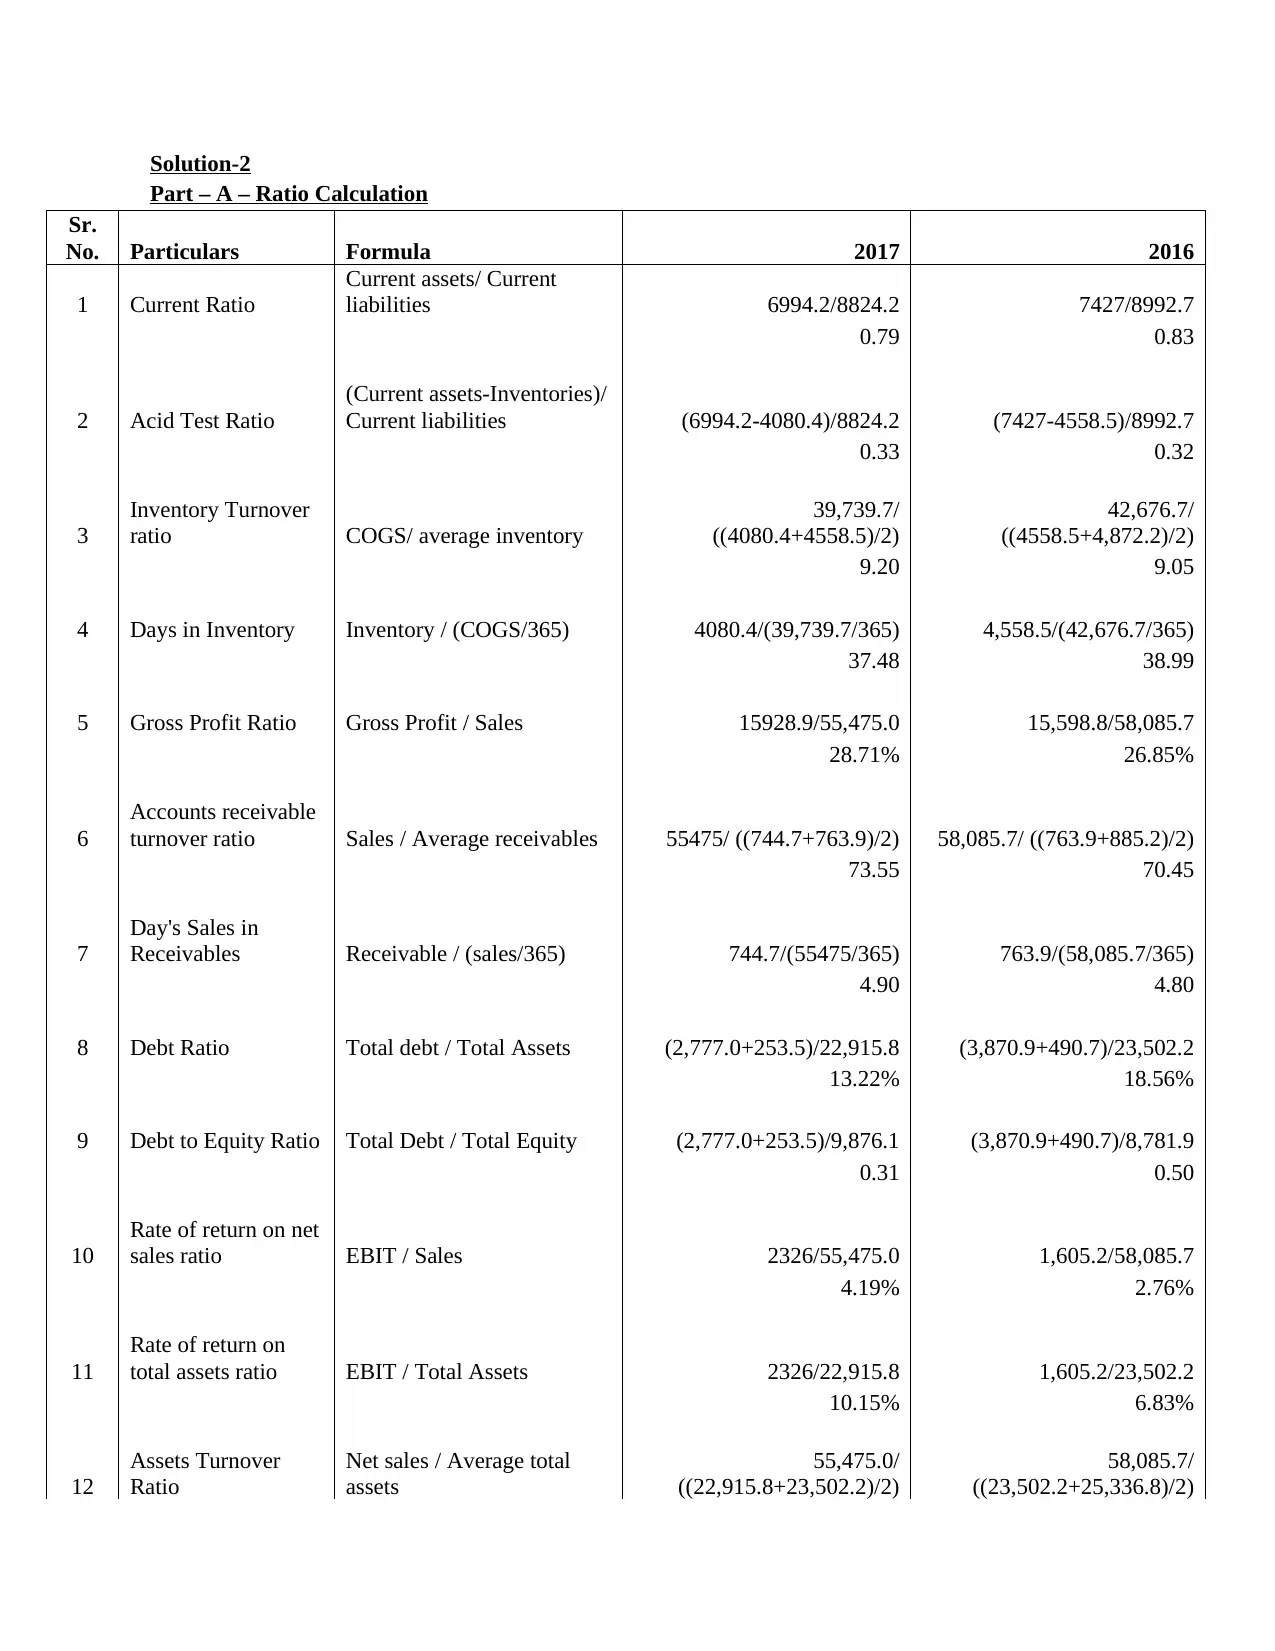
Solution-2
Part – A – Ratio Calculation
Sr.
No. Particulars Formula 2017 2016
1 Current Ratio
Current assets/ Current
liabilities 6994.2/8824.2 7427/8992.7
0.79 0.83
2 Acid Test Ratio
(Current assets-Inventories)/
Current liabilities (6994.2-4080.4)/8824.2 (7427-4558.5)/8992.7
0.33 0.32
3
Inventory Turnover
ratio COGS/ average inventory
39,739.7/
((4080.4+4558.5)/2)
42,676.7/
((4558.5+4,872.2)/2)
9.20 9.05
4 Days in Inventory Inventory / (COGS/365) 4080.4/(39,739.7/365) 4,558.5/(42,676.7/365)
37.48 38.99
5 Gross Profit Ratio Gross Profit / Sales 15928.9/55,475.0 15,598.8/58,085.7
28.71% 26.85%
6
Accounts receivable
turnover ratio Sales / Average receivables 55475/ ((744.7+763.9)/2) 58,085.7/ ((763.9+885.2)/2)
73.55 70.45
7
Day's Sales in
Receivables Receivable / (sales/365) 744.7/(55475/365) 763.9/(58,085.7/365)
4.90 4.80
8 Debt Ratio Total debt / Total Assets (2,777.0+253.5)/22,915.8 (3,870.9+490.7)/23,502.2
13.22% 18.56%
9 Debt to Equity Ratio Total Debt / Total Equity (2,777.0+253.5)/9,876.1 (3,870.9+490.7)/8,781.9
0.31 0.50
10
Rate of return on net
sales ratio EBIT / Sales 2326/55,475.0 1,605.2/58,085.7
4.19% 2.76%
11
Rate of return on
total assets ratio EBIT / Total Assets 2326/22,915.8 1,605.2/23,502.2
10.15% 6.83%
12
Assets Turnover
Ratio
Net sales / Average total
assets
55,475.0/
((22,915.8+23,502.2)/2)
58,085.7/
((23,502.2+25,336.8)/2)
⊘ This is a preview!⊘
Do you want full access?
Subscribe today to unlock all pages.
Trusted by 1+ million students worldwide
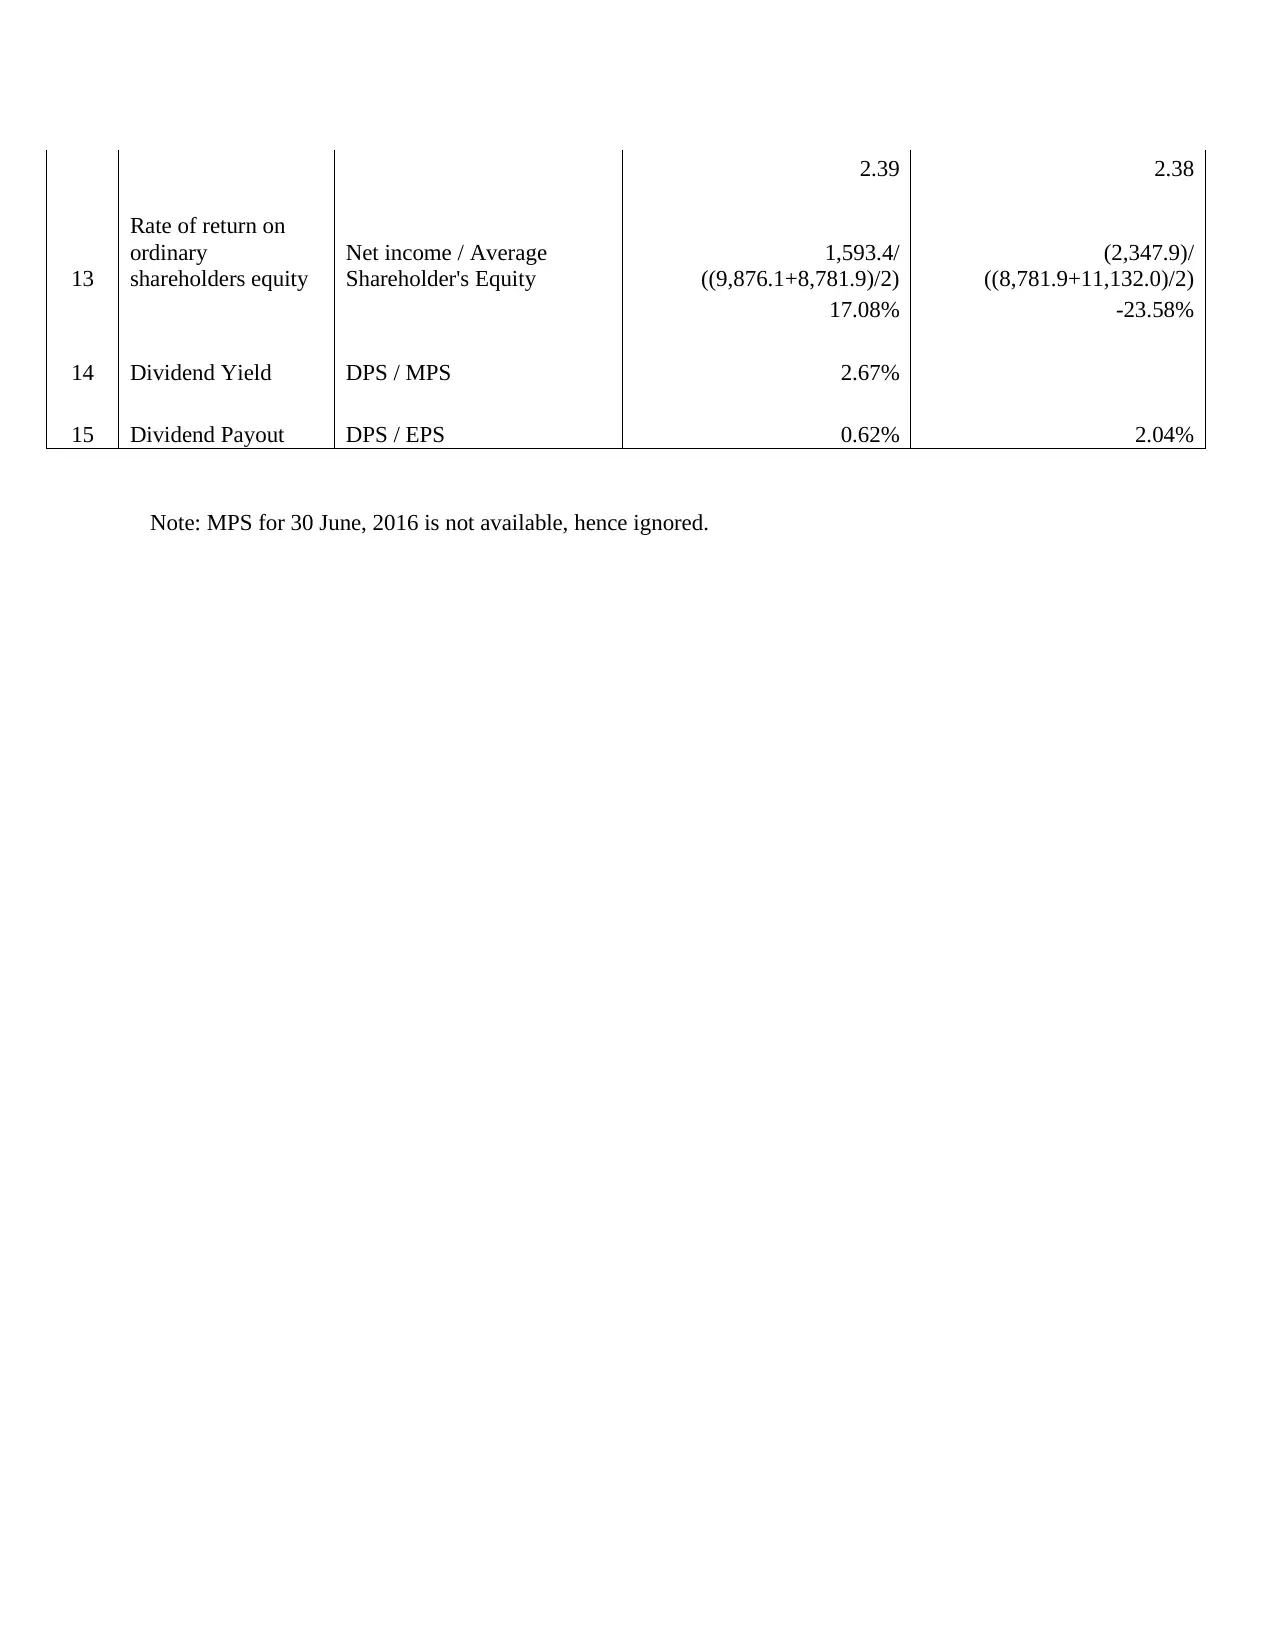
2.39 2.38
13
Rate of return on
ordinary
shareholders equity
Net income / Average
Shareholder's Equity
1,593.4/
((9,876.1+8,781.9)/2)
(2,347.9)/
((8,781.9+11,132.0)/2)
17.08% -23.58%
14 Dividend Yield DPS / MPS 2.67%
15 Dividend Payout DPS / EPS 0.62% 2.04%
Note: MPS for 30 June, 2016 is not available, hence ignored.
Paraphrase This Document
Need a fresh take? Get an instant paraphrase of this document with our AI Paraphraser
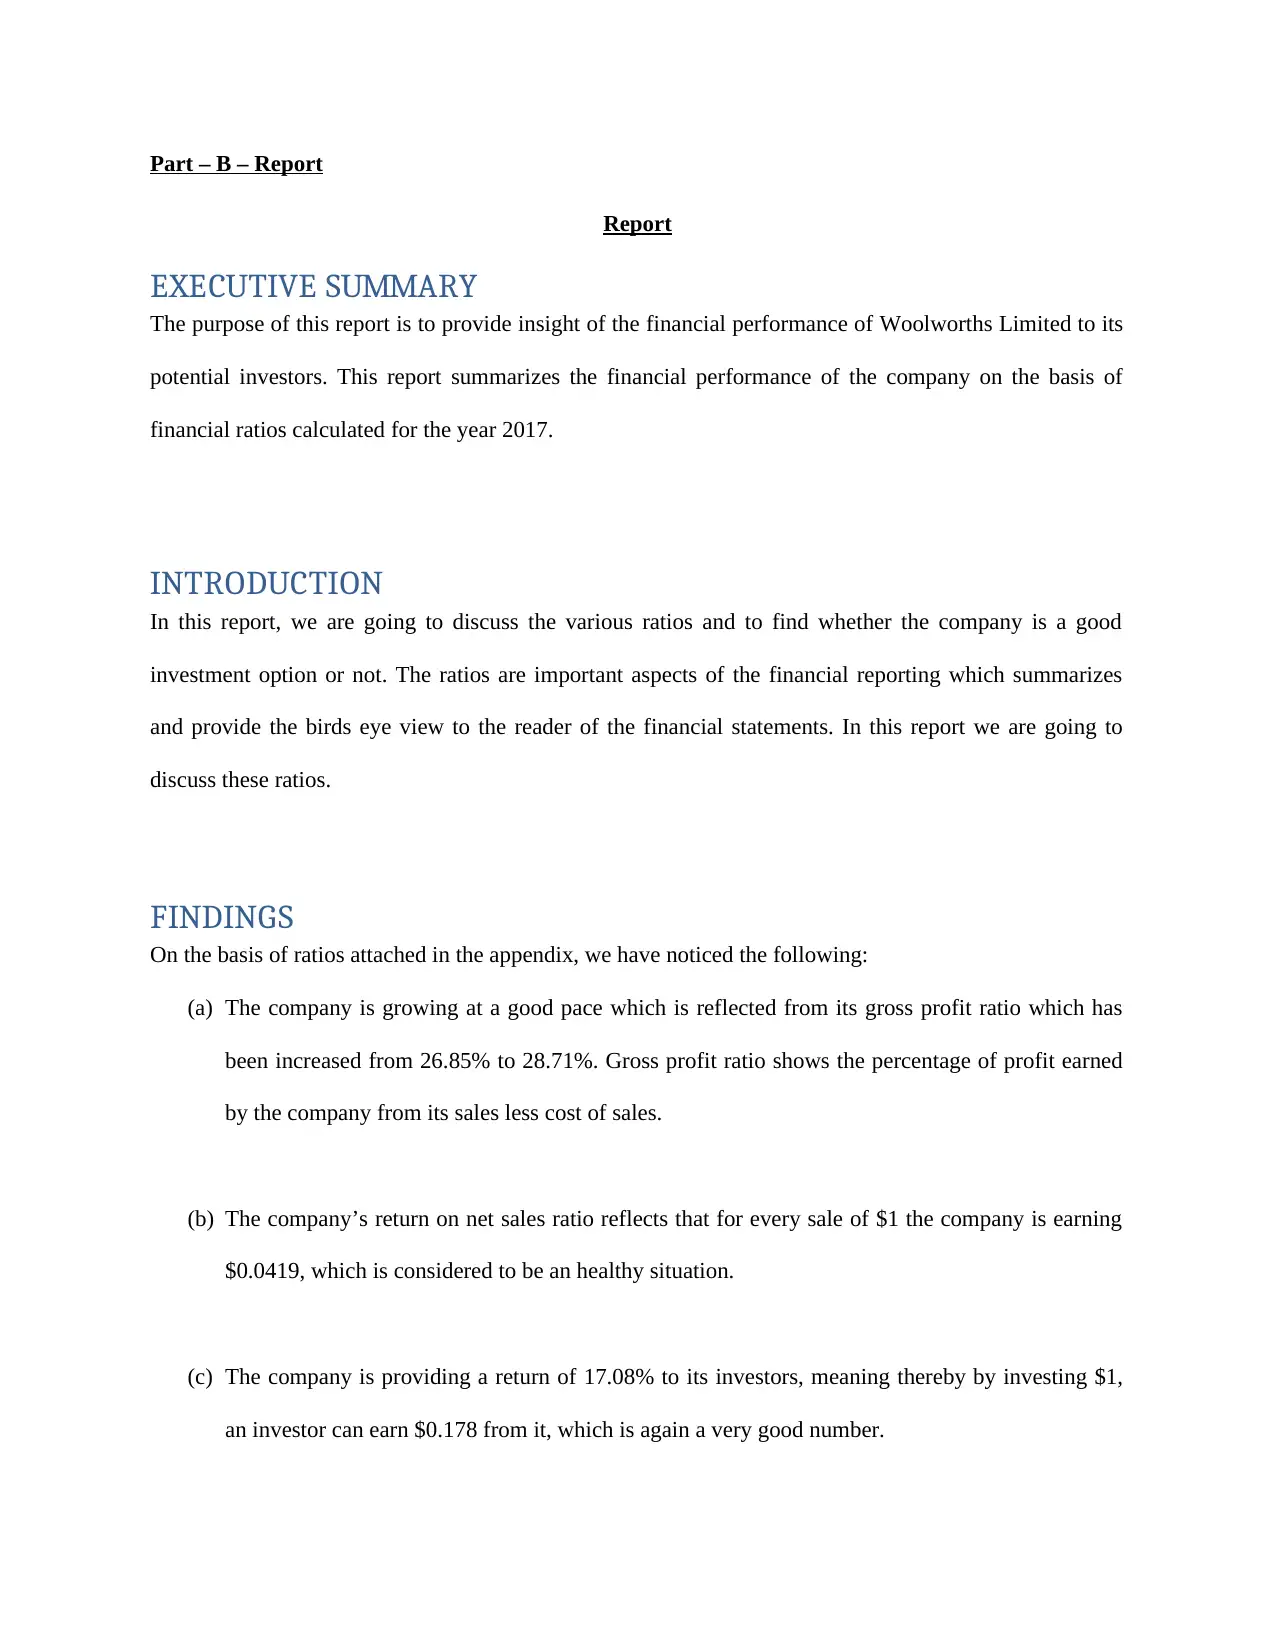
Part – B – Report
Report
EXECUTIVE SUMMARY
The purpose of this report is to provide insight of the financial performance of Woolworths Limited to its
potential investors. This report summarizes the financial performance of the company on the basis of
financial ratios calculated for the year 2017.
INTRODUCTION
In this report, we are going to discuss the various ratios and to find whether the company is a good
investment option or not. The ratios are important aspects of the financial reporting which summarizes
and provide the birds eye view to the reader of the financial statements. In this report we are going to
discuss these ratios.
FINDINGS
On the basis of ratios attached in the appendix, we have noticed the following:
(a) The company is growing at a good pace which is reflected from its gross profit ratio which has
been increased from 26.85% to 28.71%. Gross profit ratio shows the percentage of profit earned
by the company from its sales less cost of sales.
(b) The company’s return on net sales ratio reflects that for every sale of $1 the company is earning
$0.0419, which is considered to be an healthy situation.
(c) The company is providing a return of 17.08% to its investors, meaning thereby by investing $1,
an investor can earn $0.178 from it, which is again a very good number.
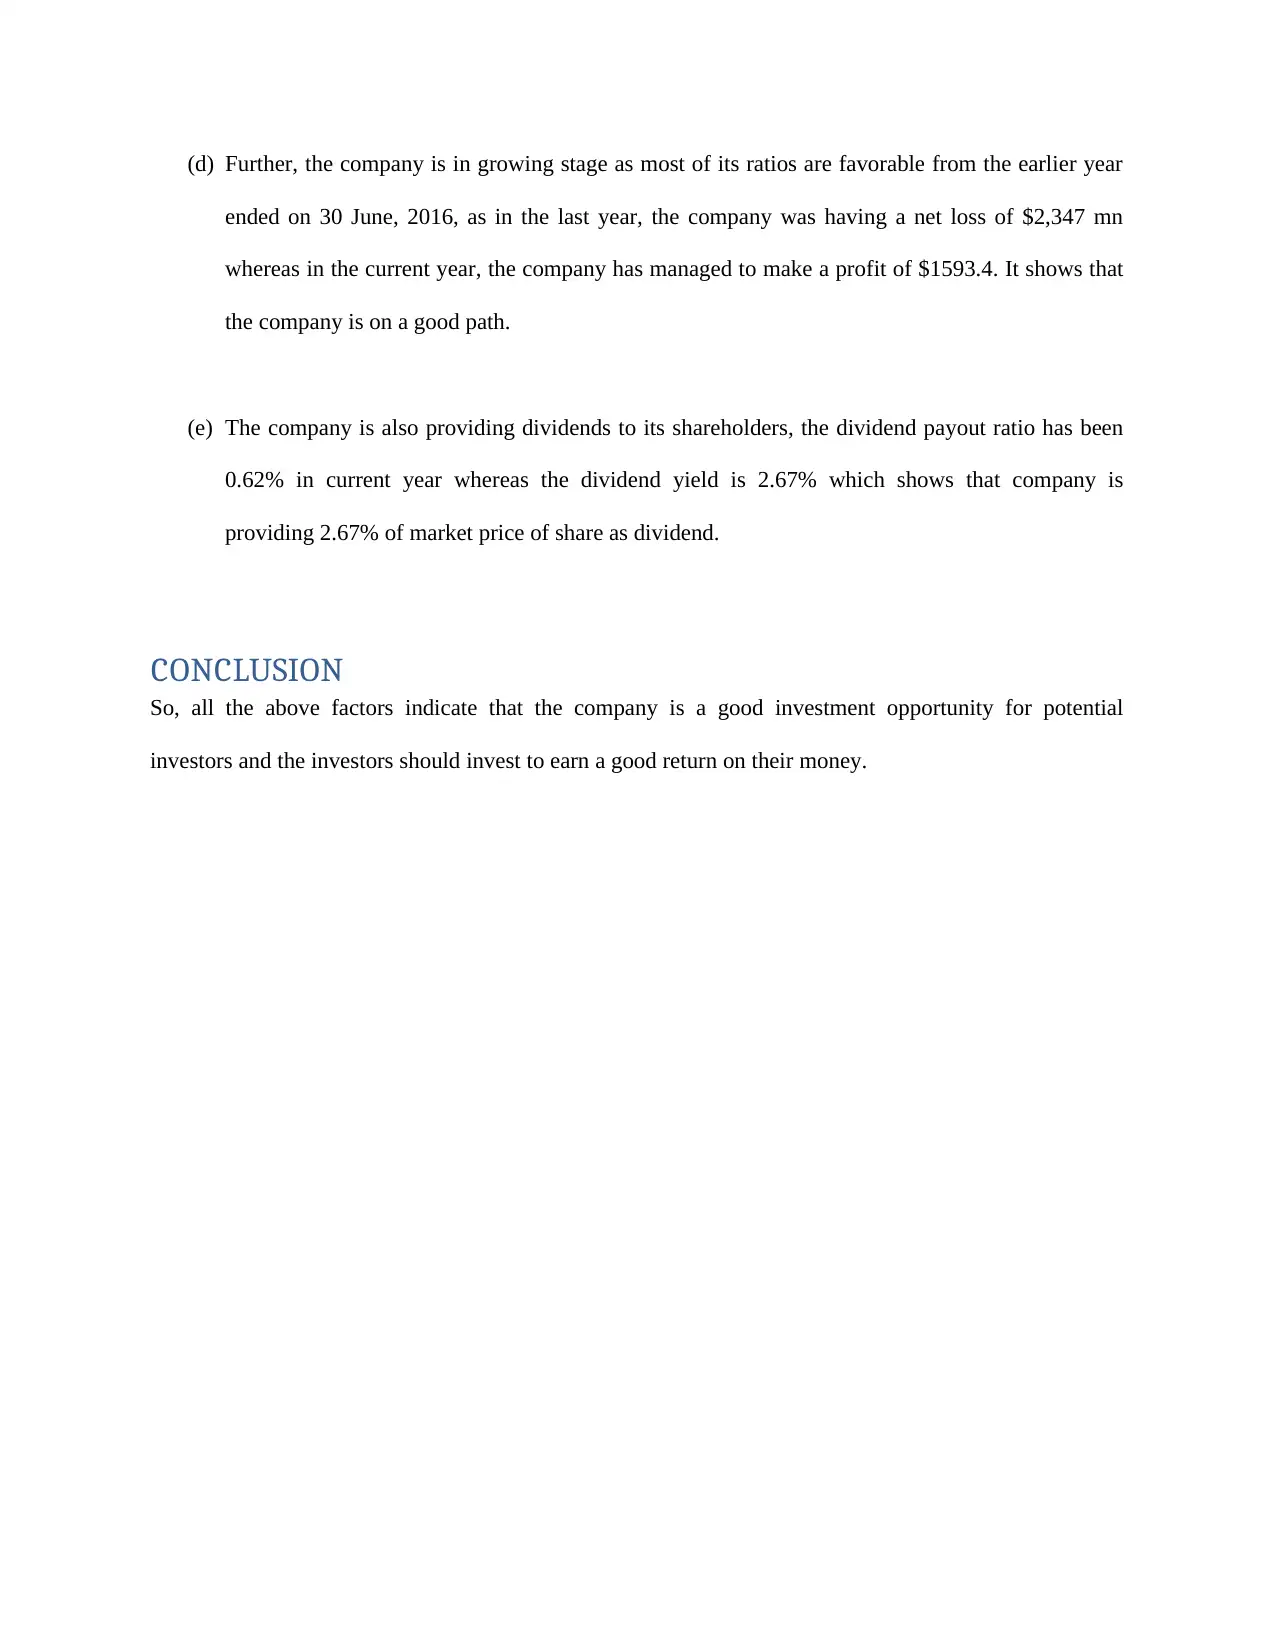
(d) Further, the company is in growing stage as most of its ratios are favorable from the earlier year
ended on 30 June, 2016, as in the last year, the company was having a net loss of $2,347 mn
whereas in the current year, the company has managed to make a profit of $1593.4. It shows that
the company is on a good path.
(e) The company is also providing dividends to its shareholders, the dividend payout ratio has been
0.62% in current year whereas the dividend yield is 2.67% which shows that company is
providing 2.67% of market price of share as dividend.
CONCLUSION
So, all the above factors indicate that the company is a good investment opportunity for potential
investors and the investors should invest to earn a good return on their money.
⊘ This is a preview!⊘
Do you want full access?
Subscribe today to unlock all pages.
Trusted by 1+ million students worldwide
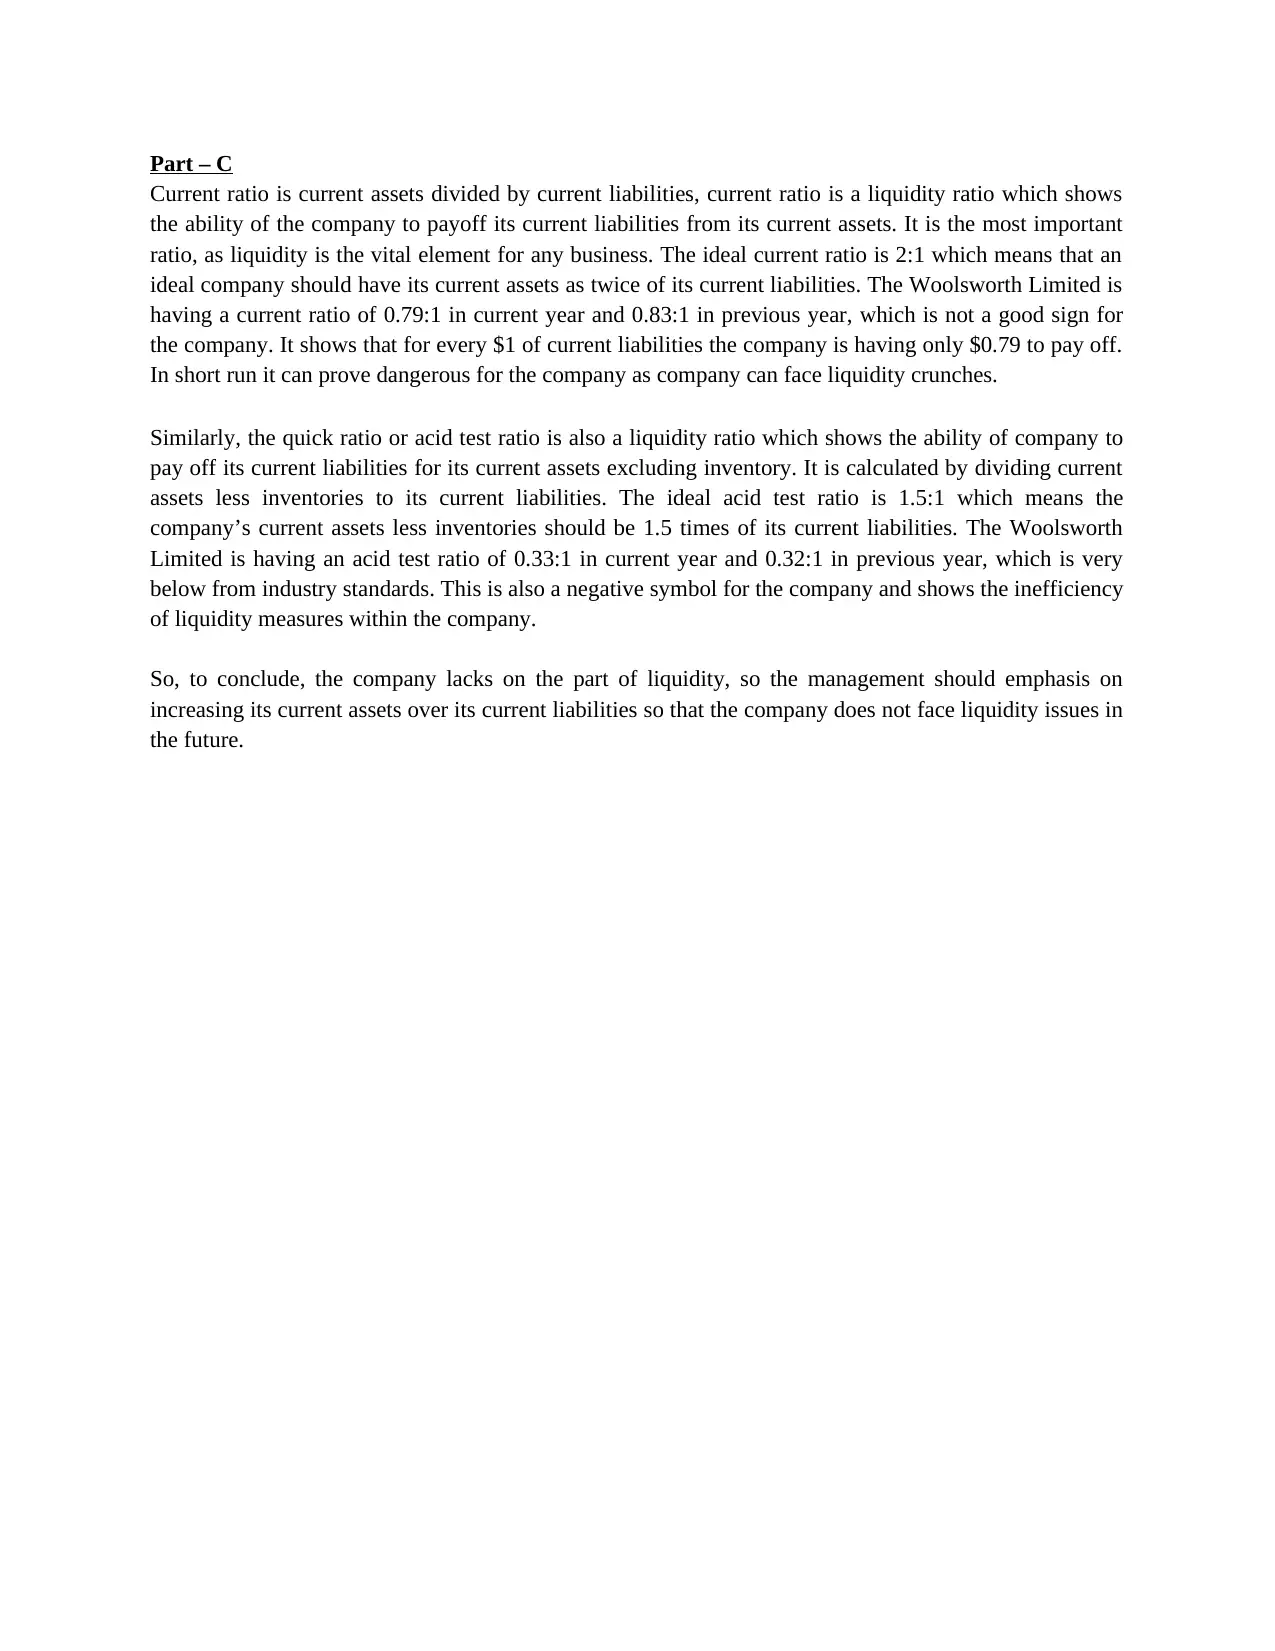
Part – C
Current ratio is current assets divided by current liabilities, current ratio is a liquidity ratio which shows
the ability of the company to payoff its current liabilities from its current assets. It is the most important
ratio, as liquidity is the vital element for any business. The ideal current ratio is 2:1 which means that an
ideal company should have its current assets as twice of its current liabilities. The Woolsworth Limited is
having a current ratio of 0.79:1 in current year and 0.83:1 in previous year, which is not a good sign for
the company. It shows that for every $1 of current liabilities the company is having only $0.79 to pay off.
In short run it can prove dangerous for the company as company can face liquidity crunches.
Similarly, the quick ratio or acid test ratio is also a liquidity ratio which shows the ability of company to
pay off its current liabilities for its current assets excluding inventory. It is calculated by dividing current
assets less inventories to its current liabilities. The ideal acid test ratio is 1.5:1 which means the
company’s current assets less inventories should be 1.5 times of its current liabilities. The Woolsworth
Limited is having an acid test ratio of 0.33:1 in current year and 0.32:1 in previous year, which is very
below from industry standards. This is also a negative symbol for the company and shows the inefficiency
of liquidity measures within the company.
So, to conclude, the company lacks on the part of liquidity, so the management should emphasis on
increasing its current assets over its current liabilities so that the company does not face liquidity issues in
the future.
Paraphrase This Document
Need a fresh take? Get an instant paraphrase of this document with our AI Paraphraser
Solution-3
The stated note deals with the situation when any entity is acquired whose functional currency is different
from ours functional currency. In such a scenario, to prepare the financial statements or to record the
above transaction in our books, we need to translate the amount involved into our functional currency.
For this translation into our functional currency i.e. Australian dollars, the exchange rate as on the date of
reporting of financials is considered. Similarly, to record the income and expenses of above acquired
entity the exchange rates on the date of transactions are considered.
The resultant exchange difference arising due to above conversion is reported in the statement of
comprehensive income under the heading foreign exchange differences. These differences arise because
of fluctuation in the exchange rates over the time span. For example, the company acquired a subsidiary
in the FY 2016-17 for 10,000 USD when the USD was trading at 60 and Australian dollar was trading at
50. At the reporting date, i.e. on 30 June, 2017, the USD was at 62 and Australian dollar was at 49. Now,
due to this change, the company has incurred a loss, this loss is known as exchange difference and is
reported as stated above.
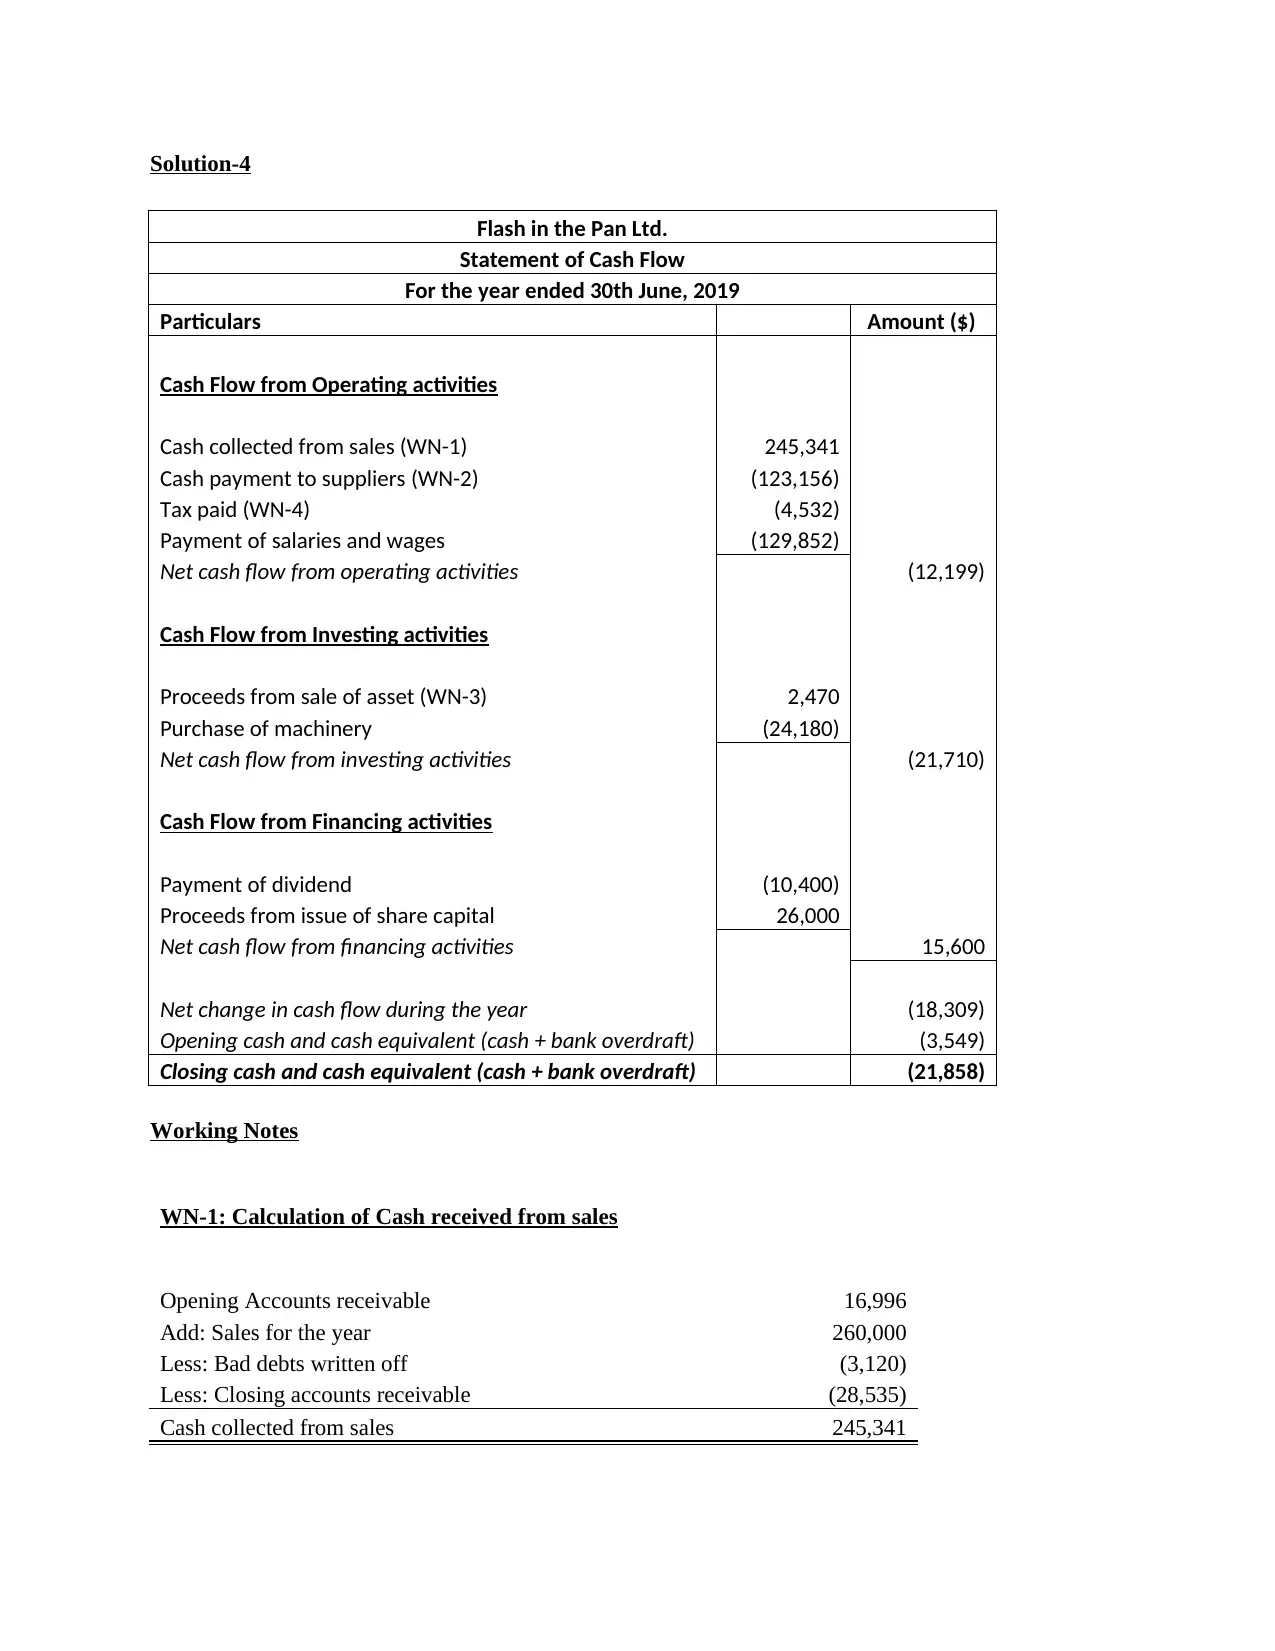
Solution-4
Flash in the Pan Ltd.
Statement of Cash Flow
For the year ended 30th June, 2019
Particulars Amount ($)
Cash Flow from Operating activities
Cash collected from sales (WN-1) 245,341
Cash payment to suppliers (WN-2) (123,156)
Tax paid (WN-4) (4,532)
Payment of salaries and wages (129,852)
Net cash flow from operating activities (12,199)
Cash Flow from Investing activities
Proceeds from sale of asset (WN-3) 2,470
Purchase of machinery (24,180)
Net cash flow from investing activities (21,710)
Cash Flow from Financing activities
Payment of dividend (10,400)
Proceeds from issue of share capital 26,000
Net cash flow from financing activities 15,600
Net change in cash flow during the year (18,309)
Opening cash and cash equivalent (cash + bank overdraft) (3,549)
Closing cash and cash equivalent (cash + bank overdraft) (21,858)
Working Notes
WN-1: Calculation of Cash received from sales
Opening Accounts receivable 16,996
Add: Sales for the year 260,000
Less: Bad debts written off (3,120)
Less: Closing accounts receivable (28,535)
Cash collected from sales 245,341
⊘ This is a preview!⊘
Do you want full access?
Subscribe today to unlock all pages.
Trusted by 1+ million students worldwide
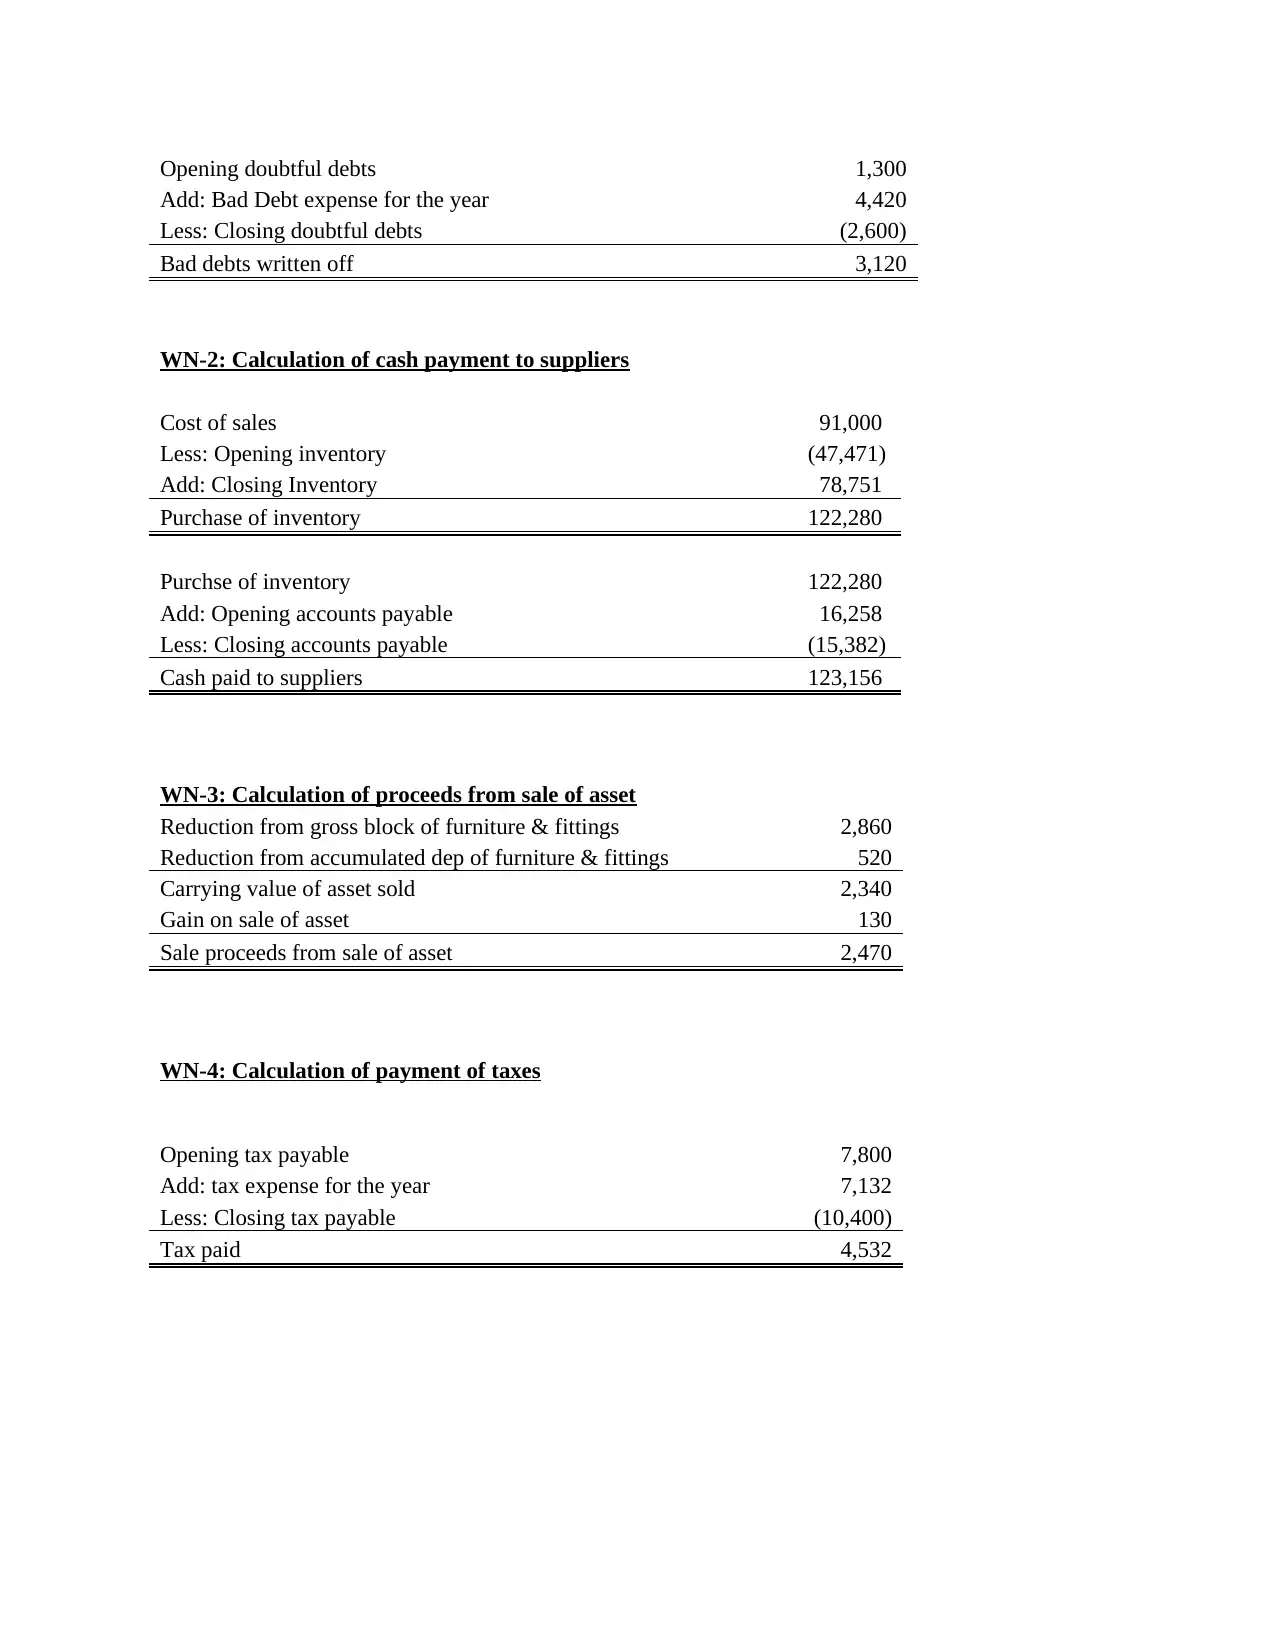
Opening doubtful debts 1,300
Add: Bad Debt expense for the year 4,420
Less: Closing doubtful debts (2,600)
Bad debts written off 3,120
WN-2: Calculation of cash payment to suppliers
Cost of sales 91,000
Less: Opening inventory (47,471)
Add: Closing Inventory 78,751
Purchase of inventory 122,280
Purchse of inventory 122,280
Add: Opening accounts payable 16,258
Less: Closing accounts payable (15,382)
Cash paid to suppliers 123,156
WN-3: Calculation of proceeds from sale of asset
Reduction from gross block of furniture & fittings 2,860
Reduction from accumulated dep of furniture & fittings 520
Carrying value of asset sold 2,340
Gain on sale of asset 130
Sale proceeds from sale of asset 2,470
WN-4: Calculation of payment of taxes
Opening tax payable 7,800
Add: tax expense for the year 7,132
Less: Closing tax payable (10,400)
Tax paid 4,532
Paraphrase This Document
Need a fresh take? Get an instant paraphrase of this document with our AI Paraphraser
References:
Aasb.gov.au. (2018). Impairment of Assets. [online] Available at:
http://www.aasb.gov.au/admin/file/content102/c3/AASB136_07-04_ERDRjun10_07-09.pdf
[Accessed 26 Apr. 2018].
Aasb.gov.au. (2018). Impairment of Assets. [online] Available at:
http://www.aasb.gov.au/admin/file/content102/c3/AASB136_07-04_ERDRjun10_07-09.pdf
[Accessed 26 Apr. 2018].
1 out of 11
Related Documents


Your All-in-One AI-Powered Toolkit for Academic Success.
+13062052269
info@desklib.com
Available 24*7 on WhatsApp / Email
![[object Object]](/_next/static/media/star-bottom.7253800d.svg)
Unlock your academic potential
Copyright © 2020–2026 A2Z Services. All Rights Reserved. Developed and managed by ZUCOL.