Detailed Financial Analysis Report on Abacus Property Group
VerifiedAdded on 2021/06/17
|20
|4409
|46
Report
AI Summary
This report provides a comprehensive financial analysis of Abacus Property Group, examining its financial position, ownership structure, and governance. It includes calculations of key financial ratios such as short-term and long-term solvency, asset utilization, profitability, and market value ratios for 2016 and 2017. The report also presents a graphical analysis of the company's share price movement, comparing it to the All Ords Index and identifying factors influencing stock price fluctuations. Furthermore, it calculates the beta values, required rate of return, and Weighted Average Cost of Capital (WACC), assessing the company's debt ratio and dividend policy. The report concludes with investment recommendations for potential investors, offering a detailed overview of Abacus Property Group's financial health and prospects.
Running head: FINANCE FOR BUSINESS-MASTERS
Finance for Business
Name of the Student
Name of the University
Authors Note
Couse ID
Finance for Business
Name of the Student
Name of the University
Authors Note
Couse ID
Paraphrase This Document
Need a fresh take? Get an instant paraphrase of this document with our AI Paraphraser
1FINANCE FOR BUSINESS-MASTERS
Table of Contents
Introduction:...............................................................................................................................2
Description of the company:......................................................................................................3
Ownership governance structure:...............................................................................................4
Main substantial shareholders:...............................................................................................4
Main people involved in firm Governance:...........................................................................5
Fundamental Calculations of Ratios:.........................................................................................6
Short Term Solvency Ratios:.................................................................................................6
Long Term Solvency Ratios:.................................................................................................6
Asset Utilisation Ratios:.........................................................................................................7
Profitability Ratios:................................................................................................................7
Market Value Ratios:.............................................................................................................7
Graphical Description of Share Price Results:...........................................................................8
Share Price Movement Analysis:...........................................................................................8
Comparative Analysis of the Share Price Movement against the All Ords Index:....................8
Factors influencing the stock price movement of the company:..............................................10
Calculations of beta values and required rate of return:......................................................11
Calculations of Beta:................................................................................................................11
Calculations of required rate of return:....................................................................................11
Conservative for Investment:...............................................................................................11
WACC of the Company:..........................................................................................................12
2FINANCE FOR BUSINESS-MASTERS
Calculations of the WACC for the Company:.....................................................................12
Implications of higher WACC:............................................................................................12
Debt Ratio:...............................................................................................................................13
Dividend policy:.......................................................................................................................14
Letter of Recommendations:....................................................................................................14
Conclusion:..............................................................................................................................15
References................................................................................................................................16
⊘ This is a preview!⊘
Do you want full access?
Subscribe today to unlock all pages.
Trusted by 1+ million students worldwide
3FINANCE FOR BUSINESS-MASTERS
Introduction:
The business report is prepared to provide the probable investors with the detailed
understanding of the company financial environment. The business report would be based on
the Abacus Property Group to investigate and analyse the financial position of the company.
The basic objective of the report is to simplify the portfolio of the investors and provide them
with the appropriate recommendations regarding the viability of making investment in the
company.
The report would be providing the descriptive understanding of the company, the
market in which it operates and the major products in which it deals. Furthermore, an
identification of the company corporate ownership structure along with main people that are
involved in the governance of the organization would be provided. The report would further
accompany the computation of significant ratios to understand the overall financial health of
the Abacus Group Property.
A graphical plot would be developed to understand the movement in the share price of
the company against the all ordinary index. Further reference would also be made towards the
major factors that create an influence in the share price of the company. For any making any
investment investors usually prefers the required rate of return of an entity. Likewise, the
report would also provide the understanding of the WACC and calculate the required rate of
return for the Abacus Property Group by employing the tools of weighted average cost of
capital.
A look into the dividend and debt structure of the Abacus Property Group would also
be made to understand the viability of the making investment. Finally the report would be
following the letter of recommendations for the potential investors regarding the prospects of
making investment in the Abacus Group Property.
Paraphrase This Document
Need a fresh take? Get an instant paraphrase of this document with our AI Paraphraser
4FINANCE FOR BUSINESS-MASTERS
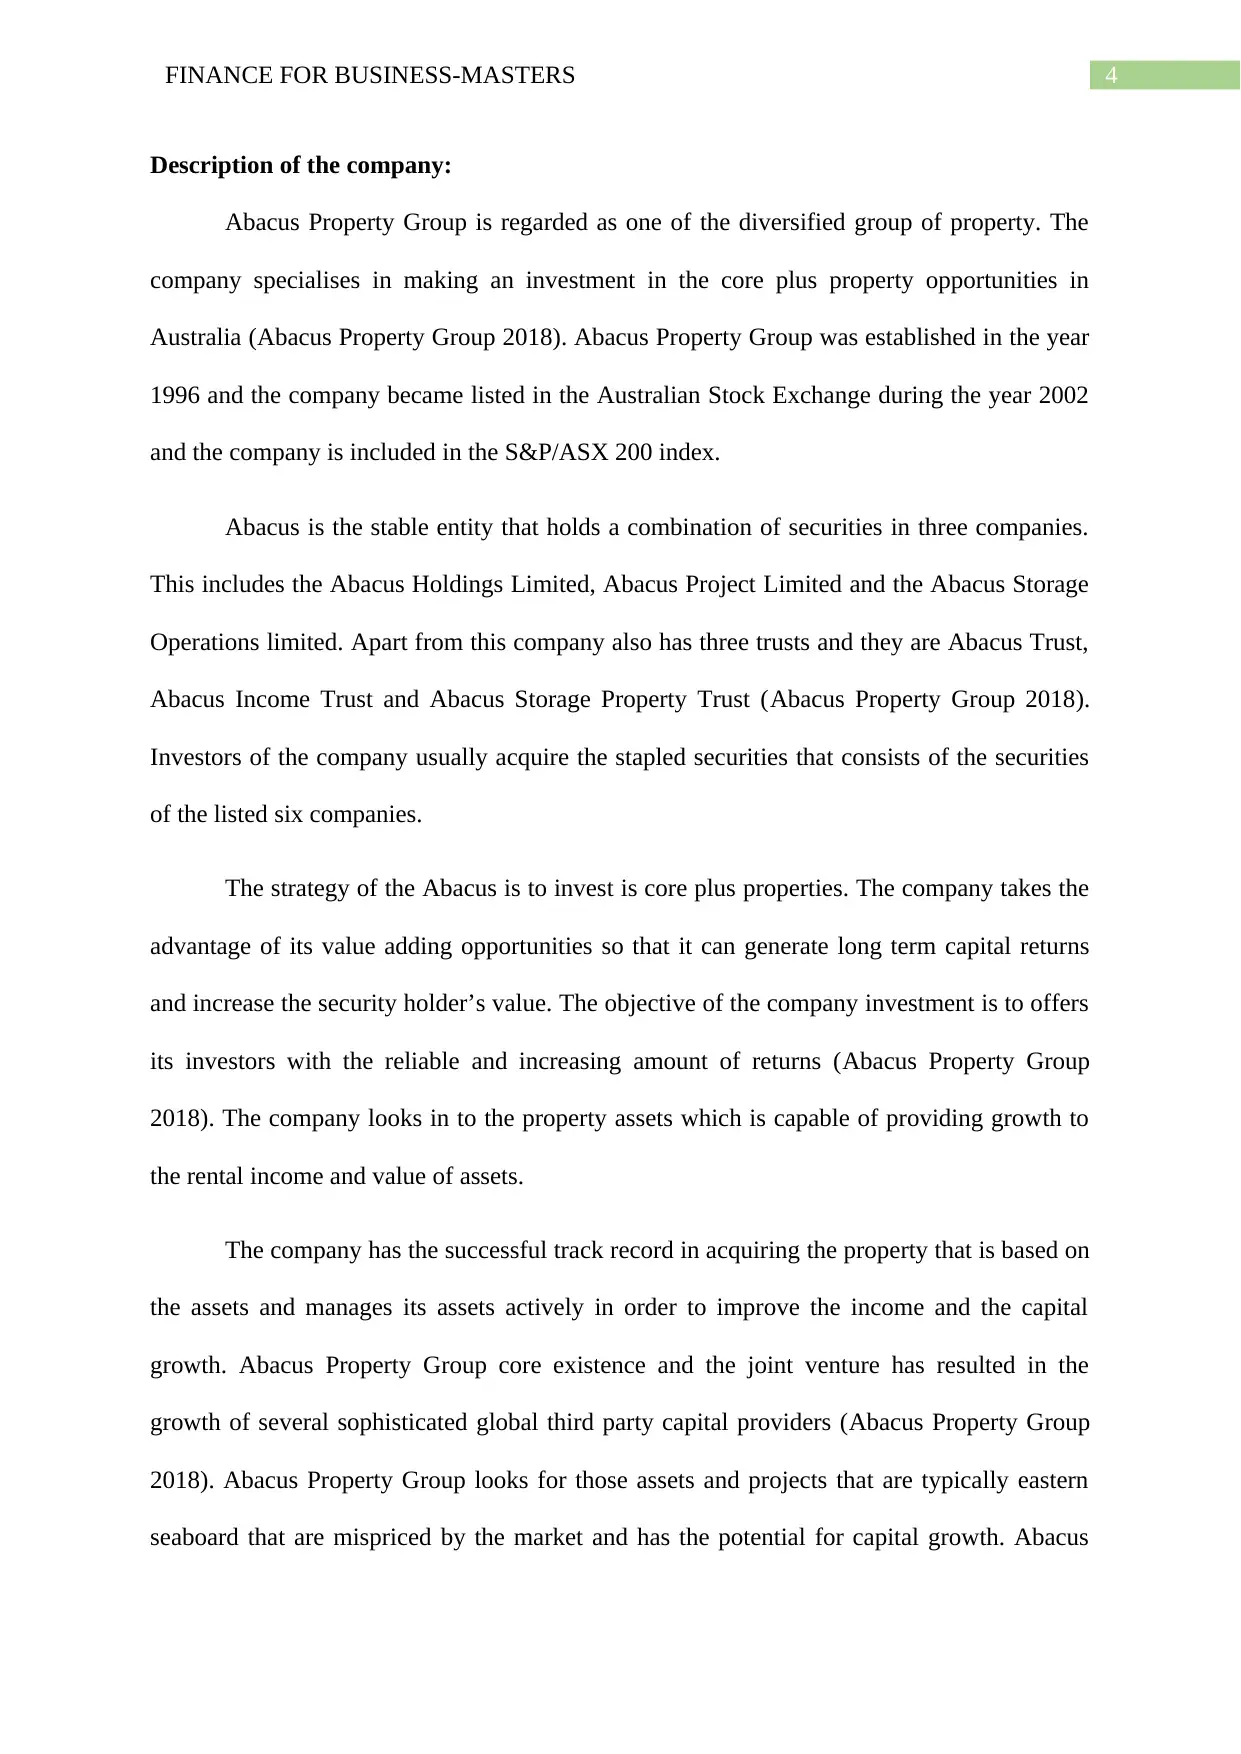
Description of the company:
Abacus Property Group is regarded as one of the diversified group of property. The
company specialises in making an investment in the core plus property opportunities in
Australia (Abacus Property Group 2018). Abacus Property Group was established in the year
1996 and the company became listed in the Australian Stock Exchange during the year 2002
and the company is included in the S&P/ASX 200 index.
Abacus is the stable entity that holds a combination of securities in three companies.
This includes the Abacus Holdings Limited, Abacus Project Limited and the Abacus Storage
Operations limited. Apart from this company also has three trusts and they are Abacus Trust,
Abacus Income Trust and Abacus Storage Property Trust (Abacus Property Group 2018).
Investors of the company usually acquire the stapled securities that consists of the securities
of the listed six companies.
The strategy of the Abacus is to invest is core plus properties. The company takes the
advantage of its value adding opportunities so that it can generate long term capital returns
and increase the security holder’s value. The objective of the company investment is to offers
its investors with the reliable and increasing amount of returns (Abacus Property Group
2018). The company looks in to the property assets which is capable of providing growth to
the rental income and value of assets.
The company has the successful track record in acquiring the property that is based on
the assets and manages its assets actively in order to improve the income and the capital
growth. Abacus Property Group core existence and the joint venture has resulted in the
growth of several sophisticated global third party capital providers (Abacus Property Group
2018). Abacus Property Group looks for those assets and projects that are typically eastern
seaboard that are mispriced by the market and has the potential for capital growth. Abacus
5FINANCE FOR BUSINESS-MASTERS
Property Group participates in wide range of projects by combining its capital and property
expertise with the regional and sector specific experts to grow its business. By the year ended
June 2017 the company reported a total of $448 million in the form of development and
financing projects in its balance sheet.
Ownership governance structure:
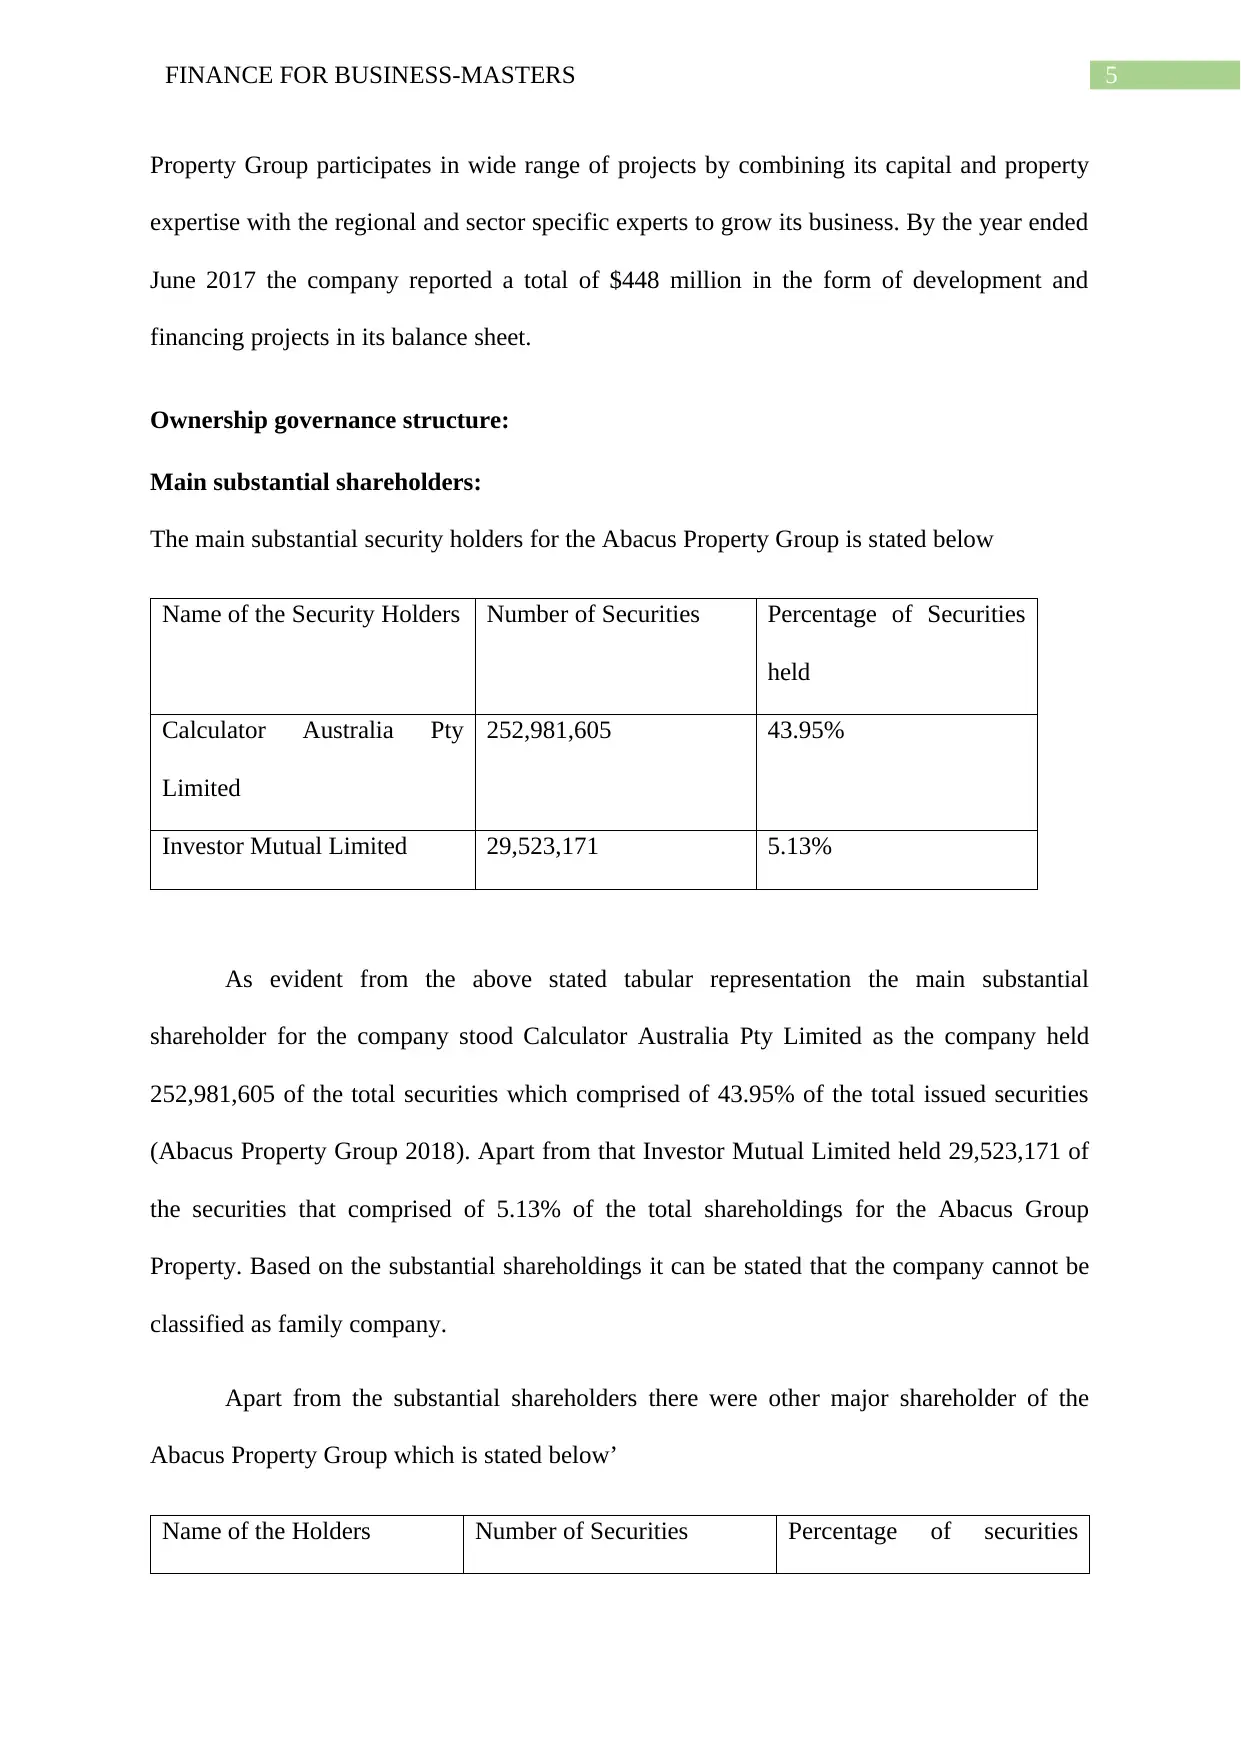
Main substantial shareholders:
The main substantial security holders for the Abacus Property Group is stated below
Name of the Security Holders Number of Securities Percentage of Securities
held
Calculator Australia Pty
Limited
252,981,605 43.95%
Investor Mutual Limited 29,523,171 5.13%
As evident from the above stated tabular representation the main substantial
shareholder for the company stood Calculator Australia Pty Limited as the company held
252,981,605 of the total securities which comprised of 43.95% of the total issued securities
(Abacus Property Group 2018). Apart from that Investor Mutual Limited held 29,523,171 of
the securities that comprised of 5.13% of the total shareholdings for the Abacus Group
Property. Based on the substantial shareholdings it can be stated that the company cannot be
classified as family company.
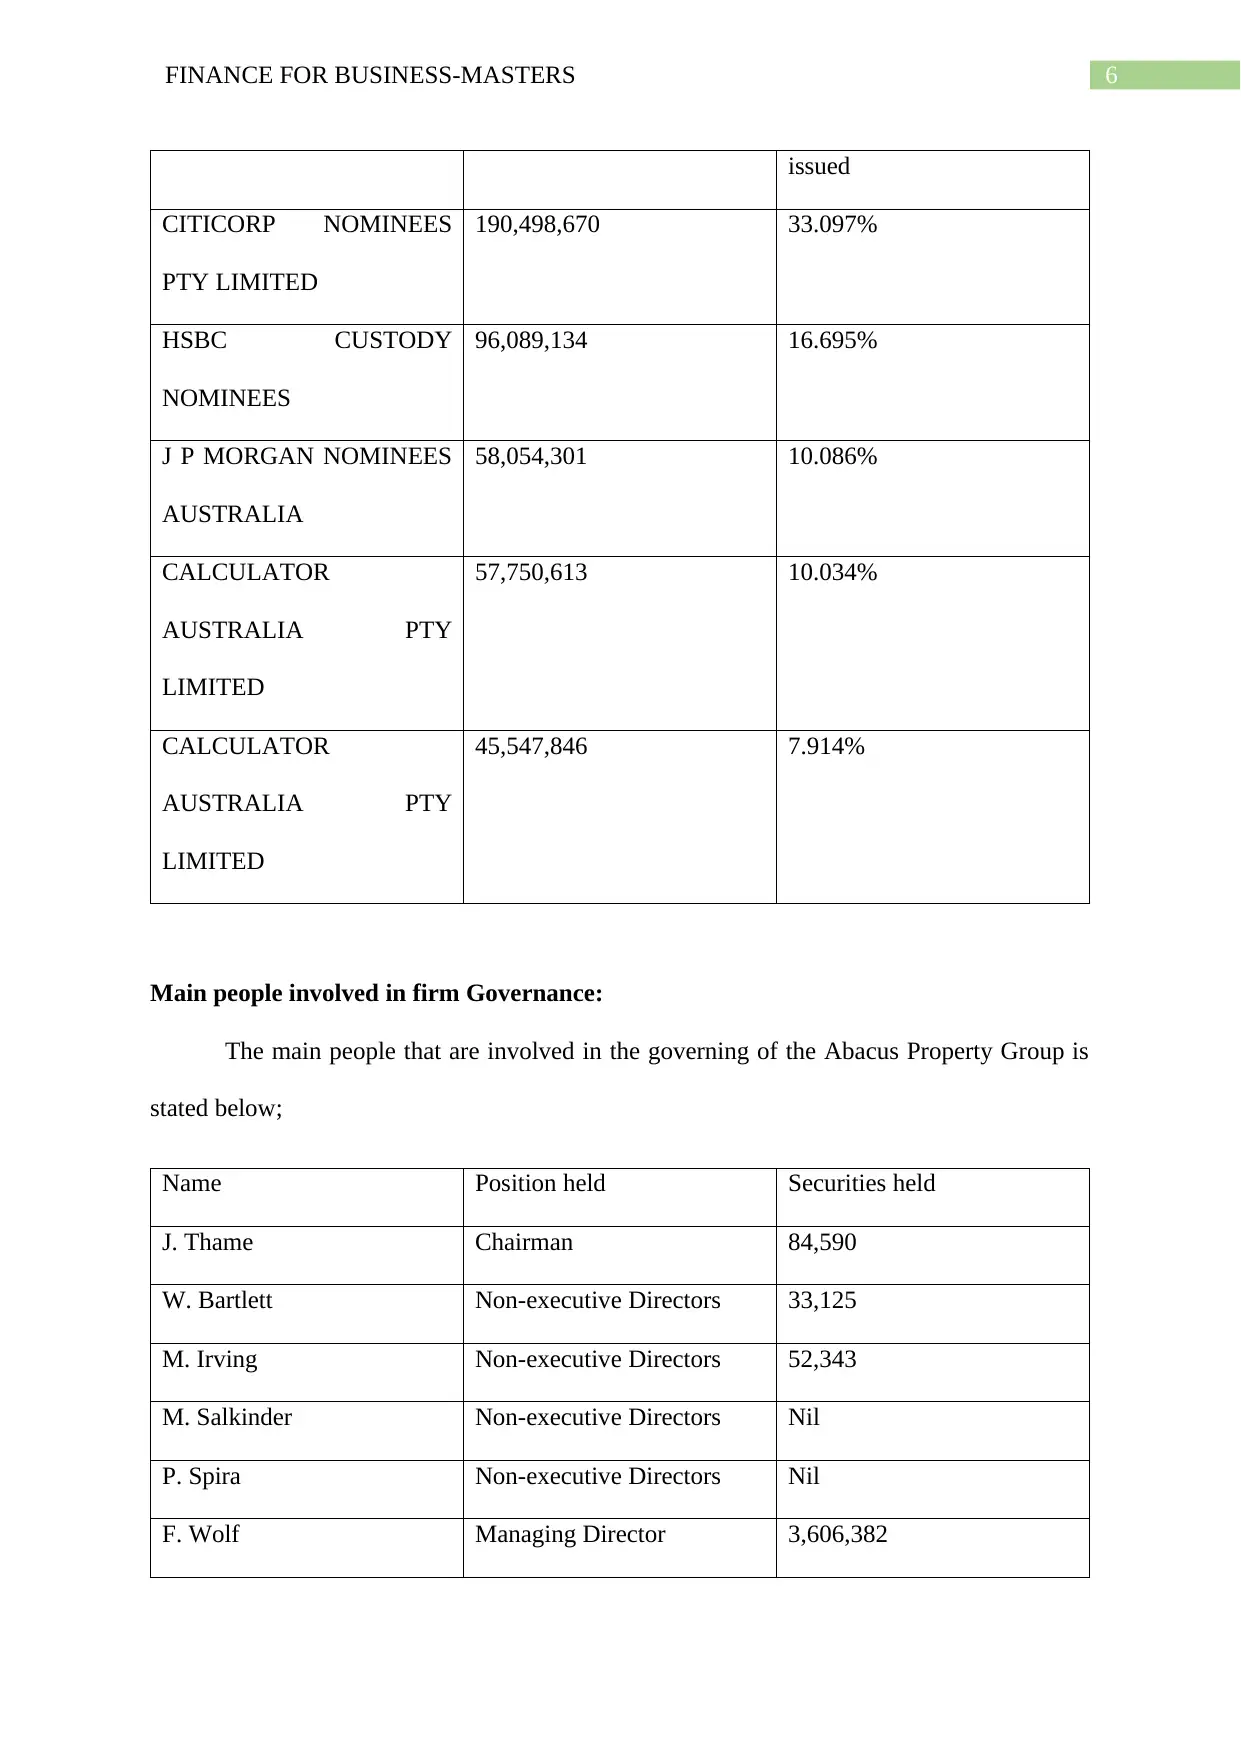
Apart from the substantial shareholders there were other major shareholder of the
Abacus Property Group which is stated below’
Name of the Holders Number of Securities Percentage of securities
Property Group participates in wide range of projects by combining its capital and property
expertise with the regional and sector specific experts to grow its business. By the year ended
June 2017 the company reported a total of $448 million in the form of development and
financing projects in its balance sheet.
Ownership governance structure:
Main substantial shareholders:
The main substantial security holders for the Abacus Property Group is stated below
Name of the Security Holders Number of Securities Percentage of Securities
held
Calculator Australia Pty
Limited
252,981,605 43.95%
Investor Mutual Limited 29,523,171 5.13%
As evident from the above stated tabular representation the main substantial
shareholder for the company stood Calculator Australia Pty Limited as the company held
252,981,605 of the total securities which comprised of 43.95% of the total issued securities
(Abacus Property Group 2018). Apart from that Investor Mutual Limited held 29,523,171 of
the securities that comprised of 5.13% of the total shareholdings for the Abacus Group
Property. Based on the substantial shareholdings it can be stated that the company cannot be
classified as family company.
Apart from the substantial shareholders there were other major shareholder of the
Abacus Property Group which is stated below’
Name of the Holders Number of Securities Percentage of securities
⊘ This is a preview!⊘
Do you want full access?
Subscribe today to unlock all pages.
Trusted by 1+ million students worldwide
6FINANCE FOR BUSINESS-MASTERS
issued
CITICORP NOMINEES
PTY LIMITED
190,498,670 33.097%
HSBC CUSTODY
NOMINEES
96,089,134 16.695%
J P MORGAN NOMINEES
AUSTRALIA
58,054,301 10.086%
CALCULATOR
AUSTRALIA PTY
LIMITED
57,750,613 10.034%
CALCULATOR
AUSTRALIA PTY
LIMITED
45,547,846 7.914%
Main people involved in firm Governance:
The main people that are involved in the governing of the Abacus Property Group is
stated below;
Name Position held Securities held
J. Thame Chairman 84,590
W. Bartlett Non-executive Directors 33,125
M. Irving Non-executive Directors 52,343
M. Salkinder Non-executive Directors Nil
P. Spira Non-executive Directors Nil
F. Wolf Managing Director 3,606,382
Paraphrase This Document
Need a fresh take? Get an instant paraphrase of this document with our AI Paraphraser
7FINANCE FOR BUSINESS-MASTERS
R. Baulderstone Chief Financial Officer Nil
C. Laird Director Property
Development
Nil
P. Strain Director Property
Investments
Nil
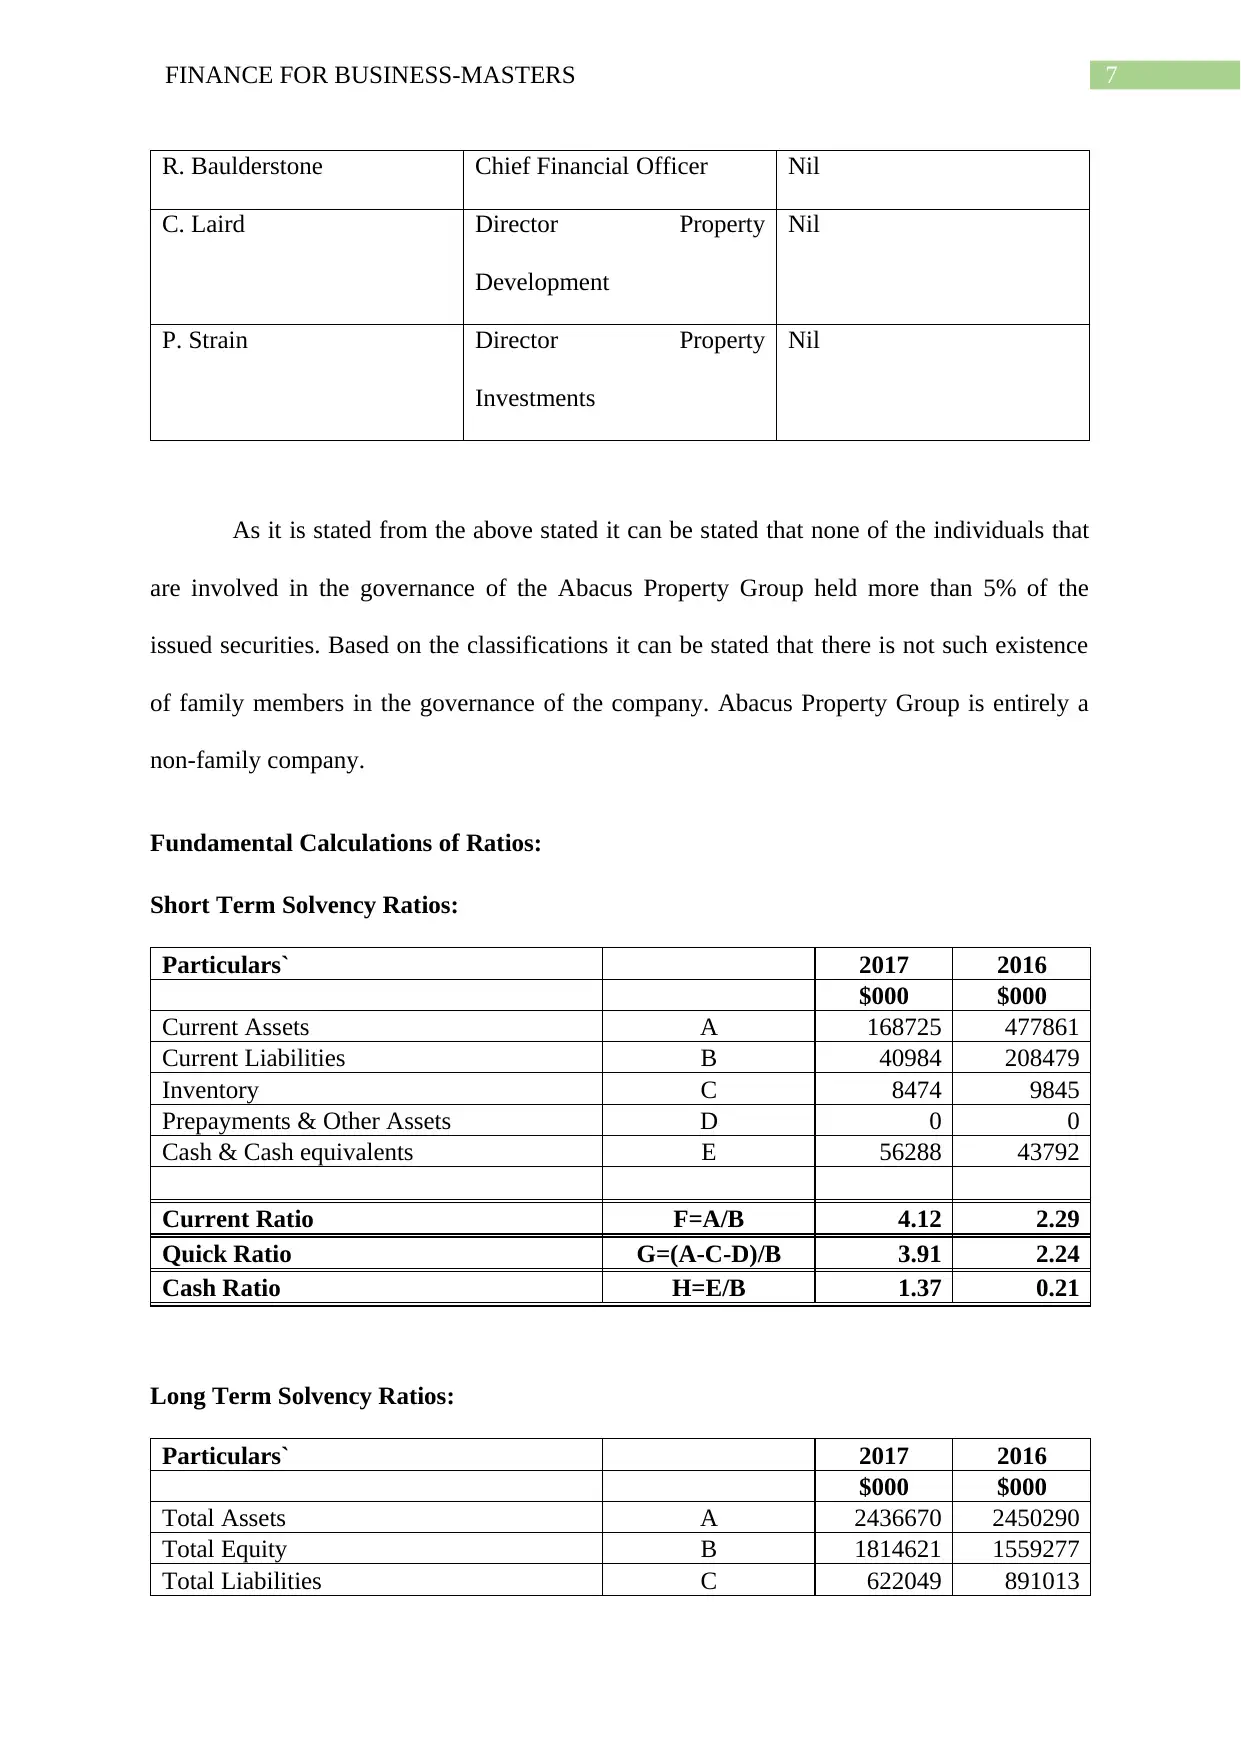
As it is stated from the above stated it can be stated that none of the individuals that
are involved in the governance of the Abacus Property Group held more than 5% of the
issued securities. Based on the classifications it can be stated that there is not such existence
of family members in the governance of the company. Abacus Property Group is entirely a
non-family company.
Fundamental Calculations of Ratios:
Short Term Solvency Ratios:
Particulars` 2017 2016
$000 $000
Current Assets A 168725 477861
Current Liabilities B 40984 208479
Inventory C 8474 9845
Prepayments & Other Assets D 0 0
Cash & Cash equivalents E 56288 43792
Current Ratio F=A/B 4.12 2.29
Quick Ratio G=(A-C-D)/B 3.91 2.24
Cash Ratio H=E/B 1.37 0.21
Long Term Solvency Ratios:
Particulars` 2017 2016
$000 $000
Total Assets A 2436670 2450290
Total Equity B 1814621 1559277
Total Liabilities C 622049 891013
R. Baulderstone Chief Financial Officer Nil
C. Laird Director Property
Development
Nil
P. Strain Director Property
Investments
Nil
As it is stated from the above stated it can be stated that none of the individuals that
are involved in the governance of the Abacus Property Group held more than 5% of the
issued securities. Based on the classifications it can be stated that there is not such existence
of family members in the governance of the company. Abacus Property Group is entirely a
non-family company.
Fundamental Calculations of Ratios:
Short Term Solvency Ratios:
Particulars` 2017 2016
$000 $000
Current Assets A 168725 477861
Current Liabilities B 40984 208479
Inventory C 8474 9845
Prepayments & Other Assets D 0 0
Cash & Cash equivalents E 56288 43792
Current Ratio F=A/B 4.12 2.29
Quick Ratio G=(A-C-D)/B 3.91 2.24
Cash Ratio H=E/B 1.37 0.21
Long Term Solvency Ratios:
Particulars` 2017 2016
$000 $000
Total Assets A 2436670 2450290
Total Equity B 1814621 1559277
Total Liabilities C 622049 891013
8FINANCE FOR BUSINESS-MASTERS
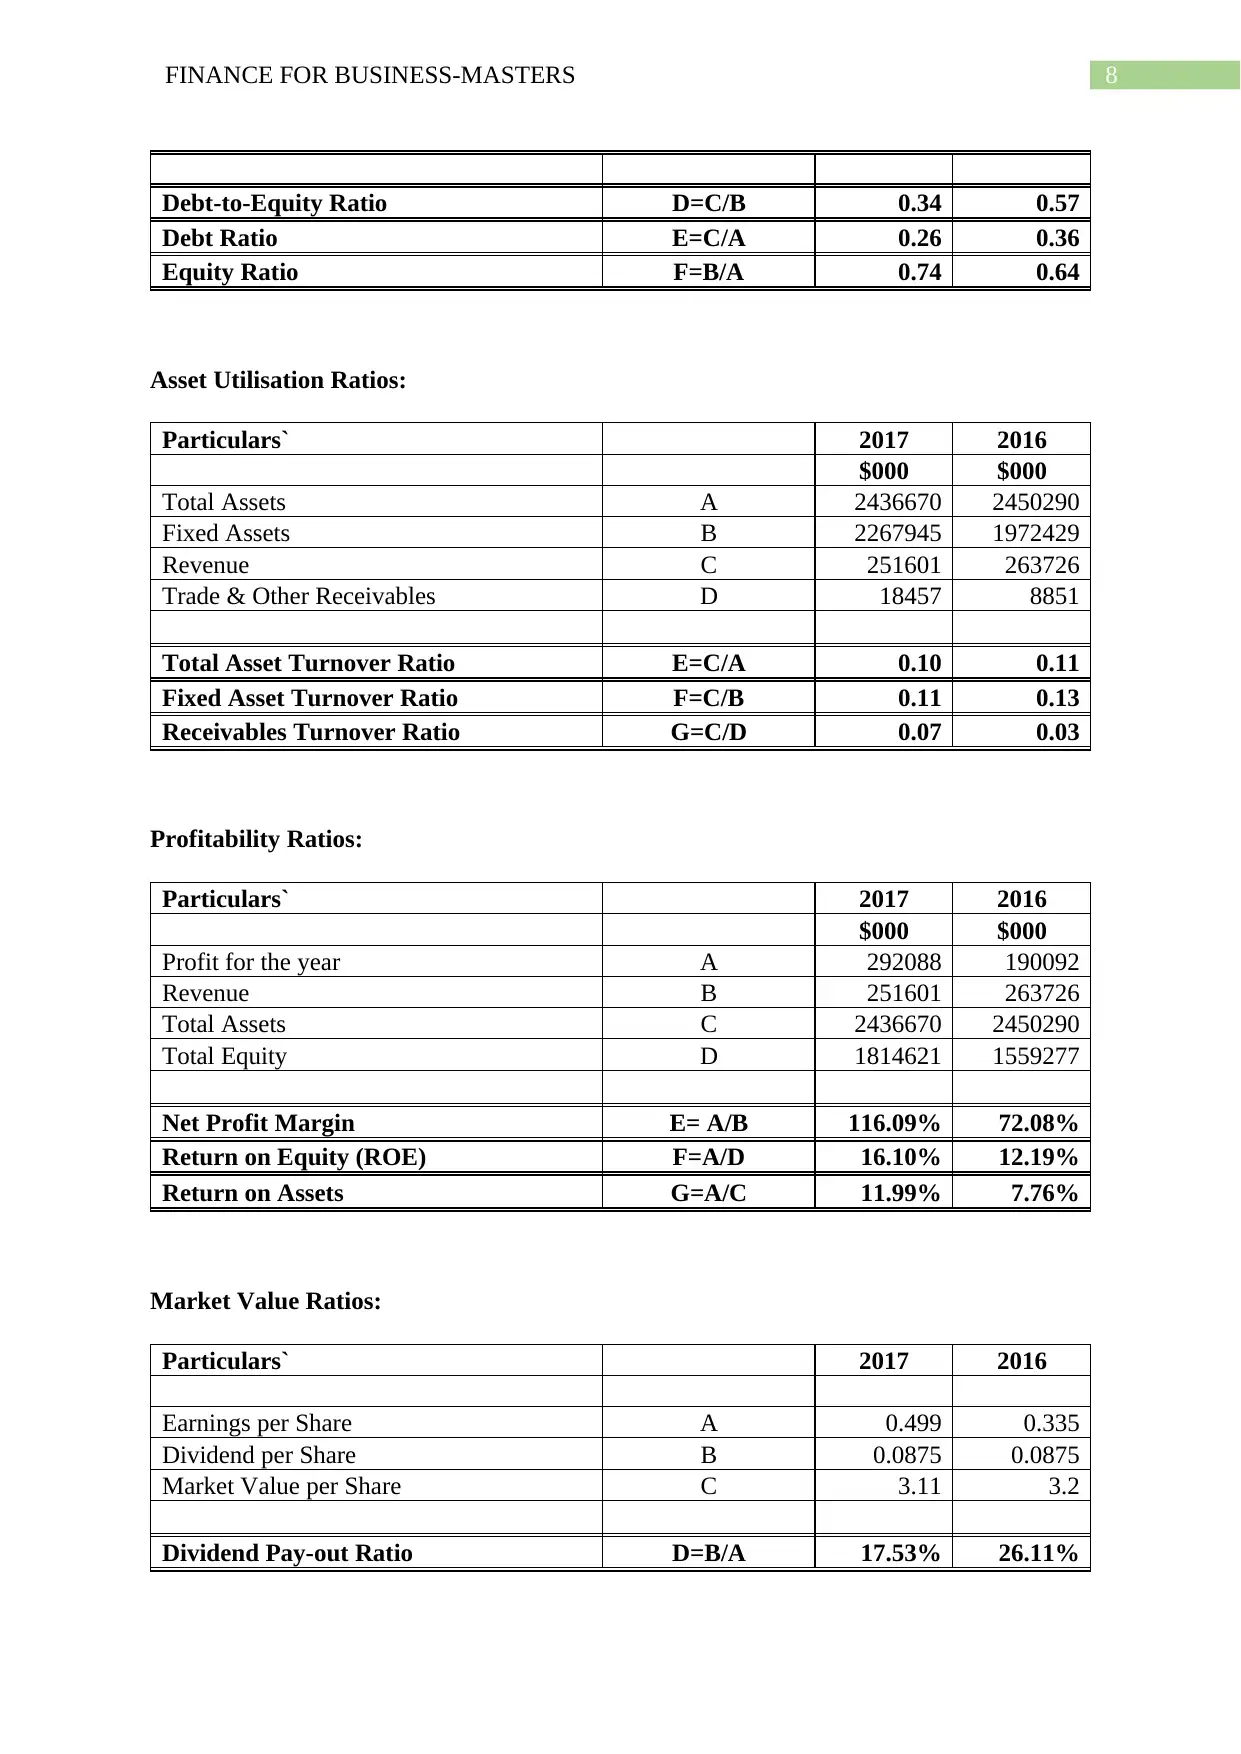
Debt-to-Equity Ratio D=C/B 0.34 0.57
Debt Ratio E=C/A 0.26 0.36
Equity Ratio F=B/A 0.74 0.64
Asset Utilisation Ratios:
Particulars` 2017 2016
$000 $000
Total Assets A 2436670 2450290
Fixed Assets B 2267945 1972429
Revenue C 251601 263726
Trade & Other Receivables D 18457 8851
Total Asset Turnover Ratio E=C/A 0.10 0.11
Fixed Asset Turnover Ratio F=C/B 0.11 0.13
Receivables Turnover Ratio G=C/D 0.07 0.03
Profitability Ratios:
Particulars` 2017 2016
$000 $000
Profit for the year A 292088 190092
Revenue B 251601 263726
Total Assets C 2436670 2450290
Total Equity D 1814621 1559277
Net Profit Margin E= A/B 116.09% 72.08%
Return on Equity (ROE) F=A/D 16.10% 12.19%
Return on Assets G=A/C 11.99% 7.76%
Market Value Ratios:
Particulars` 2017 2016
Earnings per Share A 0.499 0.335
Dividend per Share B 0.0875 0.0875
Market Value per Share C 3.11 3.2
Dividend Pay-out Ratio D=B/A 17.53% 26.11%
⊘ This is a preview!⊘
Do you want full access?
Subscribe today to unlock all pages.
Trusted by 1+ million students worldwide
9FINANCE FOR BUSINESS-MASTERS
Dividend Yield Rate E=B/C 2.81% 2.76%
Price-to-Earnings Ratio F=C/A 6.23 9.46
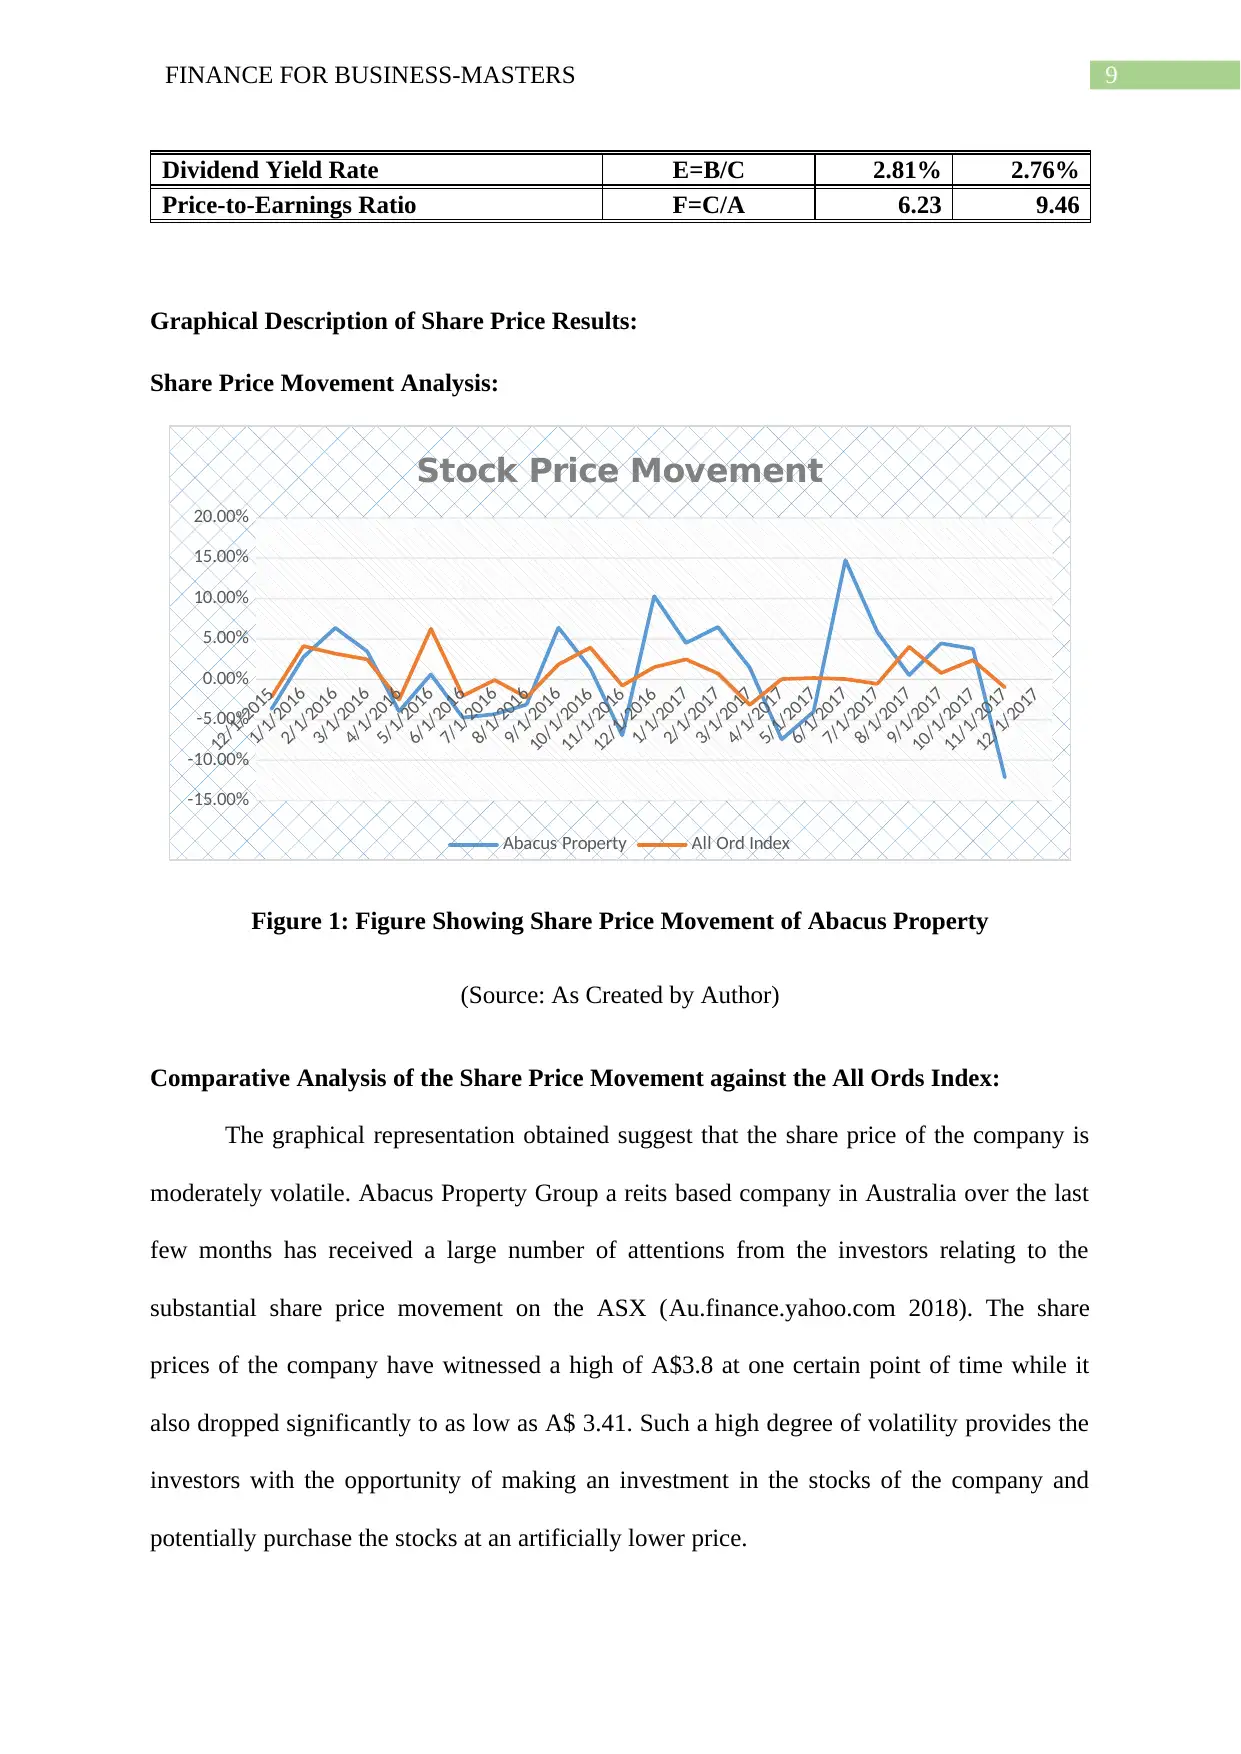
Graphical Description of Share Price Results:
Share Price Movement Analysis:
12/1/2015
1/1/2016
2/1/2016
3/1/2016
4/1/2016
5/1/2016
6/1/2016
7/1/2016
8/1/2016
9/1/2016
10/1/2016
11/1/2016
12/1/2016
1/1/2017
2/1/2017
3/1/2017
4/1/2017
5/1/2017
6/1/2017
7/1/2017
8/1/2017
9/1/2017
10/1/2017
11/1/2017
12/1/2017
-15.00%
-10.00%
-5.00%
0.00%
5.00%
10.00%
15.00%
20.00%
Stock Price Movement
Abacus Property All Ord Index
Figure 1: Figure Showing Share Price Movement of Abacus Property
(Source: As Created by Author)
Comparative Analysis of the Share Price Movement against the All Ords Index:
The graphical representation obtained suggest that the share price of the company is
moderately volatile. Abacus Property Group a reits based company in Australia over the last
few months has received a large number of attentions from the investors relating to the
substantial share price movement on the ASX (Au.finance.yahoo.com 2018). The share
prices of the company have witnessed a high of A$3.8 at one certain point of time while it
also dropped significantly to as low as A$ 3.41. Such a high degree of volatility provides the
investors with the opportunity of making an investment in the stocks of the company and
potentially purchase the stocks at an artificially lower price.
Dividend Yield Rate E=B/C 2.81% 2.76%
Price-to-Earnings Ratio F=C/A 6.23 9.46
Graphical Description of Share Price Results:
Share Price Movement Analysis:
12/1/2015
1/1/2016
2/1/2016
3/1/2016
4/1/2016
5/1/2016
6/1/2016
7/1/2016
8/1/2016
9/1/2016
10/1/2016
11/1/2016
12/1/2016
1/1/2017
2/1/2017
3/1/2017
4/1/2017
5/1/2017
6/1/2017
7/1/2017
8/1/2017
9/1/2017
10/1/2017
11/1/2017
12/1/2017
-15.00%
-10.00%
-5.00%
0.00%
5.00%
10.00%
15.00%
20.00%
Stock Price Movement
Abacus Property All Ord Index
Figure 1: Figure Showing Share Price Movement of Abacus Property
(Source: As Created by Author)
Comparative Analysis of the Share Price Movement against the All Ords Index:
The graphical representation obtained suggest that the share price of the company is
moderately volatile. Abacus Property Group a reits based company in Australia over the last
few months has received a large number of attentions from the investors relating to the
substantial share price movement on the ASX (Au.finance.yahoo.com 2018). The share
prices of the company have witnessed a high of A$3.8 at one certain point of time while it
also dropped significantly to as low as A$ 3.41. Such a high degree of volatility provides the
investors with the opportunity of making an investment in the stocks of the company and
potentially purchase the stocks at an artificially lower price.
Paraphrase This Document
Need a fresh take? Get an instant paraphrase of this document with our AI Paraphraser
10FINANCE FOR BUSINESS-MASTERS
As evident from the stock price movement of the company during the opening quarter
of January 2016 with a negative price movement of -3.65% against the negatively standing
all ordinary index of -2.15 (Editorial 2018). However, Abacus Property Group ended the first
quarter on a positive note and reported a positive movement in its stock price of 6.38%
against the lowly all ordinary index of 3.19%. Similarly, in the following months of May the
stock price movement of Abacus Property Group reflected a negative movement with the
stock price declining negatively to stand at -3.96.
Moving towards the next quarter of September the company reported a higher
volatility in its stock price as the stock continued to trade negatively throughout the
penultimate quarter of 2016 (Finance.yahoo.com 2018). Though in the opening final quarter
of 2016 reflected a positive movement in the share price but Abacus Property Group ended
the final quarter reporting a negative stock price movement of -6.95% being the highest dip in
the stock price through the year.
Moving fast forward to 2017 the share price of Abacus Property Group have
relatively reflected a less volatility and the stock price stood positively in the first month of
opening quarter. The stock price of Abacus Property Group stood positively at 10.32%
against the all ordinary index of 1.52%. Though the stock price reflects a decline in the later
months but did not reported a negative movement in its stock price (Hatcher 2018). The stock
price in the second quarter of June stood took further dive and closed negatively at -4.01 in
June with previous month low of -7.43%.
The stock price in the penultimate quarter gained significantly to stand at 14.76 in the
month of July which is highest in the last two financial years but took a nose dive to end in
the final quarter of 2017 (Zabarankin, Pavlikov and Uryasev 2014). Abacus Property Group
11FINANCE FOR BUSINESS-MASTERS
final quarter stock price stood negatively at 12.14% against the negatively standing all
ordinary index of -0.99.
The overall analysis of the stock price movement suggest that the company has
reported a moderately volatile movement in its stock price over the last two years. Except on
certain occasions the stock price for the Abacus Property Group stood positively and higher
than the all ordinary index (Barberies et al. 2015). The share of the Abacus Property Group is
currently undervalued and as the potential investors it might be a great time for increasing the
holdings of the stock.
Factors influencing the stock price movement of the company:
The major factor that create an influence in the share price movement of the company
is the changes in the forecast of the analyst (Evstigneev et al. 2015). The analyst forecast
suggest that the Abacus Property Group short term trend is upward rising and with the nearest
possible share price target of $3 (Mayes 2018). The share price of Abacus Property Group is
currently trending at $2.89 and given the trend stays reserved from this point forward the
future target price could be around $2.86.
The industry wide factors include the high rise demand for the properties in the
market. In the latest report of the Abacus Property Group suggest that the company has
experienced a sizeable tailwinds resulting in higher double digit earnings growth for the
company to stand at 53.37% (Mock 2018). The market analyst prospects have stated that in
the coming years they seem to be pessimistic about the earnings of the company since it has
declined to -33.30% (Merkl et al. 2016). The negative earnings of the company has
significantly created an impact on the share price of the company.
Another significant factors that creates an influence on the share price of the Abacus
Property Group is the impact is the competitors (Simply Wall St 2018). The company faces
⊘ This is a preview!⊘
Do you want full access?
Subscribe today to unlock all pages.
Trusted by 1+ million students worldwide
1 out of 20
Related Documents


Your All-in-One AI-Powered Toolkit for Academic Success.
+13062052269
info@desklib.com
Available 24*7 on WhatsApp / Email
![[object Object]](/_next/static/media/star-bottom.7253800d.svg)
Unlock your academic potential
Copyright © 2020–2026 A2Z Services. All Rights Reserved. Developed and managed by ZUCOL.