Analysis of Offshore Wind Turbine Tripod Foundation Using ABAQUS 2017
VerifiedAdded on 2023/06/11
|22
|5857
|368
Report
AI Summary
This report presents a finite element analysis (FEA) of an offshore wind turbine tripod caisson foundation using ABAQUS 2017, addressing the increasing need for renewable energy sources. The study investigates the load-bearing capacity of the foundation under sea wave and wind turbine loads, examining various deformation patterns. The design was developed using the CAE module, and the simulation process, along with the resulting data and graphs, are detailed. Different L/D ratios (1.000, 0.750, 0.500, and 0.250) and S/D ratios (1.0, 1.5, 2.0, 2.5, 3.0) were analyzed to assess their impact on load-bearing capacity. The report includes an introduction to offshore windmills and caisson foundations, objectives of the analysis, a description of numerical analysis methods, problem description, result discussion, and a conclusion. Figures and tables illustrate the tripod foundation's geometry, mesh, failure mechanisms, and the relationship between horizontal load and displacement.
Abstract
Due to the depletion of the fossil resources the whole world struggle to find the
alternative power resources. Windmills are the best suited renewable resource. In this system
there is a lot of research was going on to improve the effectiveness. Offshore wind turbine
technology was the latest technology. In this project, the offshore windmill turbine foundation
(Tripod Caisson foundation) was analyzed by using the ABAQUS 2017 FEA software tool. Here
the design of the system was developed by the CAE module. The loads are given to the system.
After that, the developed system was simulated using the Abaqus software and also the
maximum load bearing capability of the system under the sea wave load as well as wind turbine
loading was calculated. Various deformations in the system under the given constraint was
calculated as well as simulated. The various steps involved in the process of analyzing the
system by using the Abaqus software was described in the report. Various results generated by
the Abaqus software for the given constraints was showed in this report.
Paraphrase This Document
Need a fresh take? Get an instant paraphrase of this document with our AI Paraphraser
Table of Contents
1. Introduction............................................................................................................................4
2. Objectives................................................................................................................................6
3. Numerical analysis.................................................................................................................7
4. Problem Description.............................................................................................................13
5. Result Discussion..................................................................................................................14
6. Conclusion.............................................................................................................................20
Reference......................................................................................................................................21
Table of Figures
Figure 1 Offshore Windmill Structure with Tripod Foundation 4
Figure 2 Typical Tripod Foundation System 5
Figure 3 Stages of Numerical Analysis 8
Figure 4 Geometrical Features of the Tripod Foundation a) Side view; b) Top view 9
Figure 5 Bucket Orientation 10
Figure 6 Optimal Mesh Developed 11
Figure 3 Tripod design layout 14
Figure 4 Forces and moments involved in the foundation 14
Figure 7 Failure Mechanism in Horizontal Direction 15
Figure 8 Failure Mechanism in Vertical Direction 15
Figure 9 Horizontal Load vs. Horizontal Displacement 17
Figure 10 Effect of Embedment 19
⊘ This is a preview!⊘
Do you want full access?
Subscribe today to unlock all pages.
Trusted by 1+ million students worldwide
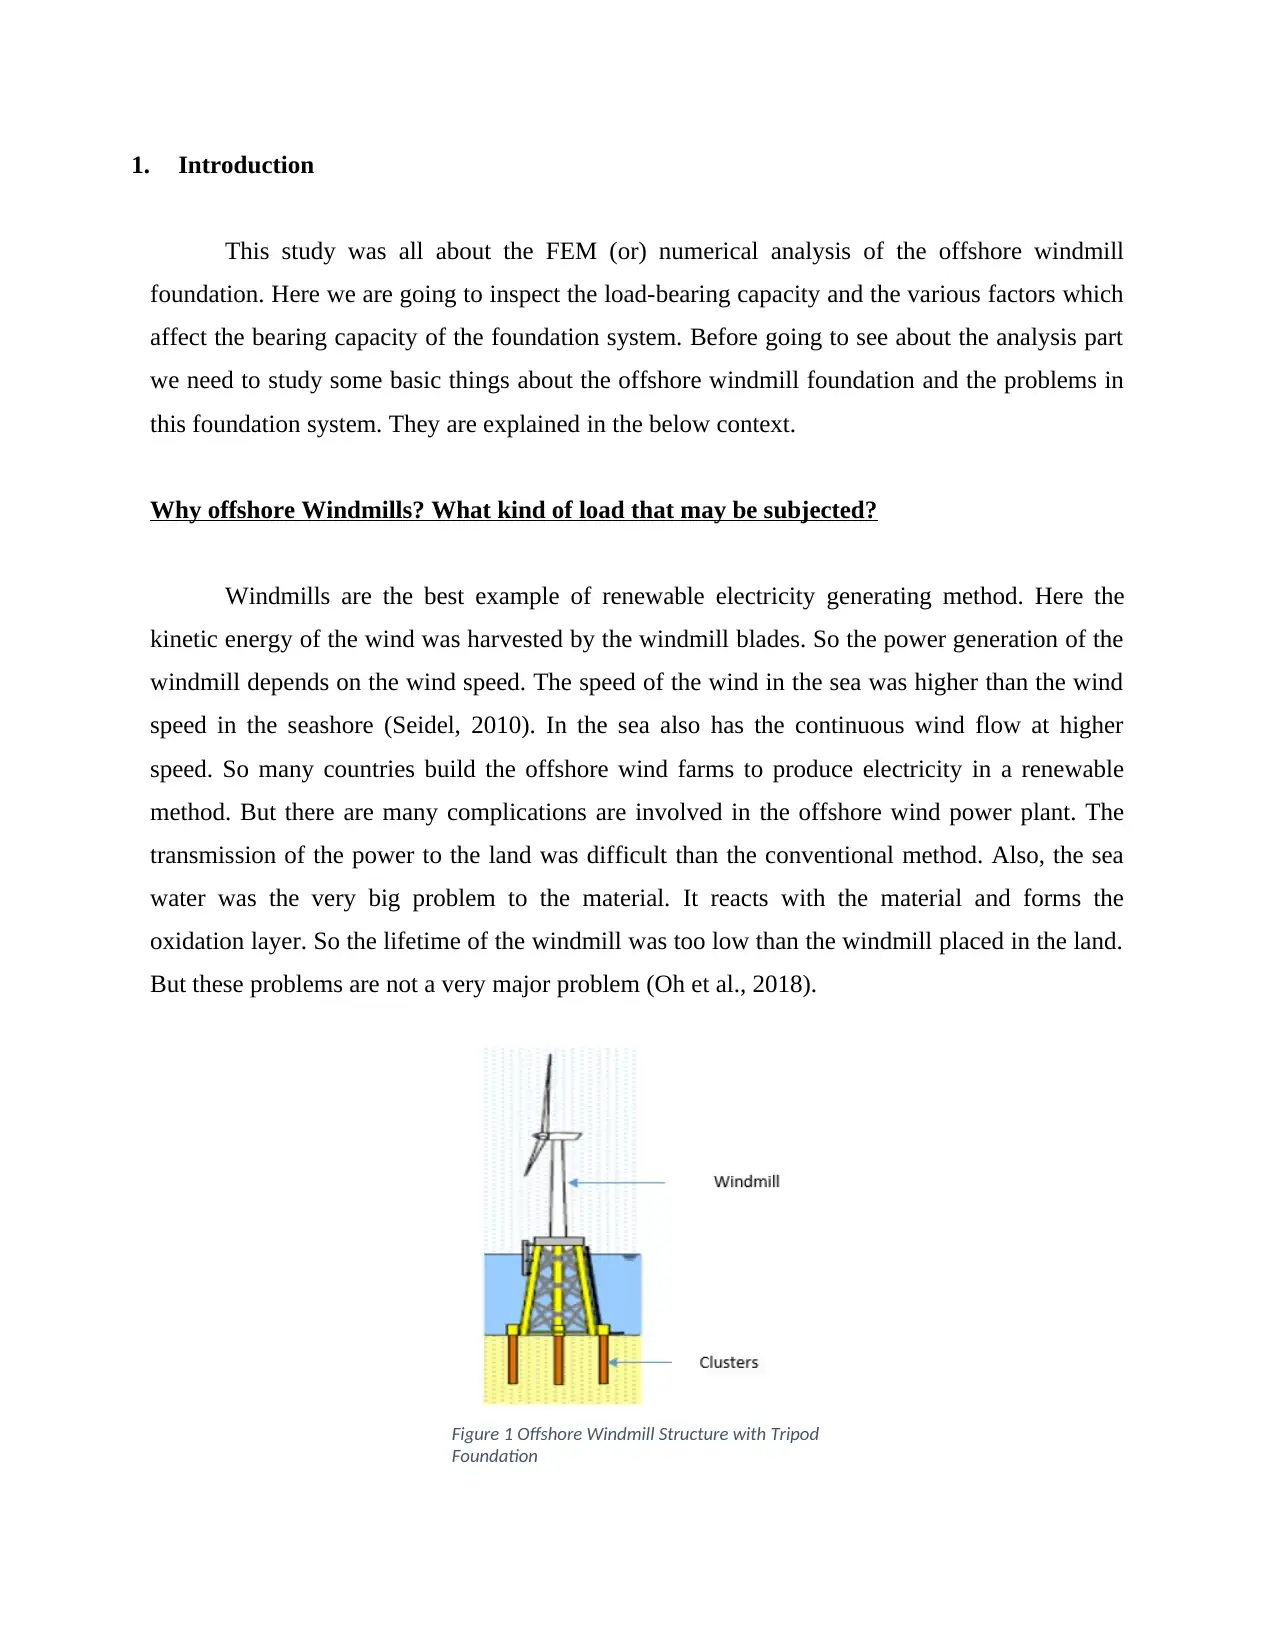
1. Introduction
This study was all about the FEM (or) numerical analysis of the offshore windmill
foundation. Here we are going to inspect the load-bearing capacity and the various factors which
affect the bearing capacity of the foundation system. Before going to see about the analysis part
we need to study some basic things about the offshore windmill foundation and the problems in
this foundation system. They are explained in the below context.
Why offshore Windmills? What kind of load that may be subjected?
Windmills are the best example of renewable electricity generating method. Here the
kinetic energy of the wind was harvested by the windmill blades. So the power generation of the
windmill depends on the wind speed. The speed of the wind in the sea was higher than the wind
speed in the seashore (Seidel, 2010). In the sea also has the continuous wind flow at higher
speed. So many countries build the offshore wind farms to produce electricity in a renewable
method. But there are many complications are involved in the offshore wind power plant. The
transmission of the power to the land was difficult than the conventional method. Also, the sea
water was the very big problem to the material. It reacts with the material and forms the
oxidation layer. So the lifetime of the windmill was too low than the windmill placed in the land.
But these problems are not a very major problem (Oh et al., 2018).
Figure 1 Offshore Windmill Structure with Tripod
Foundation
Paraphrase This Document
Need a fresh take? Get an instant paraphrase of this document with our AI Paraphraser
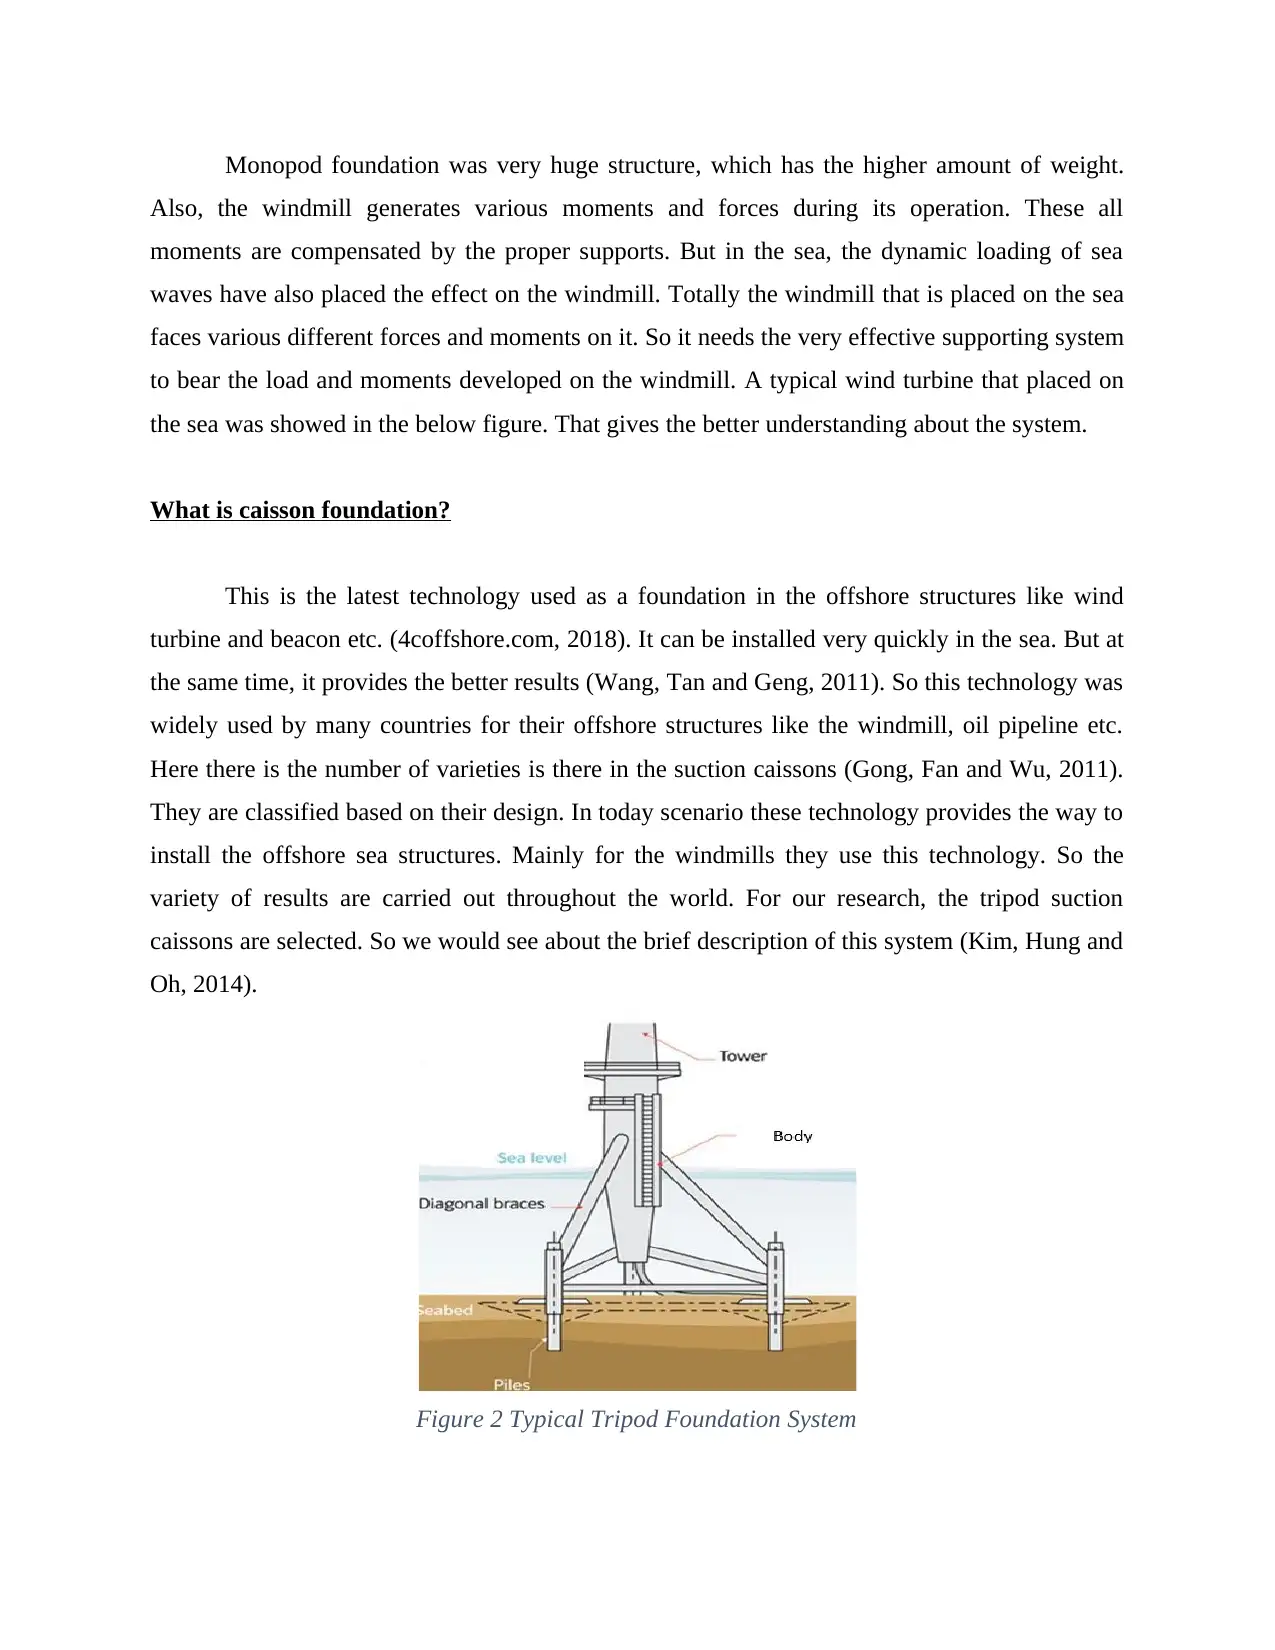
Monopod foundation was very huge structure, which has the higher amount of weight.
Also, the windmill generates various moments and forces during its operation. These all
moments are compensated by the proper supports. But in the sea, the dynamic loading of sea
waves have also placed the effect on the windmill. Totally the windmill that is placed on the sea
faces various different forces and moments on it. So it needs the very effective supporting system
to bear the load and moments developed on the windmill. A typical wind turbine that placed on
the sea was showed in the below figure. That gives the better understanding about the system.
What is caisson foundation?
This is the latest technology used as a foundation in the offshore structures like wind
turbine and beacon etc. (4coffshore.com, 2018). It can be installed very quickly in the sea. But at
the same time, it provides the better results (Wang, Tan and Geng, 2011). So this technology was
widely used by many countries for their offshore structures like the windmill, oil pipeline etc.
Here there is the number of varieties is there in the suction caissons (Gong, Fan and Wu, 2011).
They are classified based on their design. In today scenario these technology provides the way to
install the offshore sea structures. Mainly for the windmills they use this technology. So the
variety of results are carried out throughout the world. For our research, the tripod suction
caissons are selected. So we would see about the brief description of this system (Kim, Hung and
Oh, 2014).
Figure 2 Typical Tripod Foundation System
In the above figure, the structural model of the tripod suction caisson model was shown.
That gives the better understanding about this structure. Here there are three piles were used to
support the structure (Li and Chang, 2016) (Arany et al., 2014). That gives better stability than
the monopod systems. Because it has the three piles so that the load, as well as momentum
distribution, was to effectively carried out by this system. It was relatively light structure than
others. The three piles are joined by the cross members (Kuhfeld, 2015). In the middle of the
structure, the body structure was joined. Instead of piles, we can also use the suction buckets to
reduce the weight of the structure. This was fabricated as the ready-made structure. So only we
need to transform this structure to the placement area (Engineers race to design world's biggest
offshore wind turbines, 2010) (Negro et al., 2014). Then we need to place this structure by the
suction process. The design of the system depended on the type of loading. If the system
undergoes to axial loading then we need to design one kind, for the circumferential loading we
chose some other types of design.
2. Objectives
We are going to do the following activities, they are the main objectives of the project.
But some other tasks are also carried out in the project, among them the below-listed objectives
are considered as the main objectives.
To study about the offshore windmill structures and their foundations.
To study about the forces or loads involved in the offshore windmill foundations.
To make the conceptual design of the system.
To make the mathematical model of the system using the Abacus CAE-2017.
To apply the loads in the system.
To simulate the developed design.
To calculate the maximum load bearing capabilities of the foundation system.
To generate the various graphs and result images using the Abacus 2017 software.
⊘ This is a preview!⊘
Do you want full access?
Subscribe today to unlock all pages.
Trusted by 1+ million students worldwide
3. Numerical analysis
What is numerical analysis? Why numerical analysis?
Generally, the numerical analysis means the methodology followed to solve the real-life
problems by using the mathematical equations, theorems, and some other tools. Here first we
need to develop the mathematical model of the problem. This should have the governing
equations and the variables related to the problems (Zhang and Cheng, 2016) (Houlsby and
Byrne, 2000). This is the best method to analyze the problem before going to the real
development activity. This type of analysis plays the vital role in the initial product design
process. By using this technology we can able to simulate the problems so we no need to spend
money on the development of the real construction (4coffshore.com, 2018). This technology acts
as the guidelines for the problem. Also, the too extreme condition was simulated using this
technology (Alati et al., 2014). Consider our problem, which was the analyzing of the offshore
windmill foundation system using tripod configuration. If we go to the real analysis we need to
develop the system and install this system on the sea. So the huge amount of money was spent on
this process (Madsen, Andersen and Ibsen, 2013). If the design satisfies the requirements the
problems do not arise, in case the design not satisfy the requirement that leads to very big money
loss to us. Also, it causes the hazard the workers who involved in the installation process (Hirai,
2017). So that kind of design was simulated first to analyze the load bearing capabilities. After
the successful analysis, the maximum load bearing capability of the design was calculated. Based
on this calculation we decide the further activities. For this purpose, the large variety of software
tools are available in the market. Among them, we select the Abaqus CAE2017 for our
requirement. This is one of the best FEA tools used for this purpose. This software was
developed and sold by the Dassault systems. They are the leading company on their field. This
software was packed with the bundle of features on it (Schafhirt, Zwick and Muskulus, 2016).
These features are really useful to do the simulation works. It also follows the same methods to
develop the numerical design. This software provides better accuracy. In this project, we are
going to see about the development of model as well as its performance analysis (Load bearing
capability analysis) using this software.
Paraphrase This Document
Need a fresh take? Get an instant paraphrase of this document with our AI Paraphraser
Various stages in the Numerical Analysis
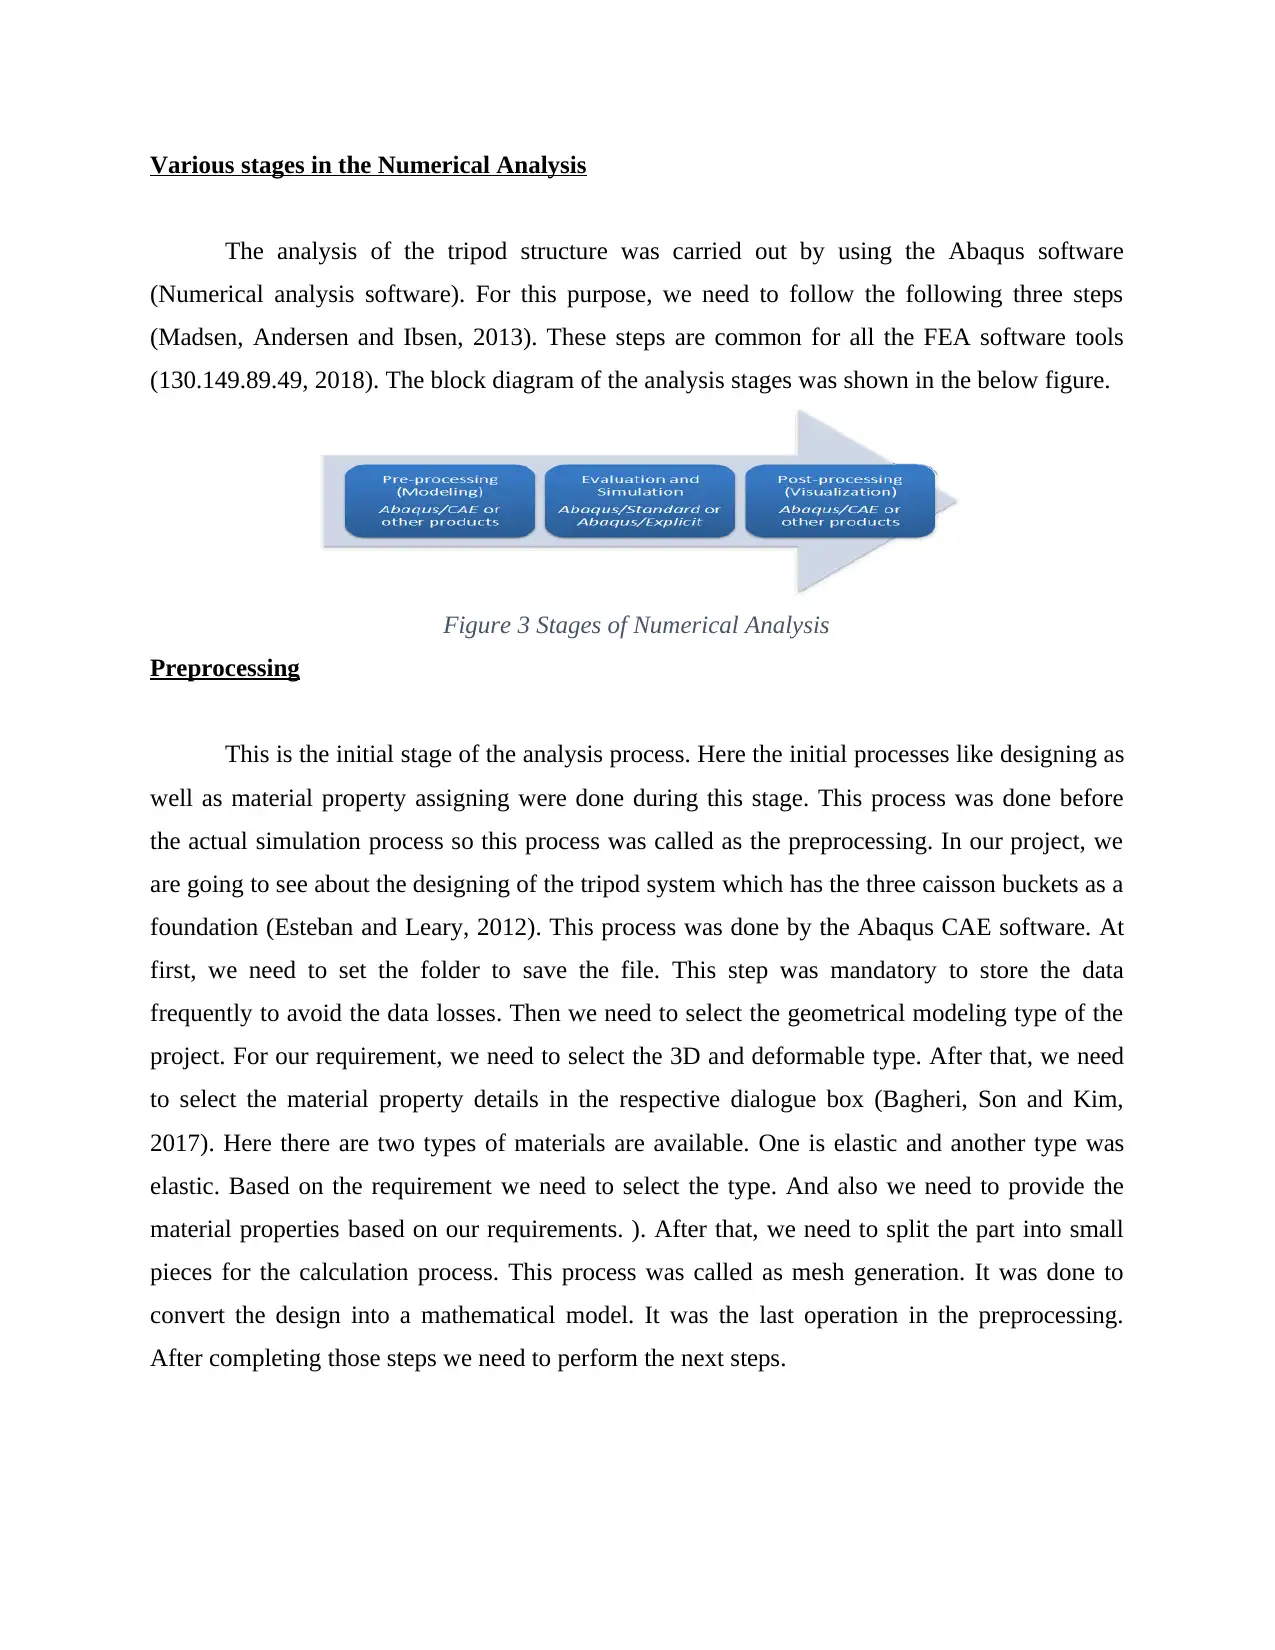
The analysis of the tripod structure was carried out by using the Abaqus software
(Numerical analysis software). For this purpose, we need to follow the following three steps
(Madsen, Andersen and Ibsen, 2013). These steps are common for all the FEA software tools
(130.149.89.49, 2018). The block diagram of the analysis stages was shown in the below figure.
Figure 3 Stages of Numerical Analysis
Preprocessing
This is the initial stage of the analysis process. Here the initial processes like designing as
well as material property assigning were done during this stage. This process was done before
the actual simulation process so this process was called as the preprocessing. In our project, we
are going to see about the designing of the tripod system which has the three caisson buckets as a
foundation (Esteban and Leary, 2012). This process was done by the Abaqus CAE software. At
first, we need to set the folder to save the file. This step was mandatory to store the data
frequently to avoid the data losses. Then we need to select the geometrical modeling type of the
project. For our requirement, we need to select the 3D and deformable type. After that, we need
to select the material property details in the respective dialogue box (Bagheri, Son and Kim,
2017). Here there are two types of materials are available. One is elastic and another type was
elastic. Based on the requirement we need to select the type. And also we need to provide the
material properties based on our requirements. ). After that, we need to split the part into small
pieces for the calculation process. This process was called as mesh generation. It was done to
convert the design into a mathematical model. It was the last operation in the preprocessing.
After completing those steps we need to perform the next steps.
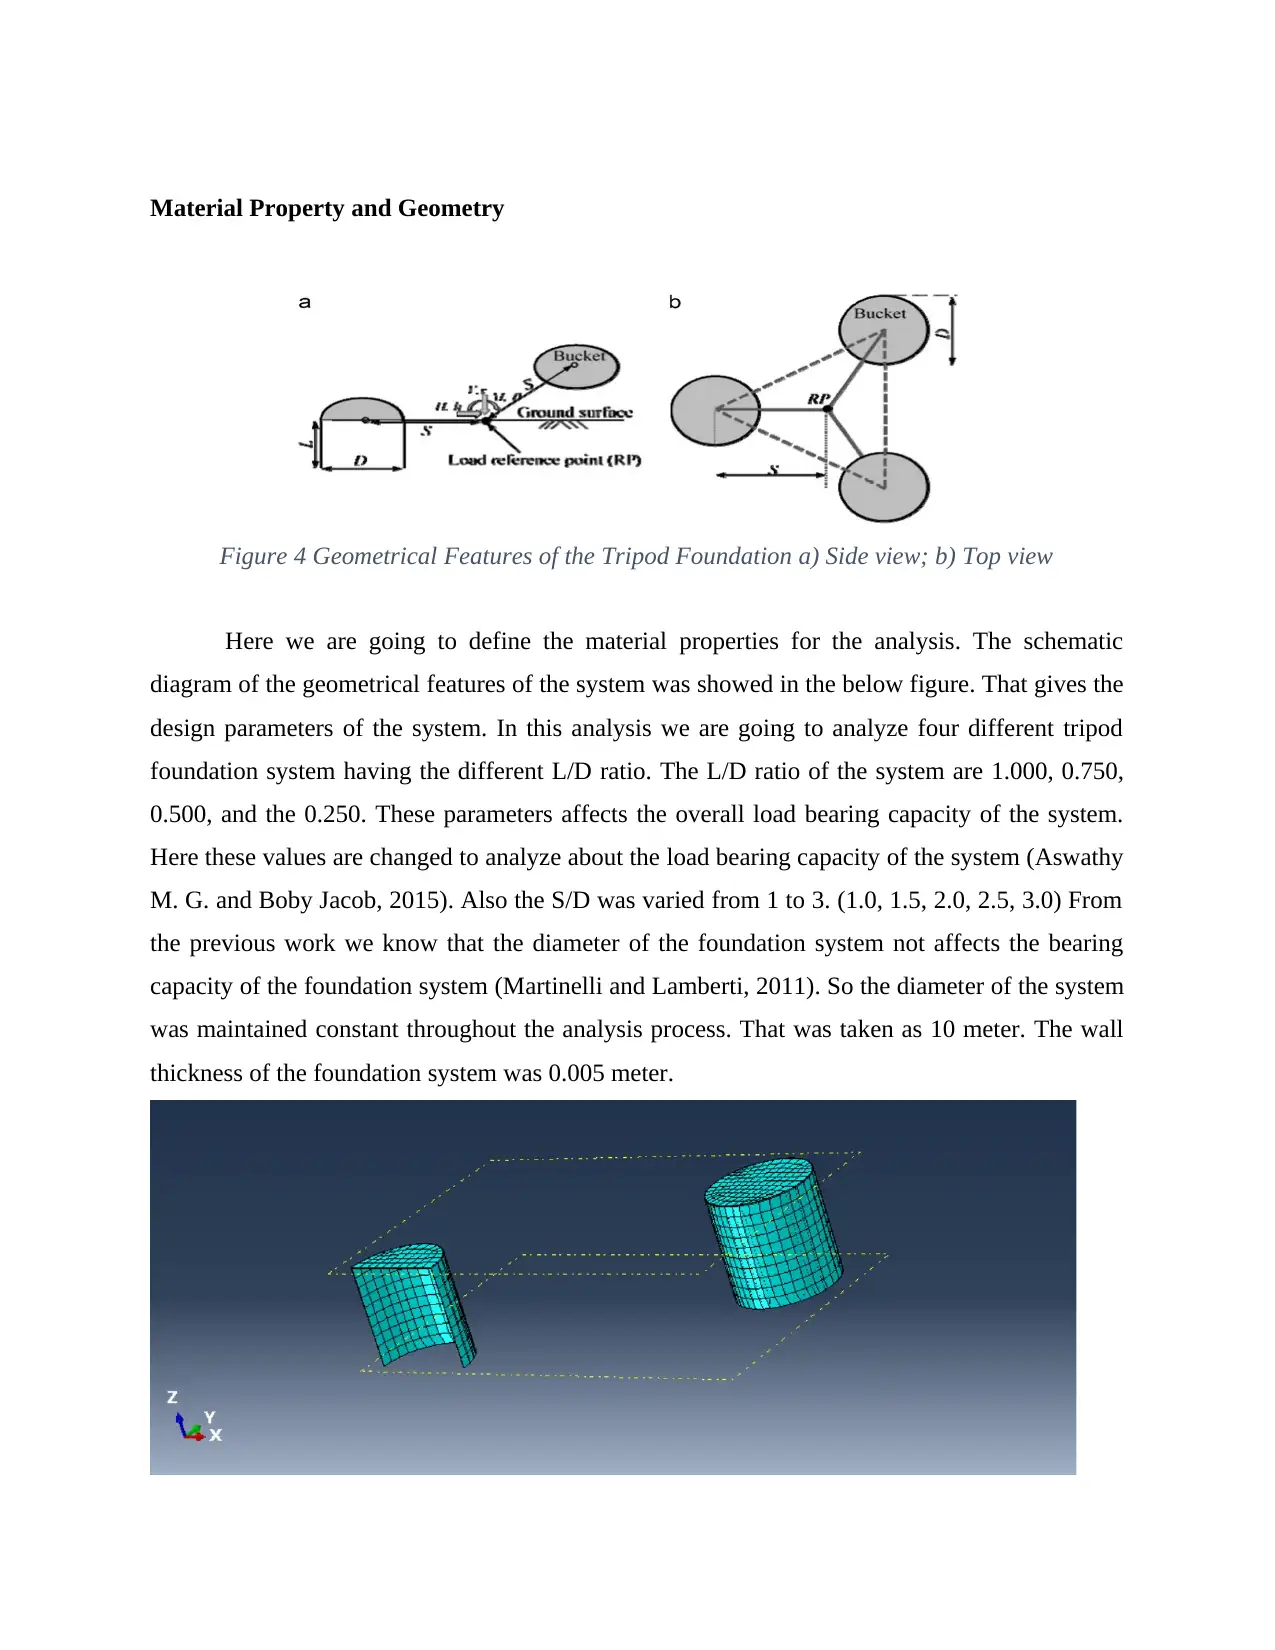
Material Property and Geometry
Figure 4 Geometrical Features of the Tripod Foundation a) Side view; b) Top view
Here we are going to define the material properties for the analysis. The schematic
diagram of the geometrical features of the system was showed in the below figure. That gives the
design parameters of the system. In this analysis we are going to analyze four different tripod
foundation system having the different L/D ratio. The L/D ratio of the system are 1.000, 0.750,
0.500, and the 0.250. These parameters affects the overall load bearing capacity of the system.
Here these values are changed to analyze about the load bearing capacity of the system (Aswathy
M. G. and Boby Jacob, 2015). Also the S/D was varied from 1 to 3. (1.0, 1.5, 2.0, 2.5, 3.0) From
the previous work we know that the diameter of the foundation system not affects the bearing
capacity of the foundation system (Martinelli and Lamberti, 2011). So the diameter of the system
was maintained constant throughout the analysis process. That was taken as 10 meter. The wall
thickness of the foundation system was 0.005 meter.
⊘ This is a preview!⊘
Do you want full access?
Subscribe today to unlock all pages.
Trusted by 1+ million students worldwide
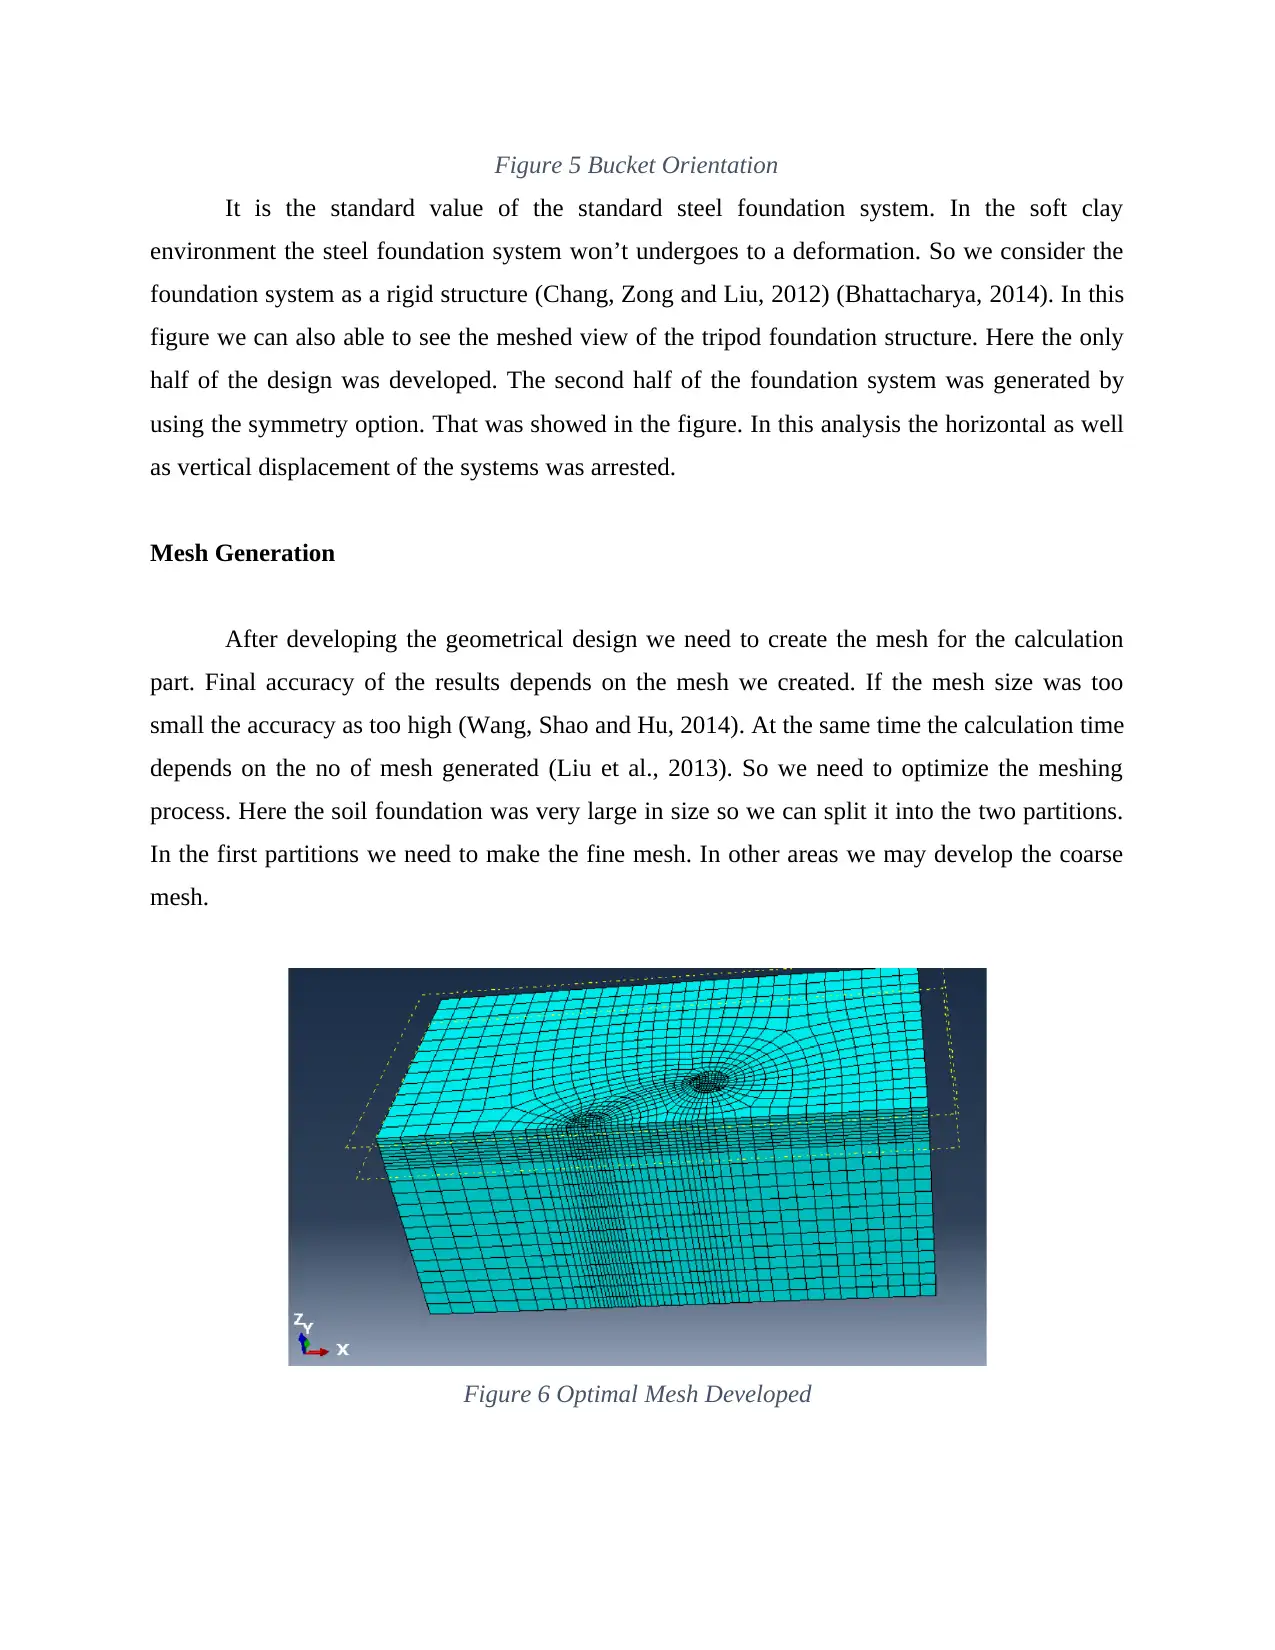
Figure 5 Bucket Orientation
It is the standard value of the standard steel foundation system. In the soft clay
environment the steel foundation system won’t undergoes to a deformation. So we consider the
foundation system as a rigid structure (Chang, Zong and Liu, 2012) (Bhattacharya, 2014). In this
figure we can also able to see the meshed view of the tripod foundation structure. Here the only
half of the design was developed. The second half of the foundation system was generated by
using the symmetry option. That was showed in the figure. In this analysis the horizontal as well
as vertical displacement of the systems was arrested.
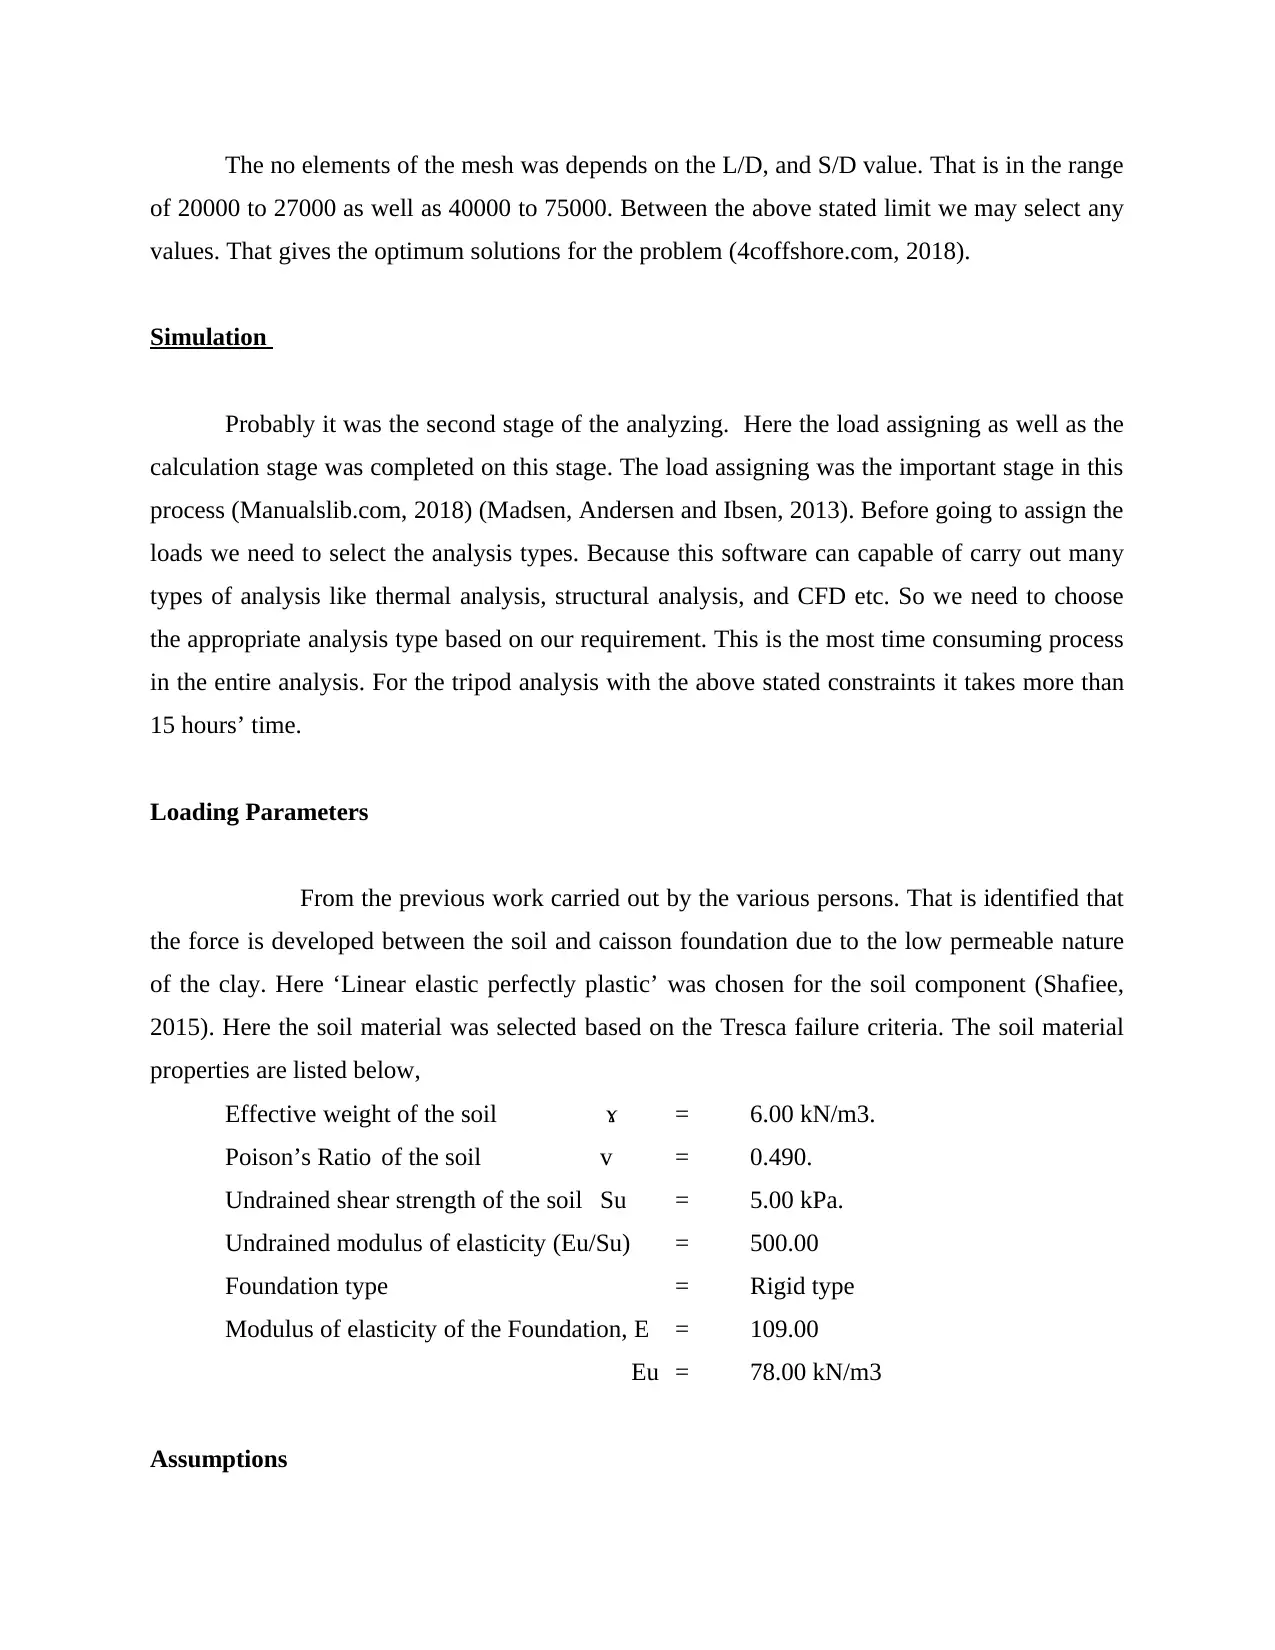
Mesh Generation
After developing the geometrical design we need to create the mesh for the calculation
part. Final accuracy of the results depends on the mesh we created. If the mesh size was too
small the accuracy as too high (Wang, Shao and Hu, 2014). At the same time the calculation time
depends on the no of mesh generated (Liu et al., 2013). So we need to optimize the meshing
process. Here the soil foundation was very large in size so we can split it into the two partitions.
In the first partitions we need to make the fine mesh. In other areas we may develop the coarse
mesh.
Figure 6 Optimal Mesh Developed
It is the standard value of the standard steel foundation system. In the soft clay
environment the steel foundation system won’t undergoes to a deformation. So we consider the
foundation system as a rigid structure (Chang, Zong and Liu, 2012) (Bhattacharya, 2014). In this
figure we can also able to see the meshed view of the tripod foundation structure. Here the only
half of the design was developed. The second half of the foundation system was generated by
using the symmetry option. That was showed in the figure. In this analysis the horizontal as well
as vertical displacement of the systems was arrested.
Mesh Generation
After developing the geometrical design we need to create the mesh for the calculation
part. Final accuracy of the results depends on the mesh we created. If the mesh size was too
small the accuracy as too high (Wang, Shao and Hu, 2014). At the same time the calculation time
depends on the no of mesh generated (Liu et al., 2013). So we need to optimize the meshing
process. Here the soil foundation was very large in size so we can split it into the two partitions.
In the first partitions we need to make the fine mesh. In other areas we may develop the coarse
mesh.
Figure 6 Optimal Mesh Developed
Paraphrase This Document
Need a fresh take? Get an instant paraphrase of this document with our AI Paraphraser
The no elements of the mesh was depends on the L/D, and S/D value. That is in the range
of 20000 to 27000 as well as 40000 to 75000. Between the above stated limit we may select any
values. That gives the optimum solutions for the problem (4coffshore.com, 2018).
Simulation
Probably it was the second stage of the analyzing. Here the load assigning as well as the
calculation stage was completed on this stage. The load assigning was the important stage in this
process (Manualslib.com, 2018) (Madsen, Andersen and Ibsen, 2013). Before going to assign the
loads we need to select the analysis types. Because this software can capable of carry out many
types of analysis like thermal analysis, structural analysis, and CFD etc. So we need to choose
the appropriate analysis type based on our requirement. This is the most time consuming process
in the entire analysis. For the tripod analysis with the above stated constraints it takes more than
15 hours’ time.
Loading Parameters
From the previous work carried out by the various persons. That is identified that
the force is developed between the soil and caisson foundation due to the low permeable nature
of the clay. Here ‘Linear elastic perfectly plastic’ was chosen for the soil component (Shafiee,
2015). Here the soil material was selected based on the Tresca failure criteria. The soil material
properties are listed below,
Effective weight of the soil ɤ = 6.00 kN/m3.
Poison’s Ratio of the soil v = 0.490.
Undrained shear strength of the soil Su = 5.00 kPa.
Undrained modulus of elasticity (Eu/Su) = 500.00
Foundation type = Rigid type
Modulus of elasticity of the Foundation, E = 109.00
Eu = 78.00 kN/m3
Assumptions
The caisson foundation system has the Up-lift capacity for the lower load values.
Especially for the load caused by the suction of the soil.
In the foundation level the (undrained condition) a resistance was offered to the
foundation system. That is caused by the suction pressure inside the soil-plug system in
the foundation.
The foundation system has the no deformation (Assumed to be rigid).
There is no weather effects are acted on the foundations system.
Structural Interaction between the Clusters
For distribute the load equally to all the three clusters for that we need to create the
structural linkage among the three clusters. This is the important stage in this numerical (FEM)
analysis. Here we need to develop the structural connection by the Load Reference Point
methodology. In this case the previous work suggested that to make the rigid caisson foundation
structure. Because that gives the more appropriate results.
Loading method
Here the load was given by displacement controlled methodology. The load are given in
the various points and they are Reference point (RP), Horizontal direction (u), Rotation (Ɵ), and
also in the vertical direction (w). The loading scheme followed in the analysis was illustrated in
the above shown figure. That gives the more clear details about the loading scheme. This method
of loading was more suited because that gives the more accurate results. Also this method was
the easy way of loading for the problem.
Post Processing
This stage was carried out after the calculation or simulation process. In this stage, the
various graphs, as well as animations related to our problem, was generated. So this step was
called as the result viewing stage (ABAQUS installation and licensing, 2008). Here we can’t do
⊘ This is a preview!⊘
Do you want full access?
Subscribe today to unlock all pages.
Trusted by 1+ million students worldwide
1 out of 22
Related Documents


Your All-in-One AI-Powered Toolkit for Academic Success.
+13062052269
info@desklib.com
Available 24*7 on WhatsApp / Email
![[object Object]](/_next/static/media/star-bottom.7253800d.svg)
Unlock your academic potential
Copyright © 2020–2026 A2Z Services. All Rights Reserved. Developed and managed by ZUCOL.