Financial Accounting Report: ABB Financial Performance Analysis
VerifiedAdded on 2020/10/22
|11
|3287
|192
Report
AI Summary
This financial accounting report provides an in-depth analysis of ABB's financial performance, focusing on key areas such as cash management, receivables turnover, and inventory costing methods (LIFO and weighted average). The report examines the company's cash and cash equivalents, receivables turnover ratio, and allowance for doubtful accounts, highlighting changes from 2016 to 2017. It also analyzes long-lived assets, including property, plant, and equipment (PP&E), and assesses for impairment, as well as analyzing the fixed assets turnover ratio. Furthermore, the report delves into investment strategies, analyzing liquid investments, short-term investments, and the classification of financial instruments. The report concludes with an overview of goodwill impairment and its recognition in the financial statements, offering a comprehensive assessment of ABB's financial health and performance.

FINANCIAL
ACCOUNTING
ACCOUNTING
Paraphrase This Document
Need a fresh take? Get an instant paraphrase of this document with our AI Paraphraser
Table of Contents
EXECUTIVE SUMMARY.............................................................................................................3
INTRODUCTION...........................................................................................................................4
MAIN BODY...................................................................................................................................4
Cash receivables and inventory...................................................................................................4
Long-Lived-Assets (PP&E and Impairment)..............................................................................6
Investment...................................................................................................................................8
CONCLUSION..............................................................................................................................10
REFRENCES.................................................................................................................................11
EXECUTIVE SUMMARY
This project report is summarises as cash, receivables & inventory cash balances are
increases compare to past years. After calculation of asset turn over, fixed assets turn over and
receivables turn over ratios are shows performance of the company and decreases and increases
amount of particular item. For inventory costing using method LIFO (last in first out) and
weighted average method. Impairment of fixed assets as well as goodwill in their financial
statements. In investments head classified holding gains that are helping to recognize particular
item.
⊘ This is a preview!⊘
Do you want full access?
Subscribe today to unlock all pages.
Trusted by 1+ million students worldwide
INTRODUCTION
Financial accounting is a terminology of gathering information related to financial
transactions, events and recording them in a systematic manner according to accounting
standards (Beatty and Liao, 2014). This report outlines the key financial areas of ABB
organisation. There is a discussion made on cash receivables and inventories for the current year.
Calculations of Long term assets and impairment are analysed in this report. Investments
analysis regarding reporting and securities or trading are analysed with market change and
holding gains.
MAIN BODY
Cash receivables and inventory
Company's cash balance
Cash and cash equivalents is considered high liquid current assets in organisation. It helps
to manage day to day monetary transactions. As per the annual report of ABB cash and cash
equivalents were calculated as $4526 million for 2017 and $3644 for 2016. It seems that cash
and cash equivalent increased during the year 2017 by £882. Currency and other local regulatory
limitations related to the transfer of funds exist in a number of countries where the company
operates. In funds including fees or loan repayments, every day dividends can not be promptly
transferred abroad from these countries and are there fore deposited and used for working capital
needs locally. These funds are included in cash and cash equivalents as they are not reasoned
limited.
Receivables turnover ratio
It is activity based ratio that are measuring efficiency of firm to uses its assets. It will be
calculated on the basis net value of credit sales of particular time and same period average
accounts receivable (Lovell, 2014). It is calculated as follows -
Accounts Receivable Turn over = Net credit sales/Average accounts receivables
Ratio Analysis 2016 2017
Net credit sales 33828 34312
Average accounts receivables 4848 5208
Receivables turn over 6.98 6.59
Paraphrase This Document
Need a fresh take? Get an instant paraphrase of this document with our AI Paraphraser
This means the company collects its receivables in 2016 have 6.98 accounts receivable
and in 2017 have 6.59. It is decreasing compare to last year and it is goods for company. High
receivables turn over ration can imply a variety of things about a company. It is suggest that a
company operates it on the basis of cash. A low ratio can suggest few things related to company,
like as bad credit policy, customer with financial difficulty and bad customers.
Allowance for doubtful accounts and contra-assets increase over the prior year
The allowance for doubtful accounts is the company's best approximation of the quantity
of likely credit losses in active accounts receivable. The company AAB was determines the
portion of allowances that are based on real write off content and client particular data. If an
amount has not been accomplished with in its written agreement payment term then it is
thoughtful past collect (Fülbier and Weller, 2011). The company giving reason for the
allowances for doubtful accounts on a regular basis for past remaining amounts are reviewed for
collectability. Accounts balances are positively charged off against the affiliated allowance when
the company accept that the amount will not be recovered in future.
Changes in the allowance for doubtful accounts are describing that in past years balance
at January 1, 2015 was 279, in 2016 was 258 and in 2017 was 314. after that adjusted in
additions, deductions and apply exchange rate differences are as follows 118, 163, 109 and
(113), (96), (111) and (26), (11), 18. After all adjustments remaining balances at December, 31
are 258 in 2015, 314 in 2016 and 330 in 2017.
Inventory costing method used by organisation
Inventories are declared at the lower of cost or net realizable amount. Cost of inventories
are observed by using first in first out method, weighted average cost method or in certain
condition for example the effected revenues with the help of contract method is used for the
particular known method. Inventories costs are explicit at getting costs or actual production cost
including direct material and applicable manufacturing overheads. Modify to cut down the cost
of inventory to its net possible value are made, if necessary, for decreases in sales prices,
devolution or same reductions in amount (Narayanaswamy, 2017).
Inventory turnover ratio
This ratio based on efficiency that presents how efficaciously inventory is managed by
examination cost of goods sold with average inventory for particular time period. This measures
how many times average inventory is turned or sold during a period. This ratio is important
because total turn over mainly based on main two components of performance. First one is stock
purchasing and second one is sales (Baxter and Thibodeau, 2011).
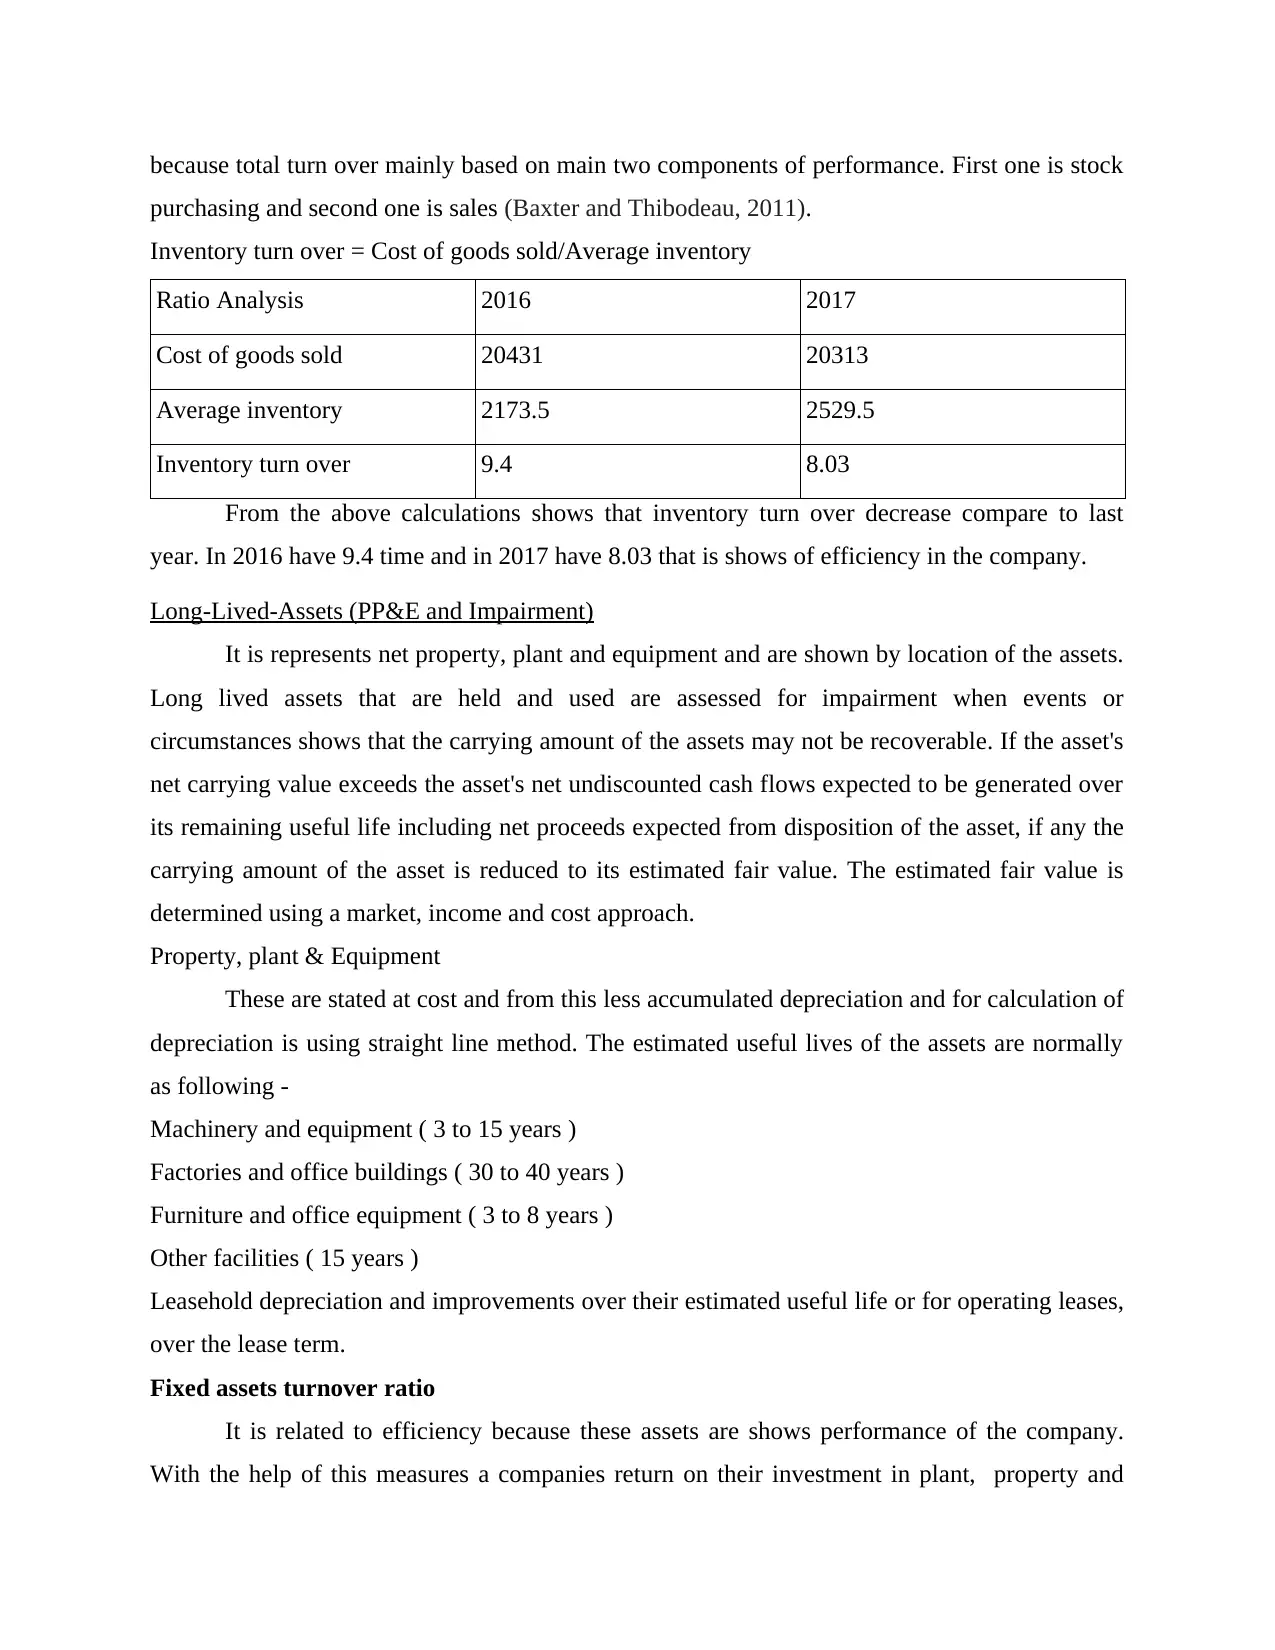
Inventory turn over = Cost of goods sold/Average inventory
Ratio Analysis 2016 2017
Cost of goods sold 20431 20313
Average inventory 2173.5 2529.5
Inventory turn over 9.4 8.03
From the above calculations shows that inventory turn over decrease compare to last
year. In 2016 have 9.4 time and in 2017 have 8.03 that is shows of efficiency in the company.
Long-Lived-Assets (PP&E and Impairment)
It is represents net property, plant and equipment and are shown by location of the assets.
Long lived assets that are held and used are assessed for impairment when events or
circumstances shows that the carrying amount of the assets may not be recoverable. If the asset's
net carrying value exceeds the asset's net undiscounted cash flows expected to be generated over
its remaining useful life including net proceeds expected from disposition of the asset, if any the
carrying amount of the asset is reduced to its estimated fair value. The estimated fair value is
determined using a market, income and cost approach.
Property, plant & Equipment
These are stated at cost and from this less accumulated depreciation and for calculation of
depreciation is using straight line method. The estimated useful lives of the assets are normally
as following -
Machinery and equipment ( 3 to 15 years )
Factories and office buildings ( 30 to 40 years )
Furniture and office equipment ( 3 to 8 years )
Other facilities ( 15 years )
Leasehold depreciation and improvements over their estimated useful life or for operating leases,
over the lease term.
Fixed assets turnover ratio
It is related to efficiency because these assets are shows performance of the company.
With the help of this measures a companies return on their investment in plant, property and
purchasing and second one is sales (Baxter and Thibodeau, 2011).
Inventory turn over = Cost of goods sold/Average inventory
Ratio Analysis 2016 2017
Cost of goods sold 20431 20313
Average inventory 2173.5 2529.5
Inventory turn over 9.4 8.03
From the above calculations shows that inventory turn over decrease compare to last
year. In 2016 have 9.4 time and in 2017 have 8.03 that is shows of efficiency in the company.
Long-Lived-Assets (PP&E and Impairment)
It is represents net property, plant and equipment and are shown by location of the assets.
Long lived assets that are held and used are assessed for impairment when events or
circumstances shows that the carrying amount of the assets may not be recoverable. If the asset's
net carrying value exceeds the asset's net undiscounted cash flows expected to be generated over
its remaining useful life including net proceeds expected from disposition of the asset, if any the
carrying amount of the asset is reduced to its estimated fair value. The estimated fair value is
determined using a market, income and cost approach.
Property, plant & Equipment
These are stated at cost and from this less accumulated depreciation and for calculation of
depreciation is using straight line method. The estimated useful lives of the assets are normally
as following -
Machinery and equipment ( 3 to 15 years )
Factories and office buildings ( 30 to 40 years )
Furniture and office equipment ( 3 to 8 years )
Other facilities ( 15 years )
Leasehold depreciation and improvements over their estimated useful life or for operating leases,
over the lease term.
Fixed assets turnover ratio
It is related to efficiency because these assets are shows performance of the company.
With the help of this measures a companies return on their investment in plant, property and
⊘ This is a preview!⊘
Do you want full access?
Subscribe today to unlock all pages.
Trusted by 1+ million students worldwide
equipment by comparing net sales with fixed assets. In different words it is calculate efficiency
of a company to producing sales with its machines and equipment.
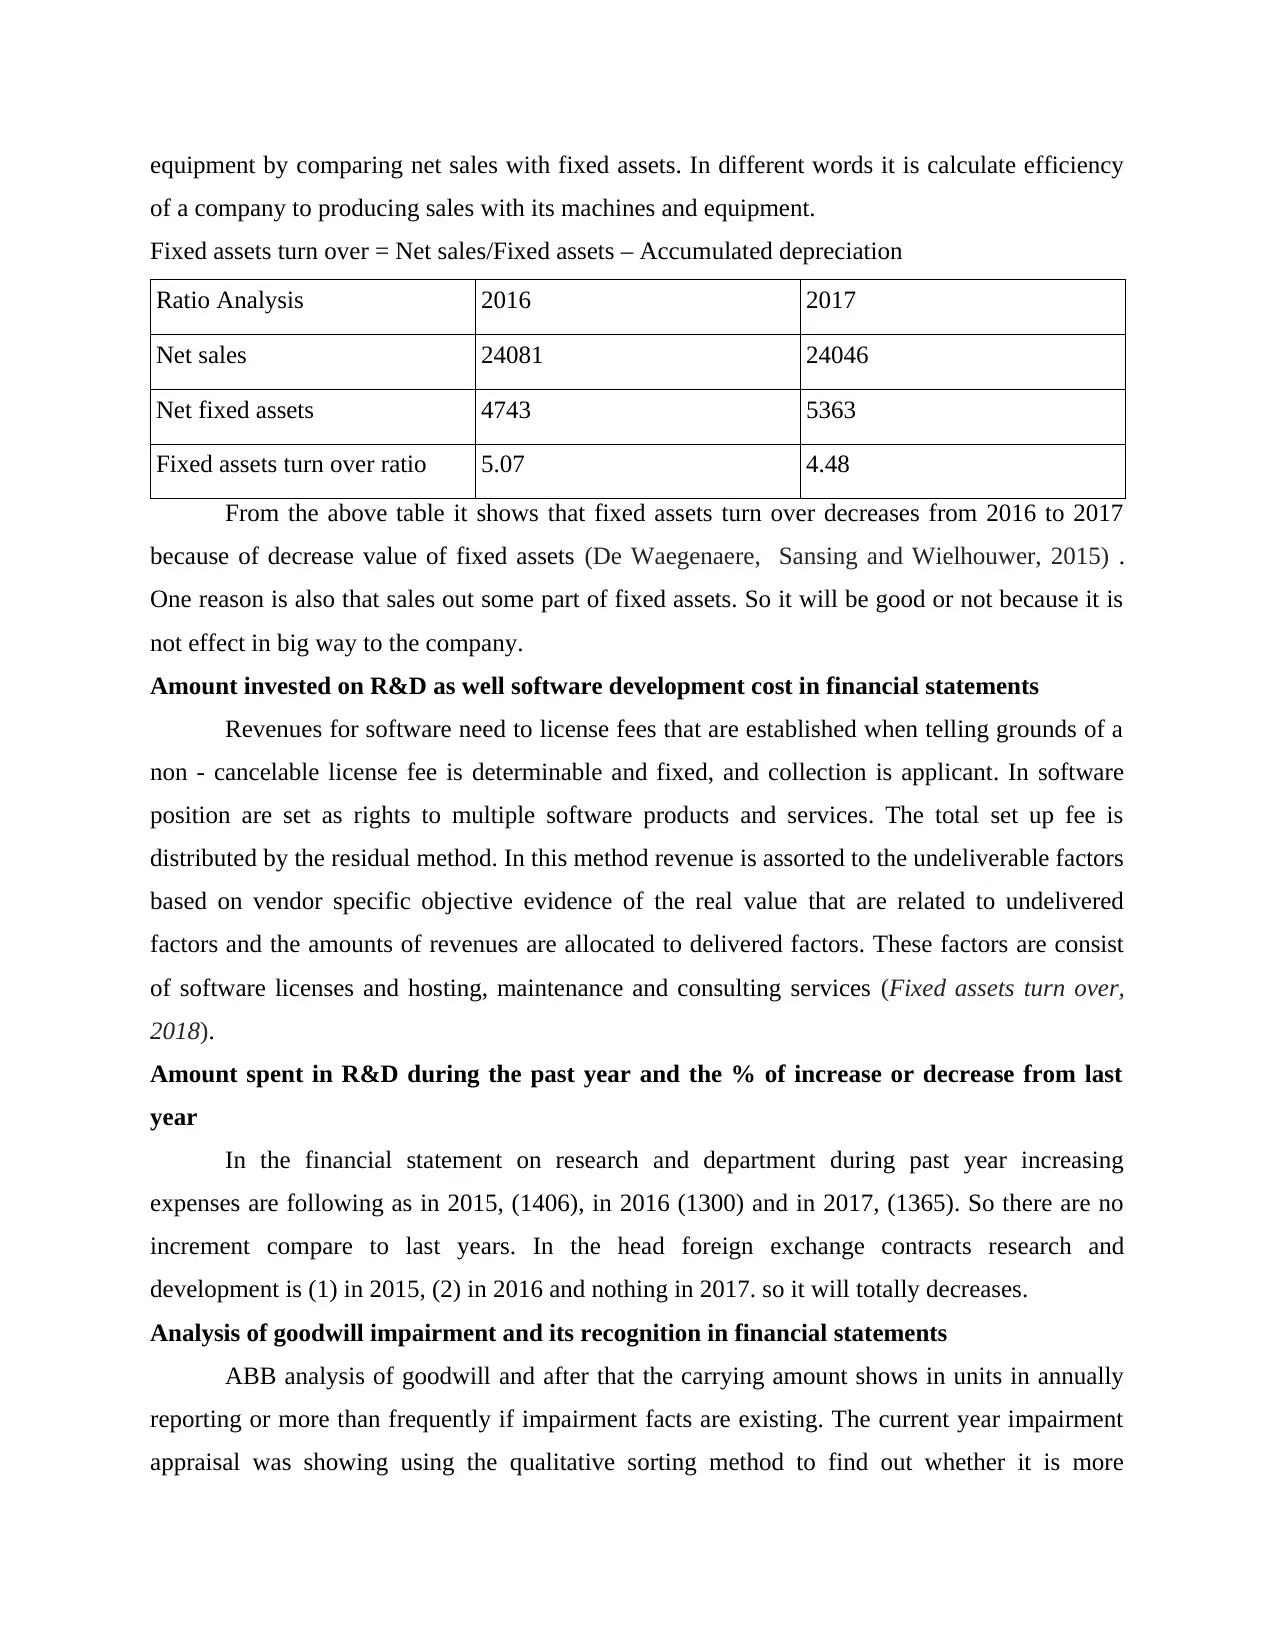
Fixed assets turn over = Net sales/Fixed assets – Accumulated depreciation
Ratio Analysis 2016 2017
Net sales 24081 24046
Net fixed assets 4743 5363
Fixed assets turn over ratio 5.07 4.48
From the above table it shows that fixed assets turn over decreases from 2016 to 2017
because of decrease value of fixed assets (De Waegenaere, Sansing and Wielhouwer, 2015) .
One reason is also that sales out some part of fixed assets. So it will be good or not because it is
not effect in big way to the company.
Amount invested on R&D as well software development cost in financial statements
Revenues for software need to license fees that are established when telling grounds of a
non - cancelable license fee is determinable and fixed, and collection is applicant. In software
position are set as rights to multiple software products and services. The total set up fee is
distributed by the residual method. In this method revenue is assorted to the undeliverable factors
based on vendor specific objective evidence of the real value that are related to undelivered
factors and the amounts of revenues are allocated to delivered factors. These factors are consist
of software licenses and hosting, maintenance and consulting services (Fixed assets turn over,
2018).
Amount spent in R&D during the past year and the % of increase or decrease from last
year
In the financial statement on research and department during past year increasing
expenses are following as in 2015, (1406), in 2016 (1300) and in 2017, (1365). So there are no
increment compare to last years. In the head foreign exchange contracts research and
development is (1) in 2015, (2) in 2016 and nothing in 2017. so it will totally decreases.
Analysis of goodwill impairment and its recognition in financial statements
ABB analysis of goodwill and after that the carrying amount shows in units in annually
reporting or more than frequently if impairment facts are existing. The current year impairment
appraisal was showing using the qualitative sorting method to find out whether it is more
of a company to producing sales with its machines and equipment.
Fixed assets turn over = Net sales/Fixed assets – Accumulated depreciation
Ratio Analysis 2016 2017
Net sales 24081 24046
Net fixed assets 4743 5363
Fixed assets turn over ratio 5.07 4.48
From the above table it shows that fixed assets turn over decreases from 2016 to 2017
because of decrease value of fixed assets (De Waegenaere, Sansing and Wielhouwer, 2015) .
One reason is also that sales out some part of fixed assets. So it will be good or not because it is
not effect in big way to the company.
Amount invested on R&D as well software development cost in financial statements
Revenues for software need to license fees that are established when telling grounds of a
non - cancelable license fee is determinable and fixed, and collection is applicant. In software
position are set as rights to multiple software products and services. The total set up fee is
distributed by the residual method. In this method revenue is assorted to the undeliverable factors
based on vendor specific objective evidence of the real value that are related to undelivered
factors and the amounts of revenues are allocated to delivered factors. These factors are consist
of software licenses and hosting, maintenance and consulting services (Fixed assets turn over,
2018).
Amount spent in R&D during the past year and the % of increase or decrease from last
year
In the financial statement on research and department during past year increasing
expenses are following as in 2015, (1406), in 2016 (1300) and in 2017, (1365). So there are no
increment compare to last years. In the head foreign exchange contracts research and
development is (1) in 2015, (2) in 2016 and nothing in 2017. so it will totally decreases.
Analysis of goodwill impairment and its recognition in financial statements
ABB analysis of goodwill and after that the carrying amount shows in units in annually
reporting or more than frequently if impairment facts are existing. The current year impairment
appraisal was showing using the qualitative sorting method to find out whether it is more
Paraphrase This Document
Need a fresh take? Get an instant paraphrase of this document with our AI Paraphraser
probable than not present fair value of the reporting and unit is less than its carrying cost. This
annual impairment test was important fort audit because the goodwill balance of USD 11199
millions end of December 31, 2017 is represent in financial statement as 26% of total assets. In
element, the qualitative factors are related to the management's assessment process which are
premise supported and extremely judgemental. Goodwill recognise in financial statement in
balance sheet in assets side under the head intangible assets. It is shows in 2016, 11199 and in
2017 was 9501 so as the result is it will decreases (Carmichael and Graham, 2012). When
analysis of goodwill for impairment, the company uses either a quantitative and qualitative
assessment method for each reporting unit.
Amortisation of goodwill
Goodwill balance of USD 11199 million as of December 31, 2017 is significant to the
financial statements representing 26% of total assets.
Investment
Analysis of liquid investment with maturities of three months or less in financial statements
In 2017, identify that amount decreased of excess liquidity invested in marketable
securities and short term investment as funds were needed for acquisition of businesses while in
2016 and 2015, the amount increased when invested in marketable securities and short term
investments. After analysis of financial statement identify Cash and equivalents include highly
liquid investments with maturities of three months or less at the date of acquisition (Carvalho,
and Salotti, 2012). local and other currency restrictive related to to the movement of funds exist
in a number of countries where the company operates. In financial statements shows net change
in cash and equivalents from 2016 to 2017 is opening balance is 842070 in 2016 and 1980052 in
2017. Closing balance is 504557 in 2016 and 842070 in 2017.
Analysis of records of short term investments/securities during past year
At the end in December 31, 2016 after analysis of financial statement identify short term
investment and marketable securities was 1953. Management determines the suitable assortment
of held to maturity and available for sale securities at the time of purchase. ABB invested in debt
and equity for short time as well as long time. Debt securities are categorized as held to due date
when the company has the affirmative purpose and ability to hold instrument to maturity.
Marketable debt securities are mostly divided in cash and equivalents or marketable securities as
well as short term investments.
Classification of financial instruments and investments
In the organisation financial tools are divided on the basis of currency, commodity,
interest rate and equity risks and these are origin from its global operative, financial and
investing activities (Andrew and Cortese, 2011). The company uses differential tools to cut down
and manage the economical effect of these aspect.
Currency risk – Payable to the global nature of the company's operations, many of its
subsidiaries are unprotected to currency risk in their operating activities. From entering into
transactions in currencies other than their functional currency. To manage such currency risks,
the company's policies require its subsidiaries to hedge their foreign currency exposures from
binding sales and purchase contracts denominated in foreign currencies.
Commodity risk – Different trade good products are used in the company's industry action.
Accordingly it is uncovered to excitability in future cash flows grow from changes in commodity
value. To succeed the price risk of commodities other than electricity, the company's policies
involve that its accessory hedge the commodity price risk.
Interest rate risk – The company has issued bonds at fixed rates. Interest rate swaps are used to
manage the interest rate risk connected with definite debt and specifically such swaps are
selected as fair values security.
Equity risk – The company shows fluctuations in the fair value of its warrant appreciation rights
that are issued under MIP. A WAR provides the right to its holder for receive cash equal to the
market price of an equivalent listed warrant on the date of exercise.
Unrealized holding gains on its financial statements
It is an addition the value of an assets that an enterprise or single continuing to clutch.
This profit has not yet been according to a realized gain on the entity's income statement. In
financial statements are showing unrealized income in income statement in the head of Available
for sale securities and cash flow hedge derivatives (Mulford and Comiskey, 2011). Unrealized
gains arising during the year in 2015 was (7), in 2016 is nothing and in 2017 was 1. after
adjustments its remaining in 2015 was (6), in 2016 was nothing and in 2017 was 1. in section
cash flow hedge derivatives it is arising during the year is (20) in 2015, 16 in 2016 and in 2017
was 38 but after all adjustments and changes it is remaining 10 in 2015, 10 in 2016 and 13 in
2017. so from 2015 to 2017 not big changes coming in gains. In the end at December 31, 2017,
2016 and 2015 accumulated other comprehensive loss included net unrealized gains of $12
⊘ This is a preview!⊘
Do you want full access?
Subscribe today to unlock all pages.
Trusted by 1+ million students worldwide
million. Unrealized gains and losses on derivatives where the underlying hedged transaction has
not yet been realized is 126 in 2017, (65) in 2016 and 67 in 2015.
Market change causes a holding gain classified as available for sale or trading securities
Debt securities are classified in held to maturity and available for sales at the time of
purchase. On the date of reporting the suitability of the categorization of the company's
investment funds in debt and equity securities for reassessed (Agoglia, Doupnik and Tsakumis,
2011). The company execute in periodic review for debt and security to determine other than
temporary impairment has occurred. According to market situation fair value of debt security is
less than its amortized cost then an other than temporary impairment for the differences is
identified (1) it is more probable than not that the company AAB Ltd will be postulate to sold out
safety before improvement of its pay off cost (2) the company has use to purpose for the selling
security (3) a credit loss exists when company does not expect to acquire the full accepted
amortized cost of the security.
CONCLUSION
From the above report it is concluded that finance accounting is important terminology
for the company. With the help of this know about the specific items and that are affected
according to market situation. Some specific methods are explained in annual report of AAB Ltd.
So after this report market position is good compare to last years.
Paraphrase This Document
Need a fresh take? Get an instant paraphrase of this document with our AI Paraphraser
REFRENCES
Books and Journals
Beatty, A. and Liao, S., 2014. Financial accounting in the banking industry: A review of the
empirical literature. Journal of Accounting and Economics. 58(2-3). pp.339-383.
Lovell, H., 2014. Climate change, markets and standards: the case of financial accounting.
Economy and Society. 43(2). pp.260-284.
Fülbier, R. U. and Weller, M., 2011. A glance at German financial accounting research between
1950 and 2005: A publication and citation analysis. Schmalenbach Business Review.
63(1). pp.2-33.
Baxter, R. J. and Thibodeau, J. C., 2011. Does the use of intelligent learning and assessment
software enhance the acquisition of financial accounting knowledge?. Issues in
Accounting Education. 26(4). pp.647-656.
De Waegenaere, A., Sansing, R. and Wielhouwer, J. L., 2015. Financial accounting effects of tax
aggressiveness: Contracting and measurement. Contemporary Accounting Research.
32(1). pp.223-242.
Carmichael, D.R. and Graham, L., 2012. Accountants' handbook, financial accounting and
general topics (Vol. 1). John Wiley & Sons.
Andrew, J. and Cortese, C., 2011, September. Accounting for climate change and the self-
regulation of carbon disclosures. In Accounting Forum (Vol. 35, No. 3, pp. 130-138).
Elsevier.
Mulford, C. W. and Comiskey, E. E., 2011. The financial numbers game: detecting creative
accounting practices. John Wiley & Sons.
Agoglia, C. P., Doupnik, T. S. and Tsakumis, G. T., 2011. Principles-based versus rules-based
accounting standards: The influence of standard precision and audit committee strength
on financial reporting decisions. The Accounting Review. 86(3). pp.747-767.
Carvalho, L. N. and Salotti, B. M., 2012. Adoption of IFRS in Brazil and the consequences to
accounting education. Issues in Accounting Education. 28(2). pp.235-242.
Narayanaswamy, R., 2017. Financial Accounting: A Managerial Perspective. PHI Learning Pvt.
Ltd..
Online
Fixed assets turn over. 2018. [Online]. Available through:
<https://www.myaccountingcourse.com/financial-ratios/fixed-asset-turnover>
1 out of 11
Related Documents


Your All-in-One AI-Powered Toolkit for Academic Success.
+13062052269
info@desklib.com
Available 24*7 on WhatsApp / Email
![[object Object]](/_next/static/media/star-bottom.7253800d.svg)
Unlock your academic potential
Copyright © 2020–2026 A2Z Services. All Rights Reserved. Developed and managed by ZUCOL.