Financial Analysis and Investment Appraisal for ABC Consulting LLP
VerifiedAdded on 2020/12/29
|20
|4779
|73
Report
AI Summary
This report presents a financial analysis of ABC Consulting LLP, focusing on its performance and potential for expansion. It examines the company's financial statements, including the Statement of Profit or Loss, Statement of Financial Position, and Statement of Cash Flows, to assess profitability, liquidity, and cash flow management. The analysis includes key financial ratios such as gross profit margin, net profit ratio, current ratio, and return on assets. Furthermore, the report applies investment appraisal techniques to evaluate the feasibility of expansion into the Australian market and discusses the sources of finance and non-financial factors influencing the firm's operations. The analysis reveals a decrease in profitability in the recent financial year, prompting recommendations for cost control. The report also provides a segmental analysis of the UK and US markets, highlighting performance differences and areas for improvement. Overall, the report provides a comprehensive overview of ABC Consulting LLP's financial health and strategic considerations for future growth.
FINANCIAL DECISION
MAKING
MAKING
Paraphrase This Document
Need a fresh take? Get an instant paraphrase of this document with our AI Paraphraser
EXECUTIVE SUMMARY
Decision-making particularly in financial perspective is for any company. Present report
deals with ABC Consulting LLP which is engaged in providing financial services. It is planning
to expand in Eastern market as it has established its position and profits that can be attained.
Seeking this, it can be summarized that financial statements have been analysed and company
needs to perform well because profitability has decreased. Moreover, it is performing good in the
US market. Investment appraisal techniques are applied for making analysis whether investment
would be feasible in Australian market or not. Furthermore, sources of finance and non-financial
factors are also explained with regards to firm's nature of operations.
TABLE OF CONTENTS
PART 1- Business Performance Analysis.......................................................................................1
Statement of Profit or Loss (SPL)..........................................................................................1
Statement of Financial Position (SFP)...................................................................................2
Statement of Cash Flows........................................................................................................4
Segmental Analysis................................................................................................................6
PART 2- Investment Appraisal........................................................................................................7
CONCLUSION................................................................................................................................7
REFERENCES................................................................................................................................8
⊘ This is a preview!⊘
Do you want full access?
Subscribe today to unlock all pages.
Trusted by 1+ million students worldwide
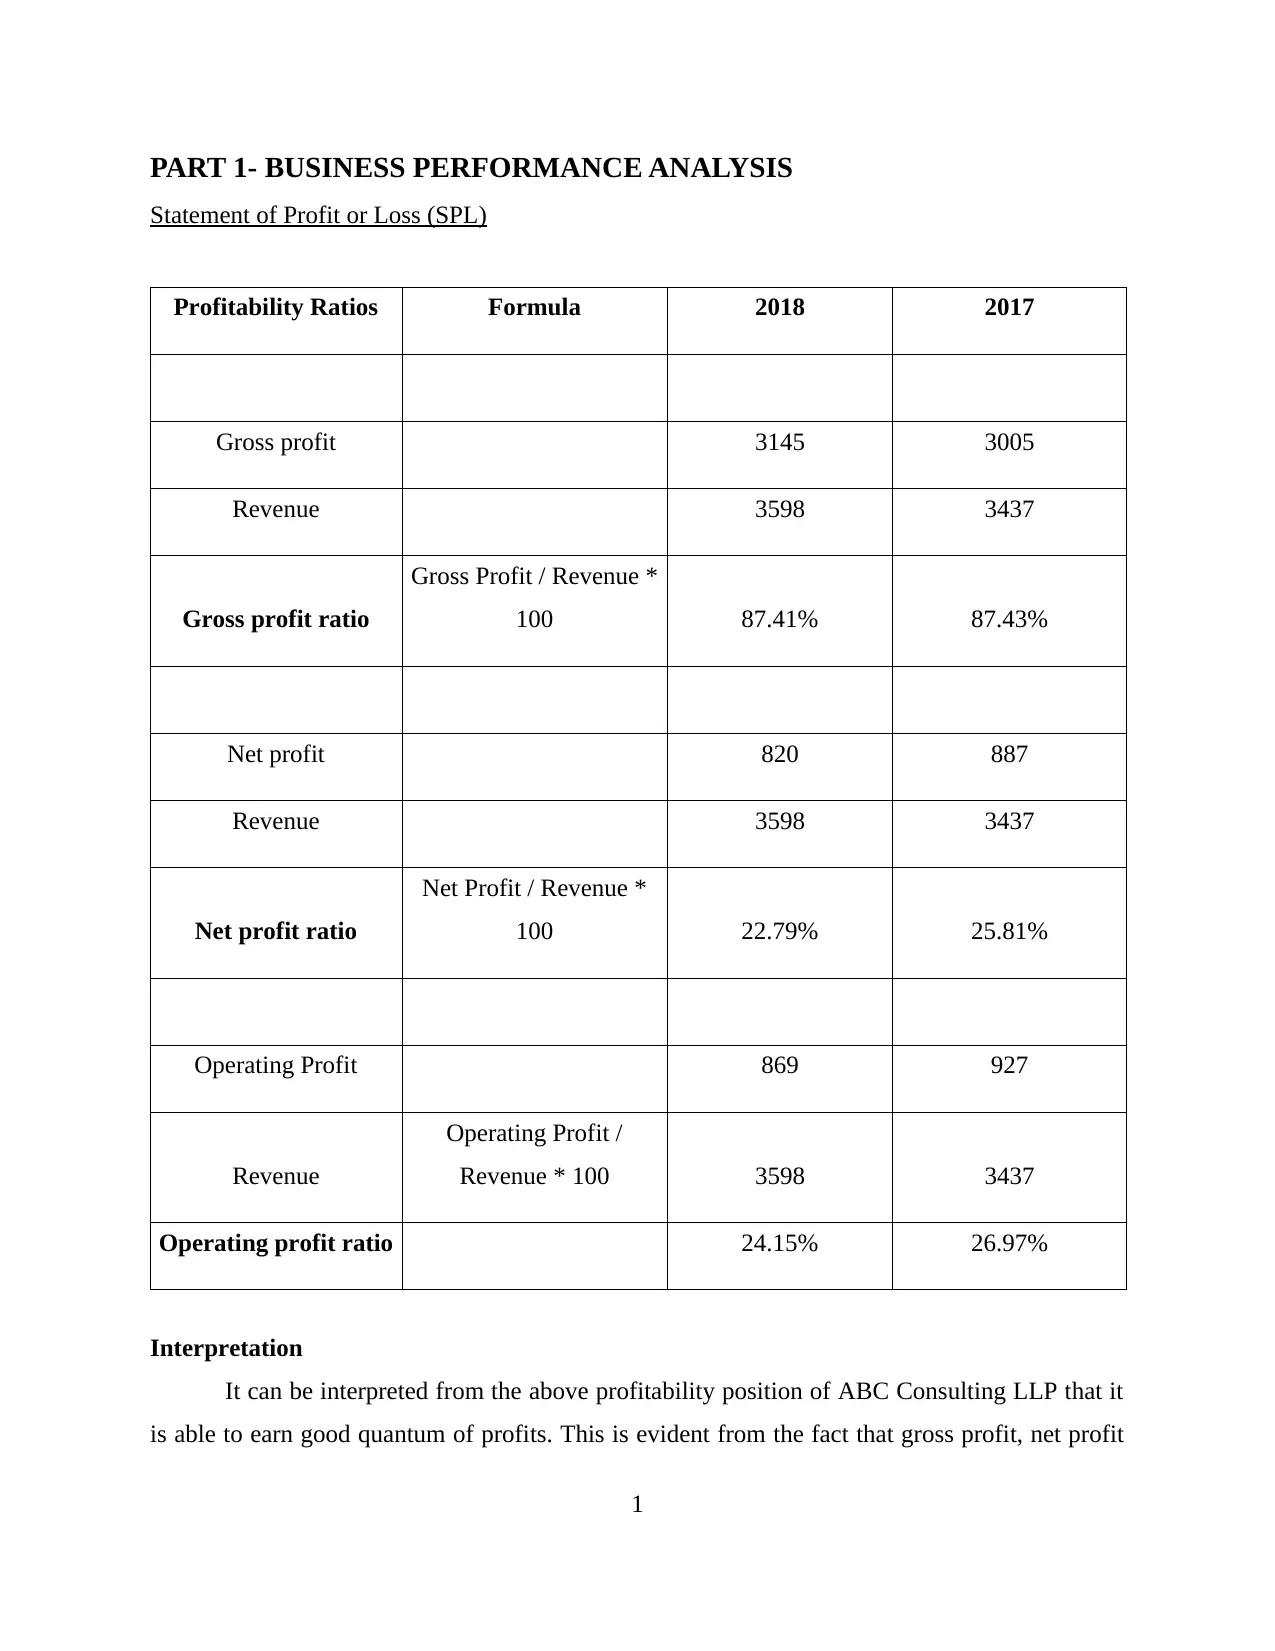
PART 1- BUSINESS PERFORMANCE ANALYSIS
Statement of Profit or Loss (SPL)
Profitability Ratios Formula 2018 2017
Gross profit 3145 3005
Revenue 3598 3437
Gross profit ratio
Gross Profit / Revenue *
100 87.41% 87.43%
Net profit 820 887
Revenue 3598 3437
Net profit ratio
Net Profit / Revenue *
100 22.79% 25.81%
Operating Profit 869 927
Revenue
Operating Profit /
Revenue * 100 3598 3437
Operating profit ratio 24.15% 26.97%
Interpretation
It can be interpreted from the above profitability position of ABC Consulting LLP that it
is able to earn good quantum of profits. This is evident from the fact that gross profit, net profit
1
Paraphrase This Document
Need a fresh take? Get an instant paraphrase of this document with our AI Paraphraser
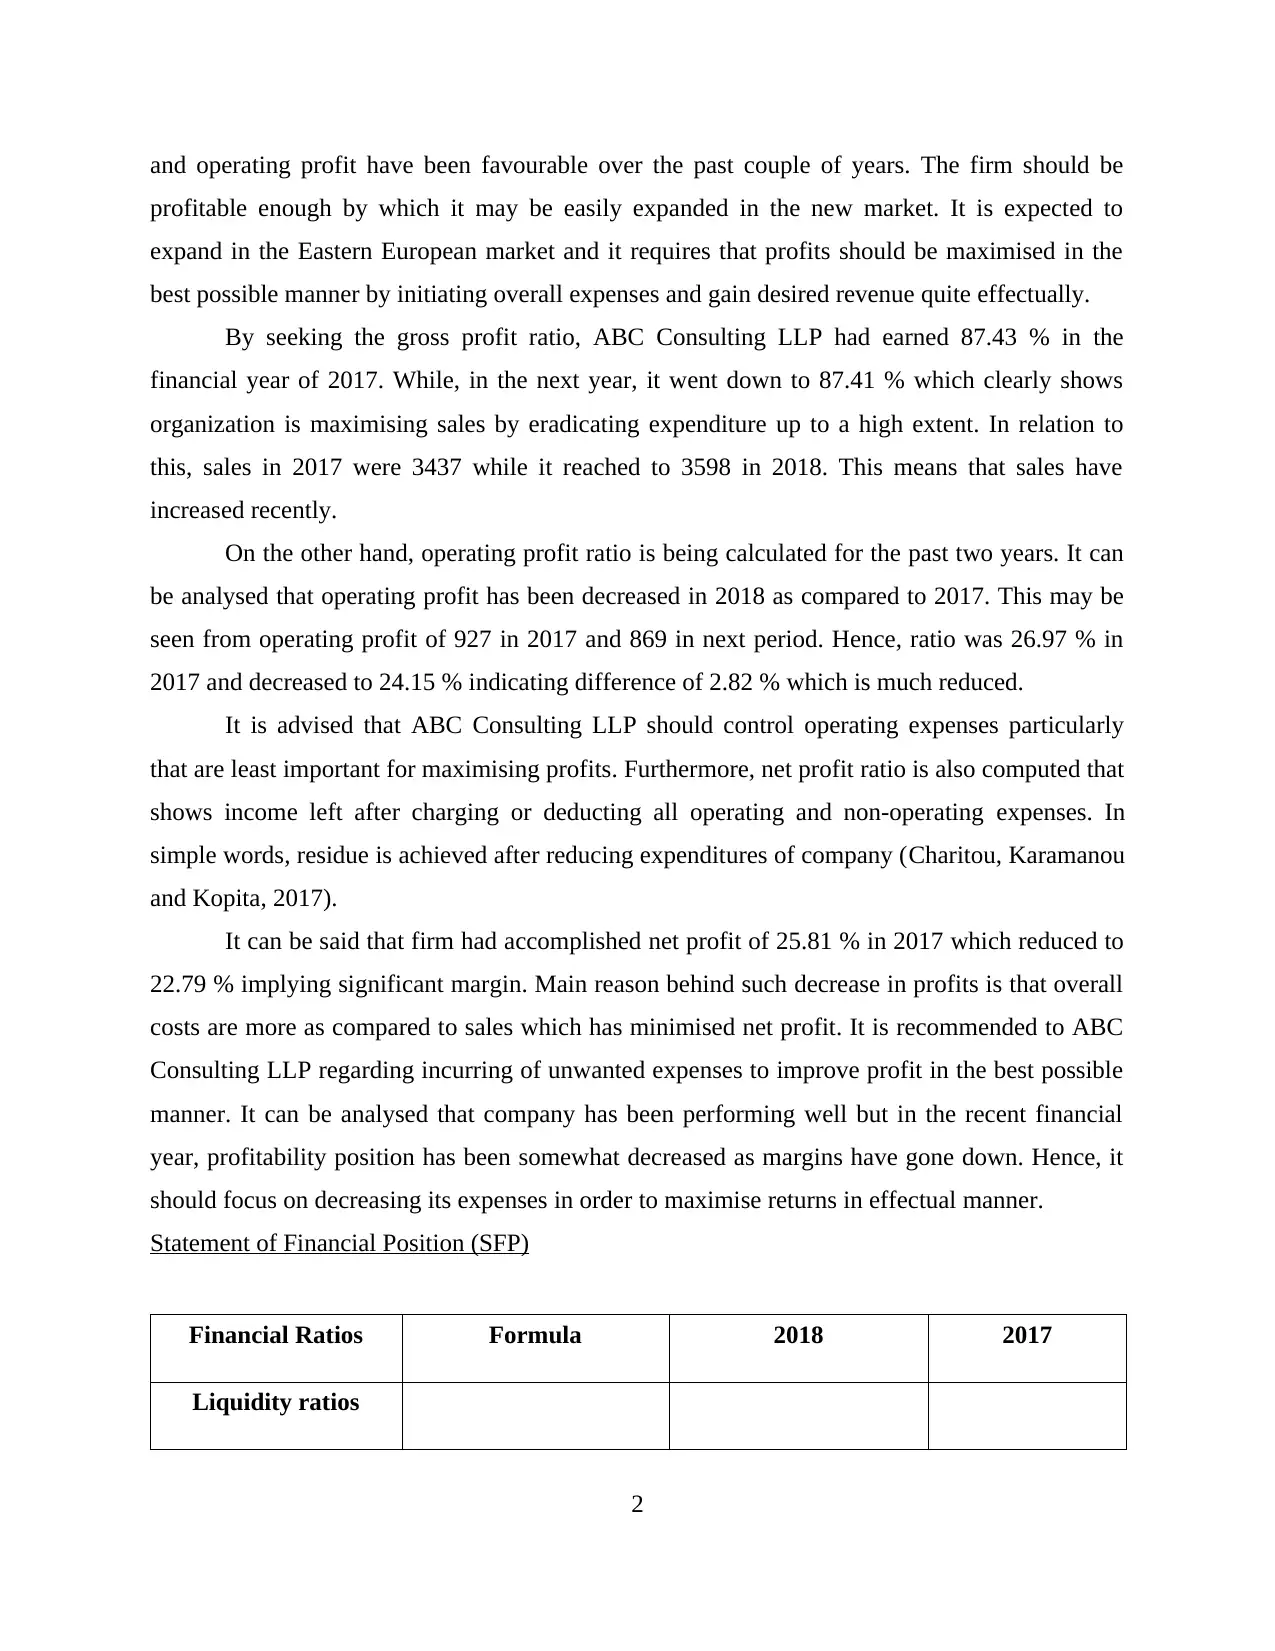
and operating profit have been favourable over the past couple of years. The firm should be
profitable enough by which it may be easily expanded in the new market. It is expected to
expand in the Eastern European market and it requires that profits should be maximised in the
best possible manner by initiating overall expenses and gain desired revenue quite effectually.
By seeking the gross profit ratio, ABC Consulting LLP had earned 87.43 % in the
financial year of 2017. While, in the next year, it went down to 87.41 % which clearly shows
organization is maximising sales by eradicating expenditure up to a high extent. In relation to
this, sales in 2017 were 3437 while it reached to 3598 in 2018. This means that sales have
increased recently.
On the other hand, operating profit ratio is being calculated for the past two years. It can
be analysed that operating profit has been decreased in 2018 as compared to 2017. This may be
seen from operating profit of 927 in 2017 and 869 in next period. Hence, ratio was 26.97 % in
2017 and decreased to 24.15 % indicating difference of 2.82 % which is much reduced.
It is advised that ABC Consulting LLP should control operating expenses particularly
that are least important for maximising profits. Furthermore, net profit ratio is also computed that
shows income left after charging or deducting all operating and non-operating expenses. In
simple words, residue is achieved after reducing expenditures of company (Charitou, Karamanou
and Kopita, 2017).
It can be said that firm had accomplished net profit of 25.81 % in 2017 which reduced to
22.79 % implying significant margin. Main reason behind such decrease in profits is that overall
costs are more as compared to sales which has minimised net profit. It is recommended to ABC
Consulting LLP regarding incurring of unwanted expenses to improve profit in the best possible
manner. It can be analysed that company has been performing well but in the recent financial
year, profitability position has been somewhat decreased as margins have gone down. Hence, it
should focus on decreasing its expenses in order to maximise returns in effectual manner.
Statement of Financial Position (SFP)
Financial Ratios Formula 2018 2017
Liquidity ratios
2
Current Assets 1269 1393
Current liabilities 790 802
Current Ratio
Current assets/ current
liabilities 1.61 1.74
Current Assets 1269 1393
Current liabilities 790 802
Working capital
Current assets - current
liabilities 479 591
CCE (Cash and Cash
equivalents) 75 214
Current liabilities 790 802
Cash ratio CCE / Current liabilities 0.09 0.27
Net income 820 887
Total Assets 2175 1842
Return on Assets
(ROA) Net income / Total assets 0.38 0.48
Interpretation
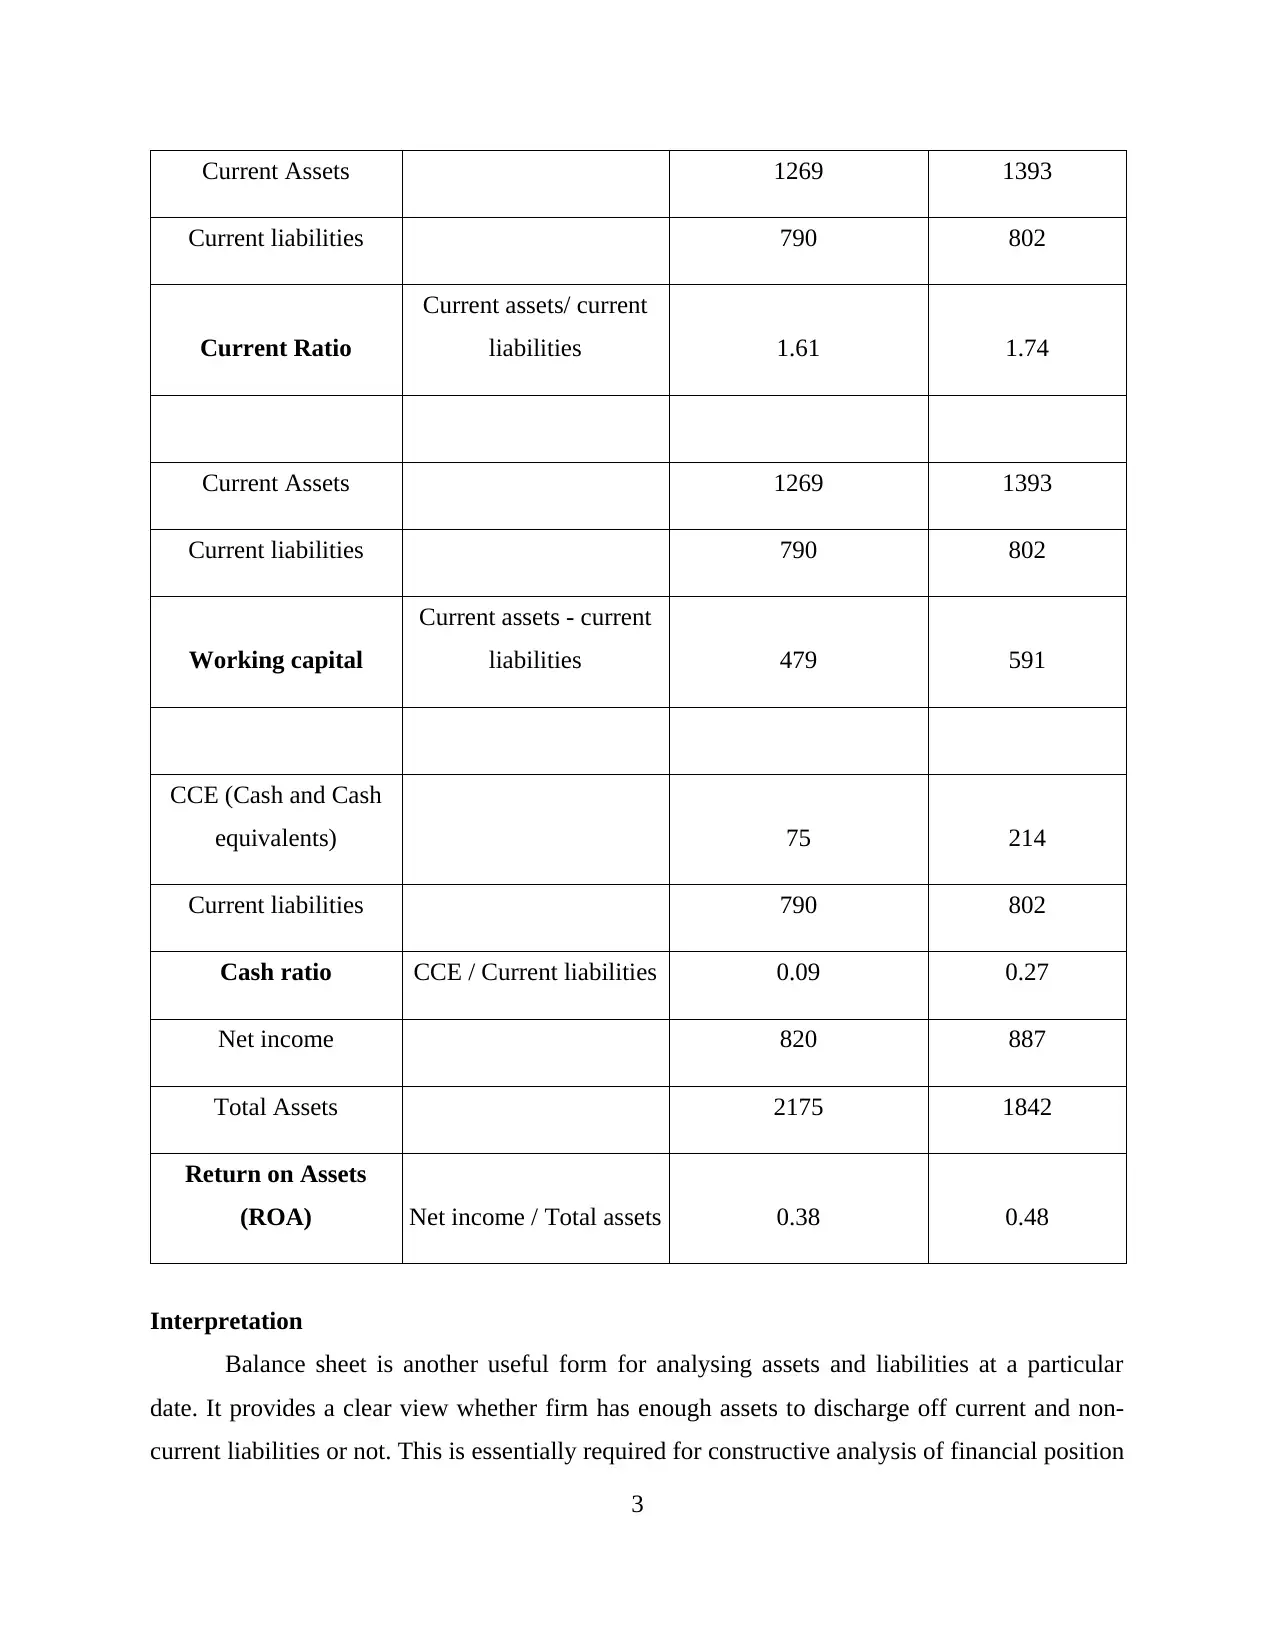
Balance sheet is another useful form for analysing assets and liabilities at a particular
date. It provides a clear view whether firm has enough assets to discharge off current and non-
current liabilities or not. This is essentially required for constructive analysis of financial position
3
Current liabilities 790 802
Current Ratio
Current assets/ current
liabilities 1.61 1.74
Current Assets 1269 1393
Current liabilities 790 802
Working capital
Current assets - current
liabilities 479 591
CCE (Cash and Cash
equivalents) 75 214
Current liabilities 790 802
Cash ratio CCE / Current liabilities 0.09 0.27
Net income 820 887
Total Assets 2175 1842
Return on Assets
(ROA) Net income / Total assets 0.38 0.48
Interpretation
Balance sheet is another useful form for analysing assets and liabilities at a particular
date. It provides a clear view whether firm has enough assets to discharge off current and non-
current liabilities or not. This is essentially required for constructive analysis of financial position
3
⊘ This is a preview!⊘
Do you want full access?
Subscribe today to unlock all pages.
Trusted by 1+ million students worldwide
of company in an effectual manner. Firm has purchased PPE in 2018 which is more than
purchased in previous year. It means that investment is made by company in non-current assets.
By implementation of ratio analysis, liquidity ratio has been computed i.e. current ratio. It
can be analysed that total current assets in 2017 were 1393 which decreased to 1269 in 2018.
Current liabilities were 802 and 790 in 2017 and 2018 respectively. By applying formula, current
ratio comes to 1.74 and 1.61 in both years. In addition to this, ideal standard ratio guided by
market experts is around 2:1. However, it can be seen that the current ratio is decreased in 2018
in comparison to 2017. This means that organization will face difficulties in paying off liabilities
lapsing within time of one year.
Working capital is also calculated by subtracting current liabilities from current assets. It
can be interpreted that working capital in 2017 was 591 which decreased in the next year to 479.
This clearly implies that company has less amount of current assets for discharging current
liabilities in the business. Moreover, it is required that organization should pay-off liabilities in
effectual way which can be achieved only by enhancing working capital with much ease.
However, firm has enough quantum of total assets in 2018 amounting to 2175 while it was 1842
in 2017. Furthermore, firm will have to increase its working capital so that it may be able to
improve upon its position and also requirements of day-to-day basis that can be met quite
effectually.
Moreover, ABC Consulting LLP has enough non-current assets which have been
analysed by seeking financial statement i.e. balance sheet. It can be derived from the same that
PPE (Property, Plant and Equipment) were 370 in 2017 which increased in further year to 827
signifying that firm has made investment in the fixed assets (Gordon and et. al., 2017).
On the other side, current assets include trade receivables and cash. With relation to
receivables ratio, figures in 2017 were 1179 and it increased to 1194 in the next. While, cash has
been reduced up to an extent as figure was 214 in 2017 and reached to 75 in the last year.
Moreover, ROA is also calculated which implies that how much profit is being generated
by company by utilising its assets. The ratio in 2017 was 0.48 while it decreased to 0.38 in 2018.
Higher the ratio, better for the company. However, it can be seen that ratio has been reduced in
4
Paraphrase This Document
Need a fresh take? Get an instant paraphrase of this document with our AI Paraphraser
the past year which implies that firm is not adequately using its assets for generating higher
amount of profits.
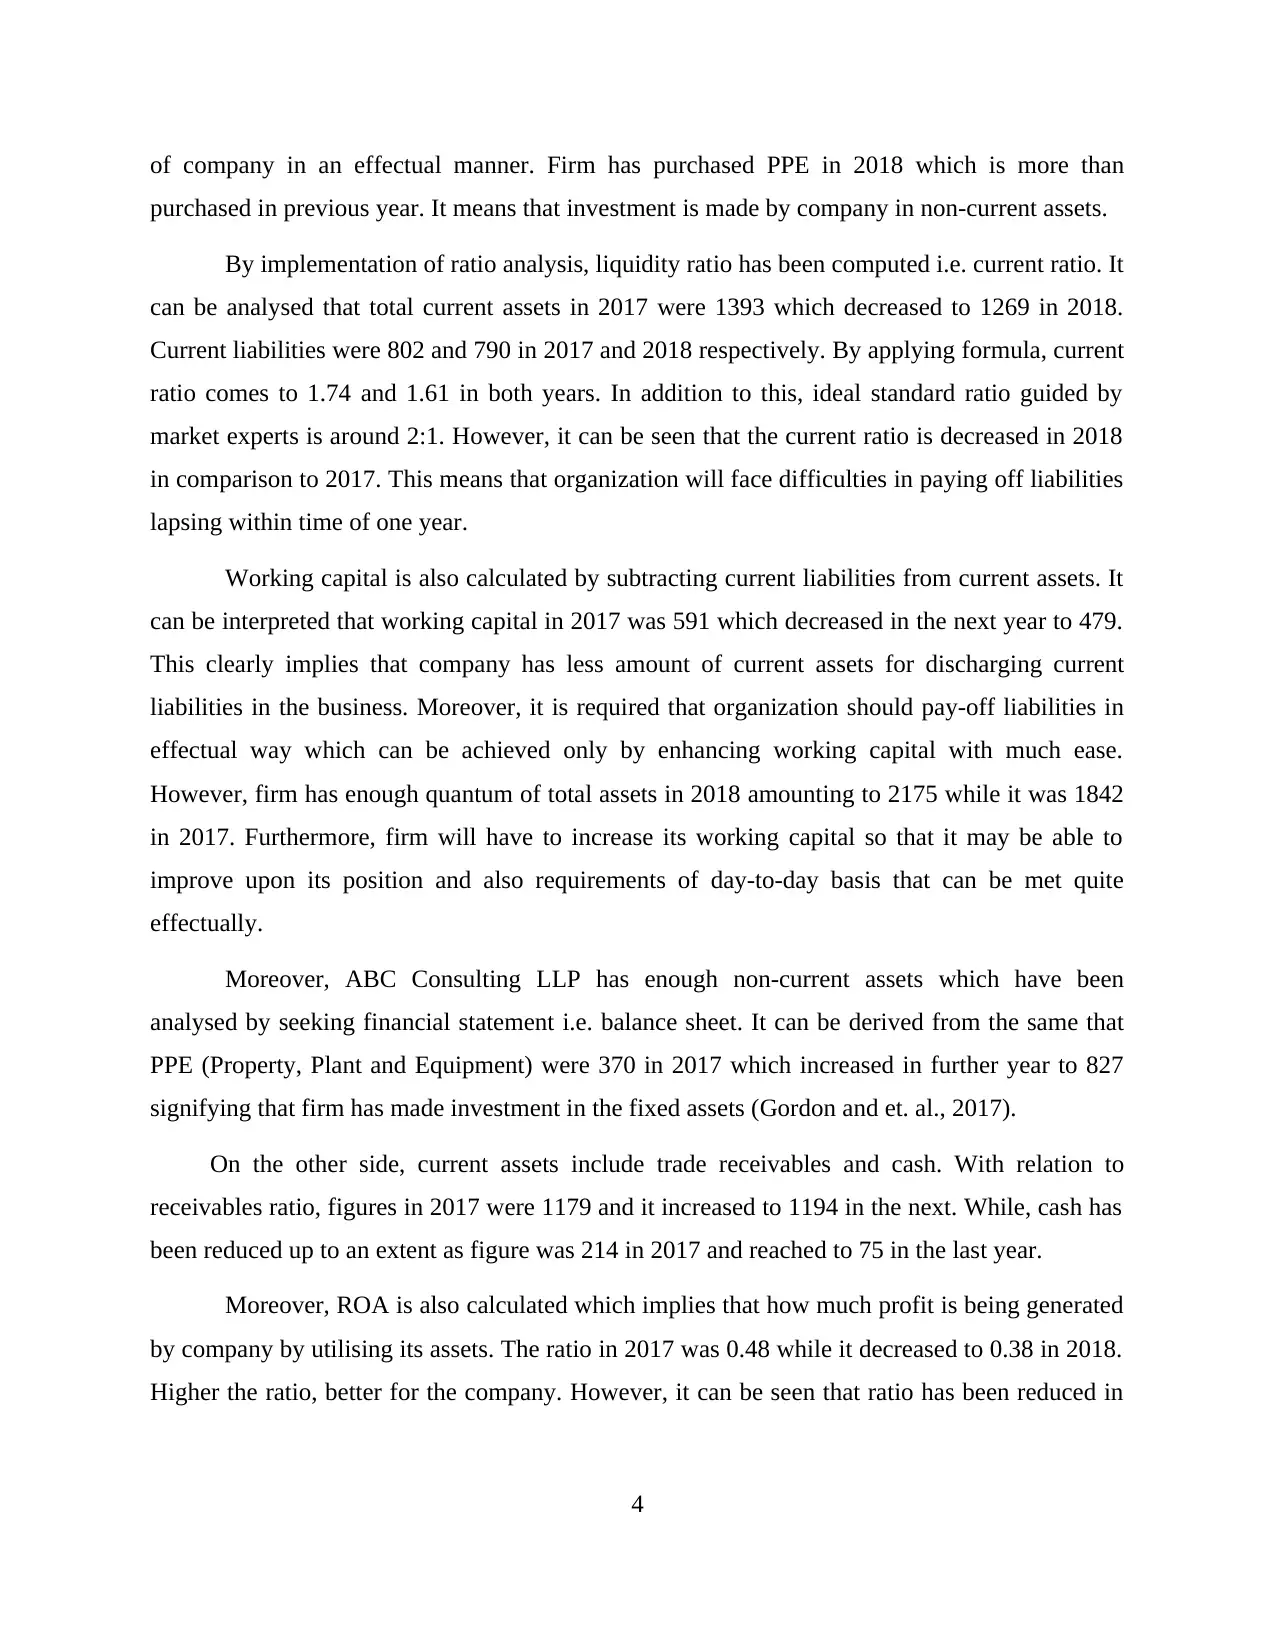
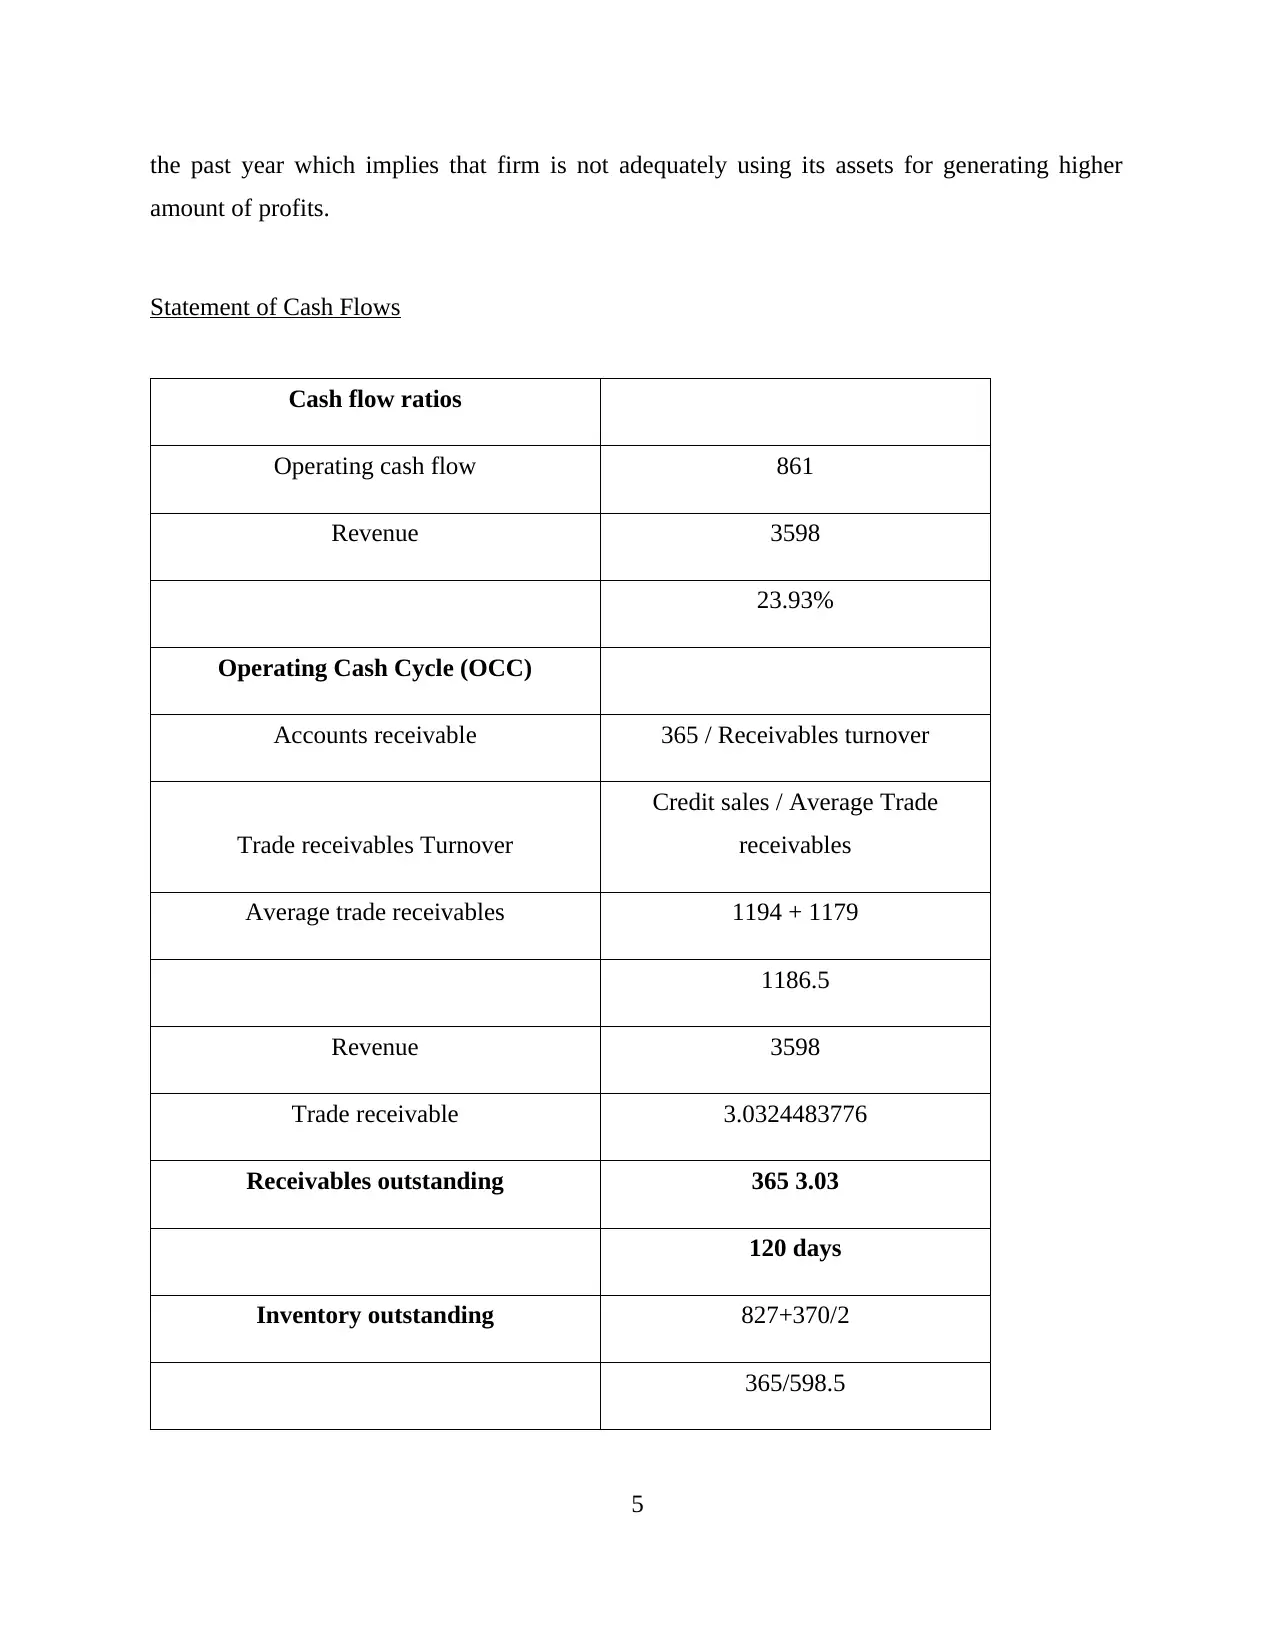
Statement of Cash Flows
Cash flow ratios
Operating cash flow 861
Revenue 3598
23.93%
Operating Cash Cycle (OCC)
Accounts receivable 365 / Receivables turnover
Trade receivables Turnover
Credit sales / Average Trade
receivables
Average trade receivables 1194 + 1179
1186.5
Revenue 3598
Trade receivable 3.0324483776
Receivables outstanding 365 3.03
120 days
Inventory outstanding 827+370/2
365/598.5
5
amount of profits.
Statement of Cash Flows
Cash flow ratios
Operating cash flow 861
Revenue 3598
23.93%
Operating Cash Cycle (OCC)
Accounts receivable 365 / Receivables turnover
Trade receivables Turnover
Credit sales / Average Trade
receivables
Average trade receivables 1194 + 1179
1186.5
Revenue 3598
Trade receivable 3.0324483776
Receivables outstanding 365 3.03
120 days
Inventory outstanding 827+370/2
365/598.5
5
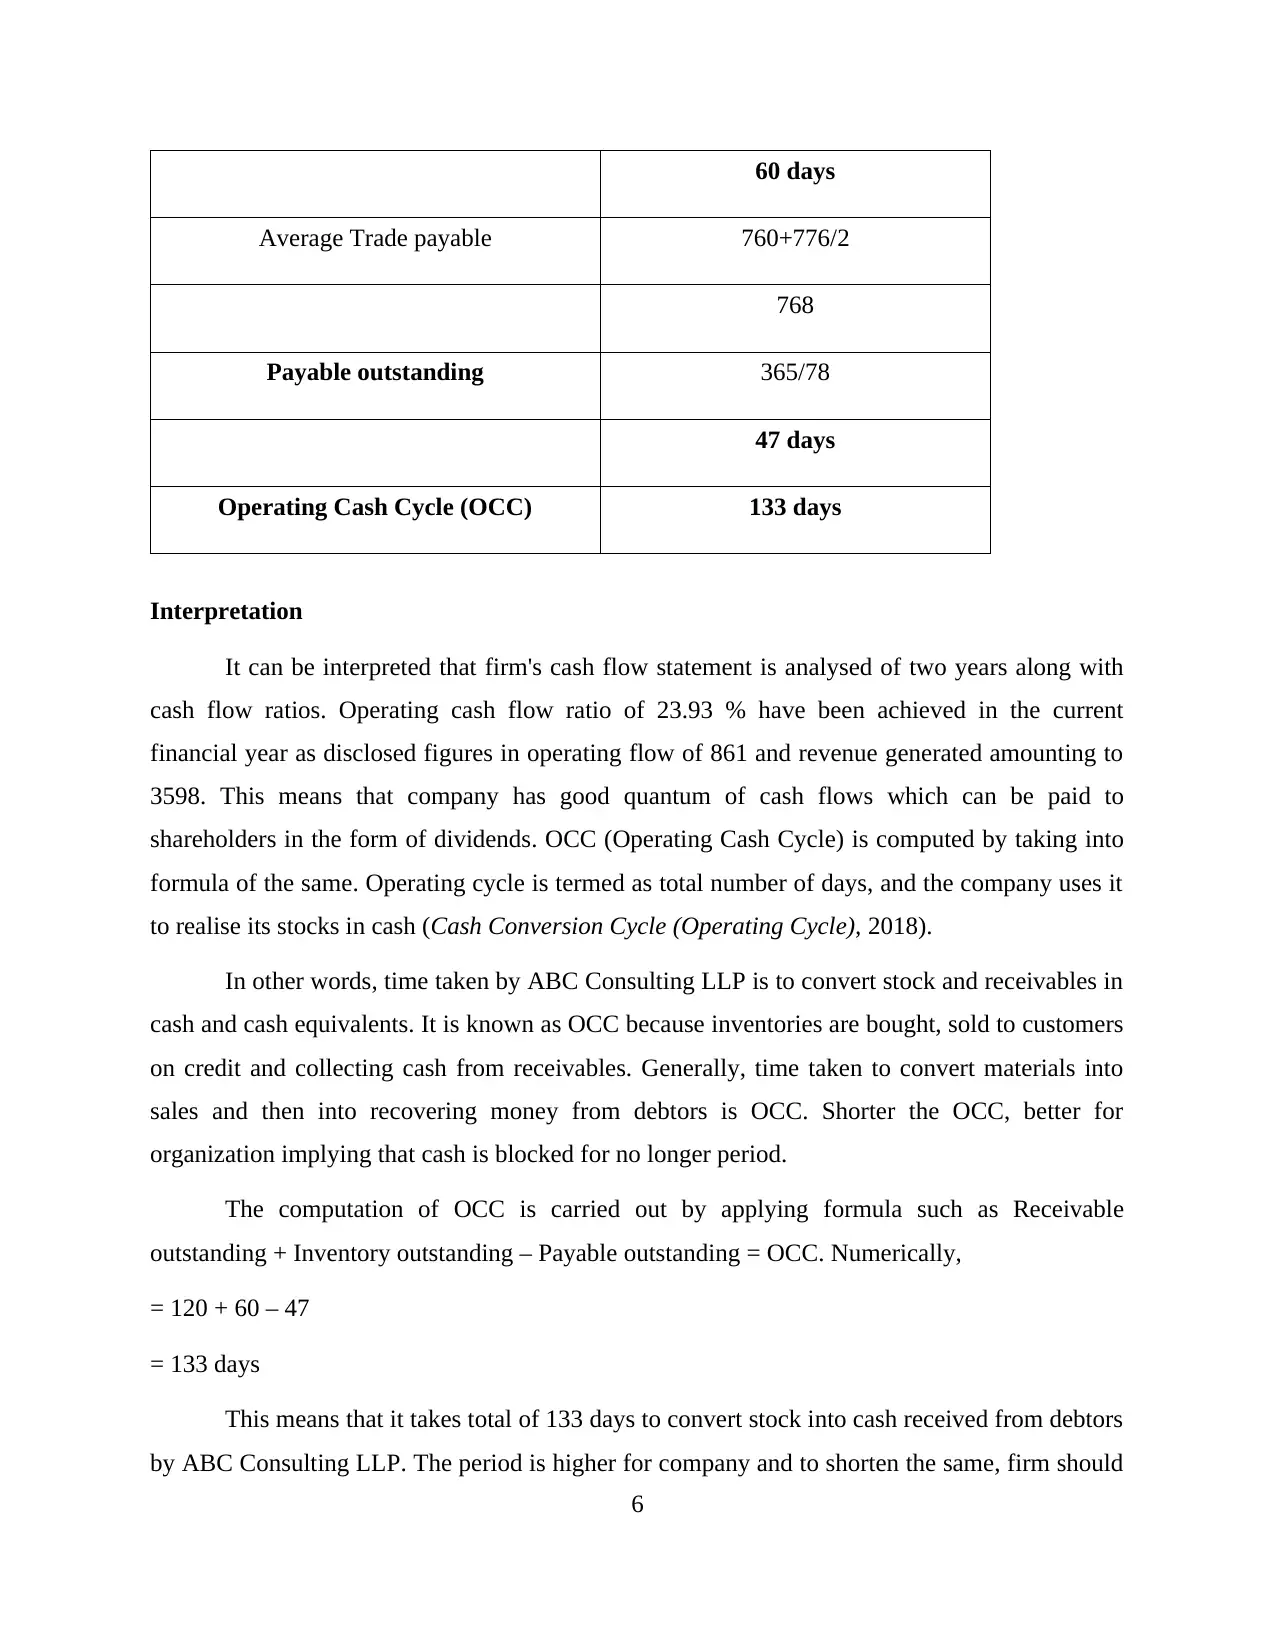
60 days
Average Trade payable 760+776/2
768
Payable outstanding 365/78
47 days
Operating Cash Cycle (OCC) 133 days
Interpretation
It can be interpreted that firm's cash flow statement is analysed of two years along with
cash flow ratios. Operating cash flow ratio of 23.93 % have been achieved in the current
financial year as disclosed figures in operating flow of 861 and revenue generated amounting to
3598. This means that company has good quantum of cash flows which can be paid to
shareholders in the form of dividends. OCC (Operating Cash Cycle) is computed by taking into
formula of the same. Operating cycle is termed as total number of days, and the company uses it
to realise its stocks in cash (Cash Conversion Cycle (Operating Cycle), 2018).
In other words, time taken by ABC Consulting LLP is to convert stock and receivables in
cash and cash equivalents. It is known as OCC because inventories are bought, sold to customers
on credit and collecting cash from receivables. Generally, time taken to convert materials into
sales and then into recovering money from debtors is OCC. Shorter the OCC, better for
organization implying that cash is blocked for no longer period.
The computation of OCC is carried out by applying formula such as Receivable
outstanding + Inventory outstanding – Payable outstanding = OCC. Numerically,
= 120 + 60 – 47
= 133 days
This means that it takes total of 133 days to convert stock into cash received from debtors
by ABC Consulting LLP. The period is higher for company and to shorten the same, firm should
6
⊘ This is a preview!⊘
Do you want full access?
Subscribe today to unlock all pages.
Trusted by 1+ million students worldwide
use inventories in quick manner and also it should apply strict credit policies so that cash can be
collected from debtors with much ease.
On the other hand, firm has made payments to members (partners) amounting to 668 in
2017 while, in next year, it has paid 551 to partners' capital account. The payment has been
reduced despite of good opening balance of 447 in 2018. However, profit for the year is
minimised amounting to 820 which was 887 in 2017. This is the reason for making less payment
to members which is feasible and appropriate as profits are decreased (Yang and et. al., 2018).
Segmental Analysis
UK-
It can be analysed from the above figures that net revenue has been increased in
comparison to 2017. Figure was 2207 in 2017 which got increased to 2251. However, operating
expenses have maximised leading to affect operating profits of company up to a major extent. It
can be analysed that operating expenditures were 1522 and 1674 in past consecutive years. Staff
costs are maximised as well by 33 in comparison to previous year. This means that UK's segment
ratios are calculated of gross profit margin was 45.58 % in 2017 while, increased to 45.18 % in
2018. This shows that margin has decreased in the current year. Operating margin was 33.53 %
signifying that company has initiated good control over operational expenditures. But ratio
reached to 25.63 % in 2018 having much difference as compared to previous year. It means that
UK segment is not performing adequately (Gitman, Juchau and Flanagan, 2015).
US-
The segmental analysis of US market is also being carried out showing whether firm is
earning profits in optimum way or not. Revenue was 324 in 2017 which increased to 553 in 2018
showing that ABC Consulting LLP is making good sales in US. Expenses and disbursements in
2018 was 49 which was 56 in the previous year. This shows that expenses have been reduced
quite effectually. Moreover, net revenue is much more in 2018 and is just double of previous
period.
Deducting operational expenses, the operating profit of 179 is achieved which was
negative in the earlier year. Seeking this, ratios of US segment are computed which are in favour
of firm. Operating margin was -7.84 % in 2017 increased to 35.52 % in 2018 implying
organization has generated good operating income leading to maximum profit. On the other
7
Paraphrase This Document
Need a fresh take? Get an instant paraphrase of this document with our AI Paraphraser
hand, gross margin was 32.84 % and 58.13 in 2017 and 2018 respectively. This clearly shows
that ABC Consulting LLP is earning higher profits in US market as major earnings are
accumulated from this that only leads profitability for company.
8
that ABC Consulting LLP is earning higher profits in US market as major earnings are
accumulated from this that only leads profitability for company.
8
Australia-
It can be interpreted that Australian market is also equally important for the company in
achieving profits in excess (Wu, Chen and Olson, 2014). The figures show that this segment is
not much profitable for it. This is evident from the fact because revenue was 648 in 2017 which
decreased to 516 in 2018 stating sales have gone down.
Expenses and disbursements have also increased affecting operating profit quite badly. It
was 208 in 2017 that reduced to 113. Staff costs are maximised as well which is shown by
figures. In relation to this, gross margin was 70.57 % in 2017 which decreased to 55.13 %.
Similarly, operating margin was 39.25 % in 2017 and reached failure in the next year to 28.97 %.
By considering segmental analysis, it can be interpreted that firm is better performing in US
market as profitability ratios are higher.
PART 2- INVESTMENT APPRAISAL
With the present investment, appraisal information by the Financial Director, management can
forecast about the future return of the new project planned.
Management Forecast
Exhibit 3:
1
⊘ This is a preview!⊘
Do you want full access?
Subscribe today to unlock all pages.
Trusted by 1+ million students worldwide
1 out of 20


Your All-in-One AI-Powered Toolkit for Academic Success.
+13062052269
info@desklib.com
Available 24*7 on WhatsApp / Email
![[object Object]](/_next/static/media/star-bottom.7253800d.svg)
Unlock your academic potential
Copyright © 2020–2026 A2Z Services. All Rights Reserved. Developed and managed by ZUCOL.